Poland Urea Market Outlook | COVID-19 IMPACT, Forecast, Trends, Analysis, Revenue, Size, Companies, Industry, Share, Growth & Value
Market Forecast By Grade (Fertilizer, Feed, Technical), By End-user Industry (Agriculture, Chemical, Automotive, Medical, Others) And Competitive Landscape
| Product Code: ETC210987 | Publication Date: May 2022 | Updated Date: Apr 2026 | Product Type: Market Research Report | |
| Publisher: 6Wresearch | Author: Ravi Bhandari | No. of Pages: 60 | No. of Figures: 40 | No. of Tables: 7 |
Poland Urea Market Size (2020-2030)
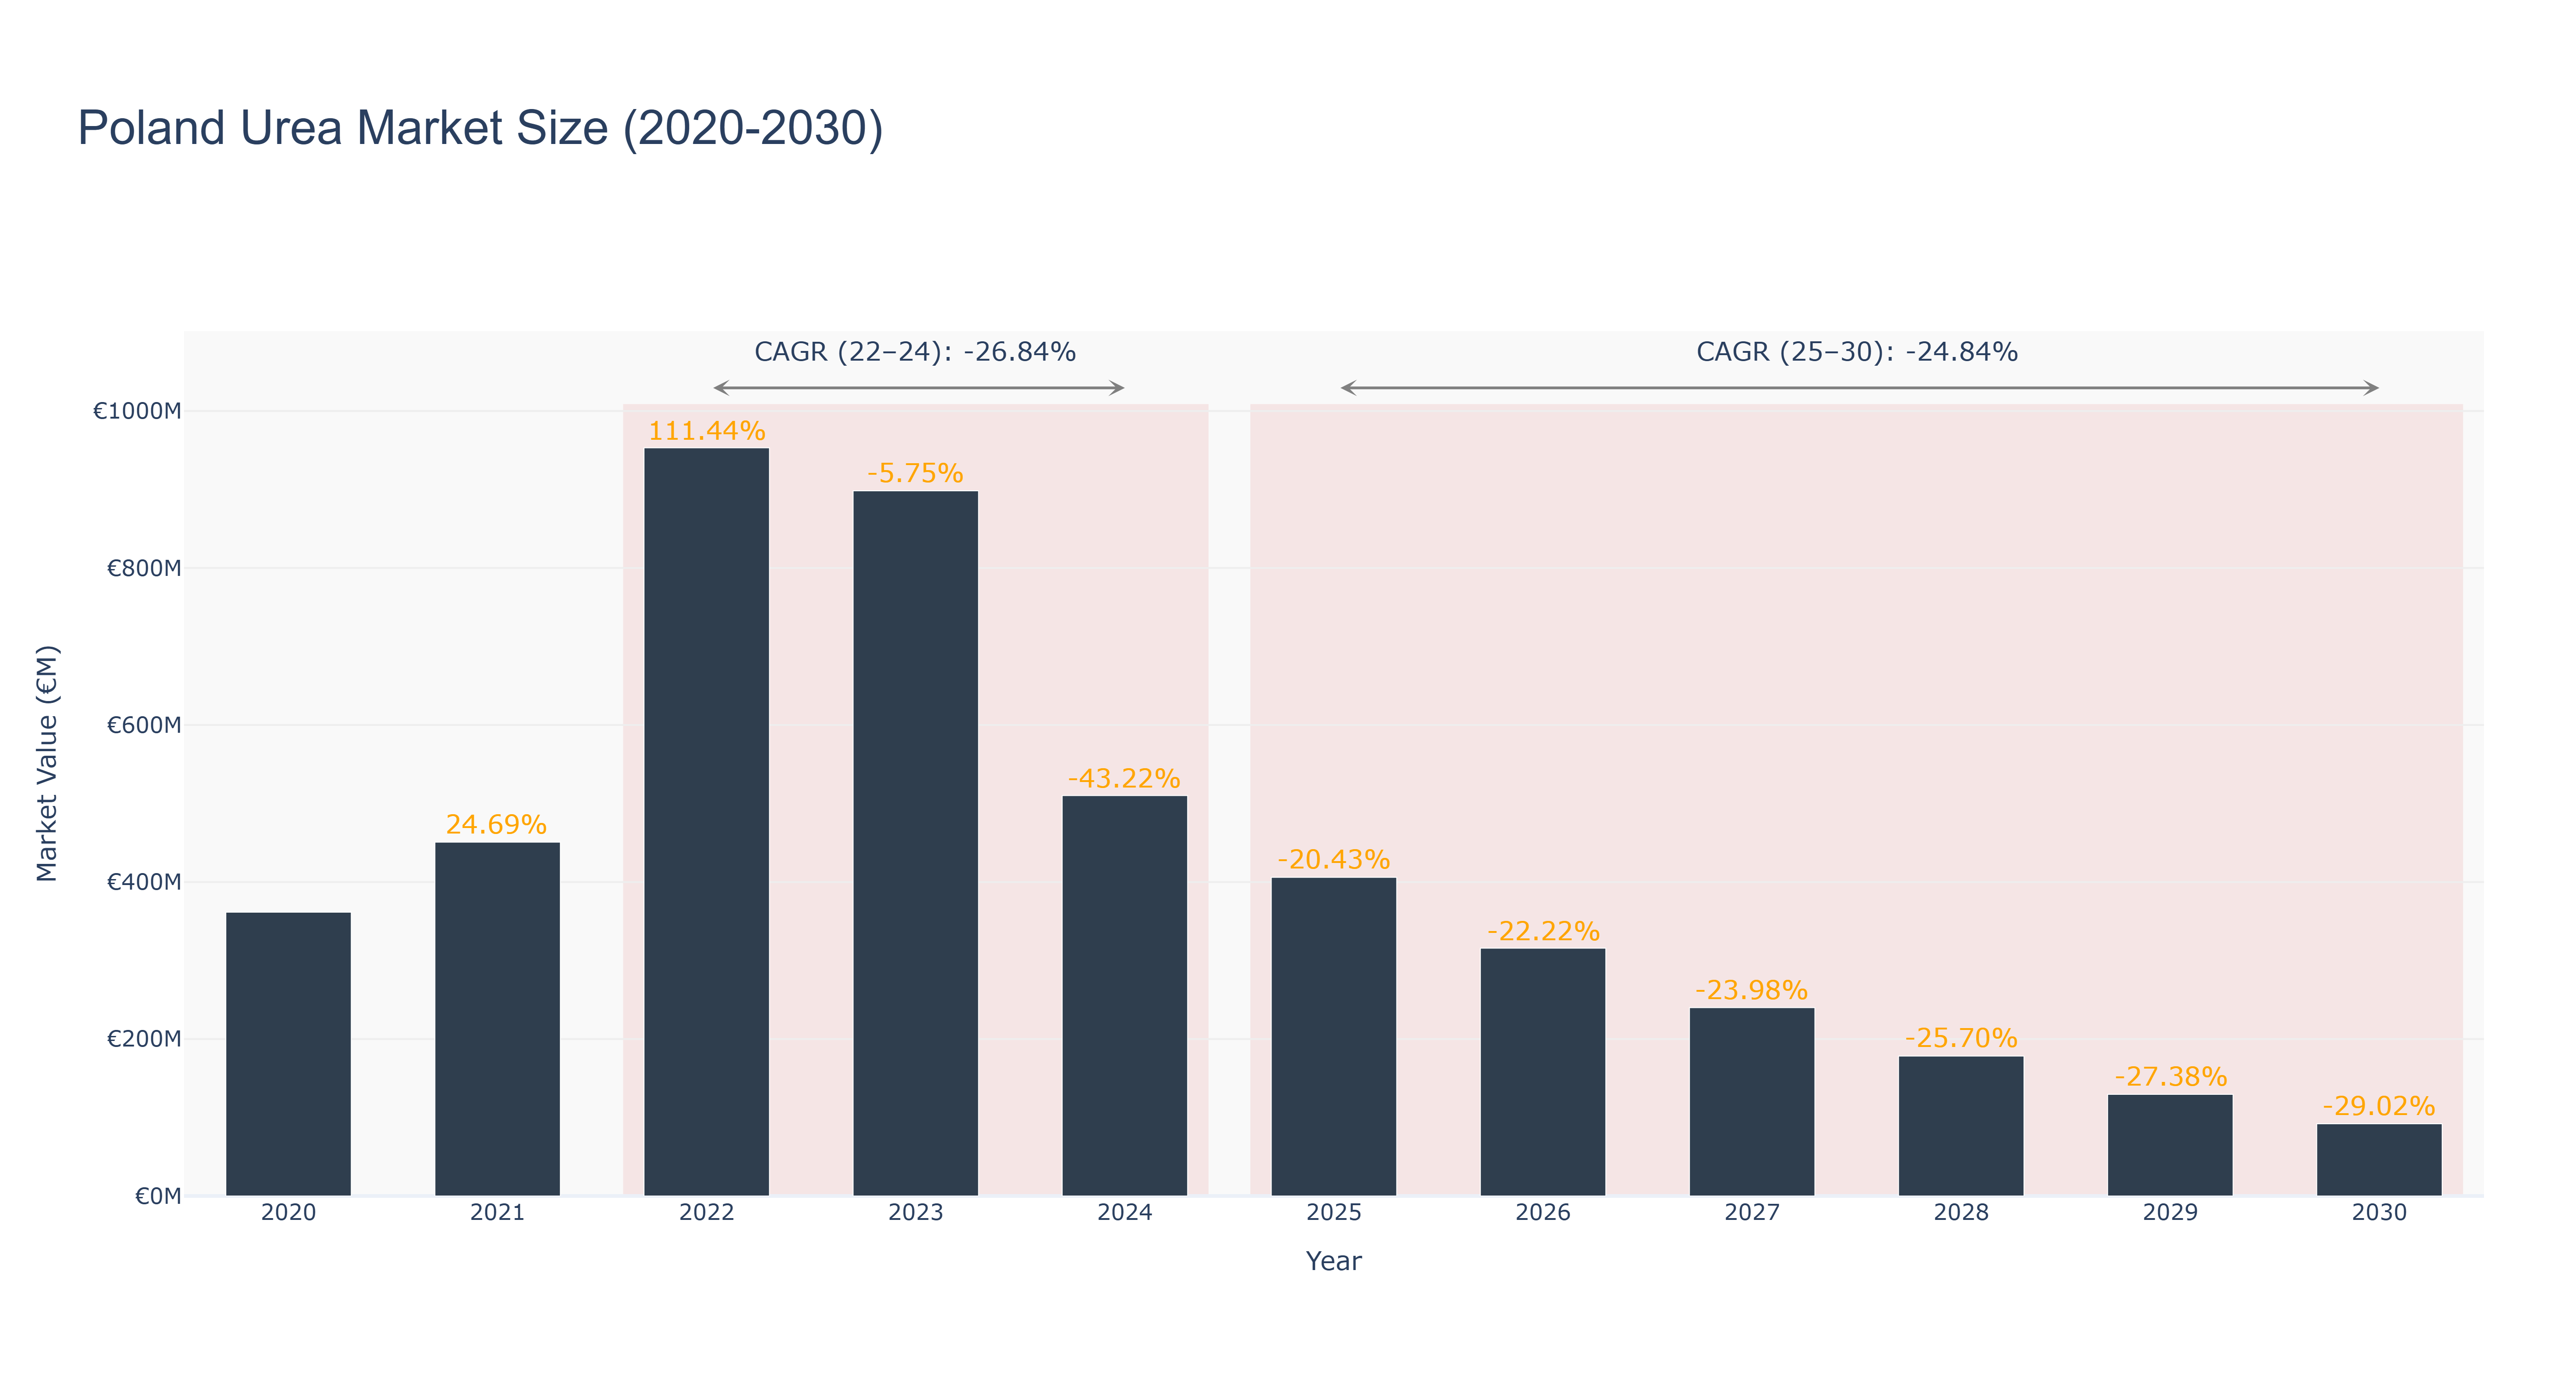
Poland Urea Market has experienced a fluctuating trend over the years. The peak market size of €953.12 million was recorded in 2022, followed by a significant decline to €510.10 million in 2024. The market is forecasted to continue shrinking with a projected size of €91.93 million in 2030. The CAGR for the period 2022-24 was -26.84%, while for 2025-30 it is estimated at -24.84%. The market downturn can be attributed to factors such as changing agricultural practices, fluctuating raw material prices, and evolving environmental regulations. However, upcoming projects aimed at enhancing urea production efficiency and sustainability are expected to positively impact the market in the near future. Industry drivers such as increasing demand for fertilizers and technological advancements are likely to drive growth in the long term.
Poland Urea Market: Production & Trade Performance (2019-2025)
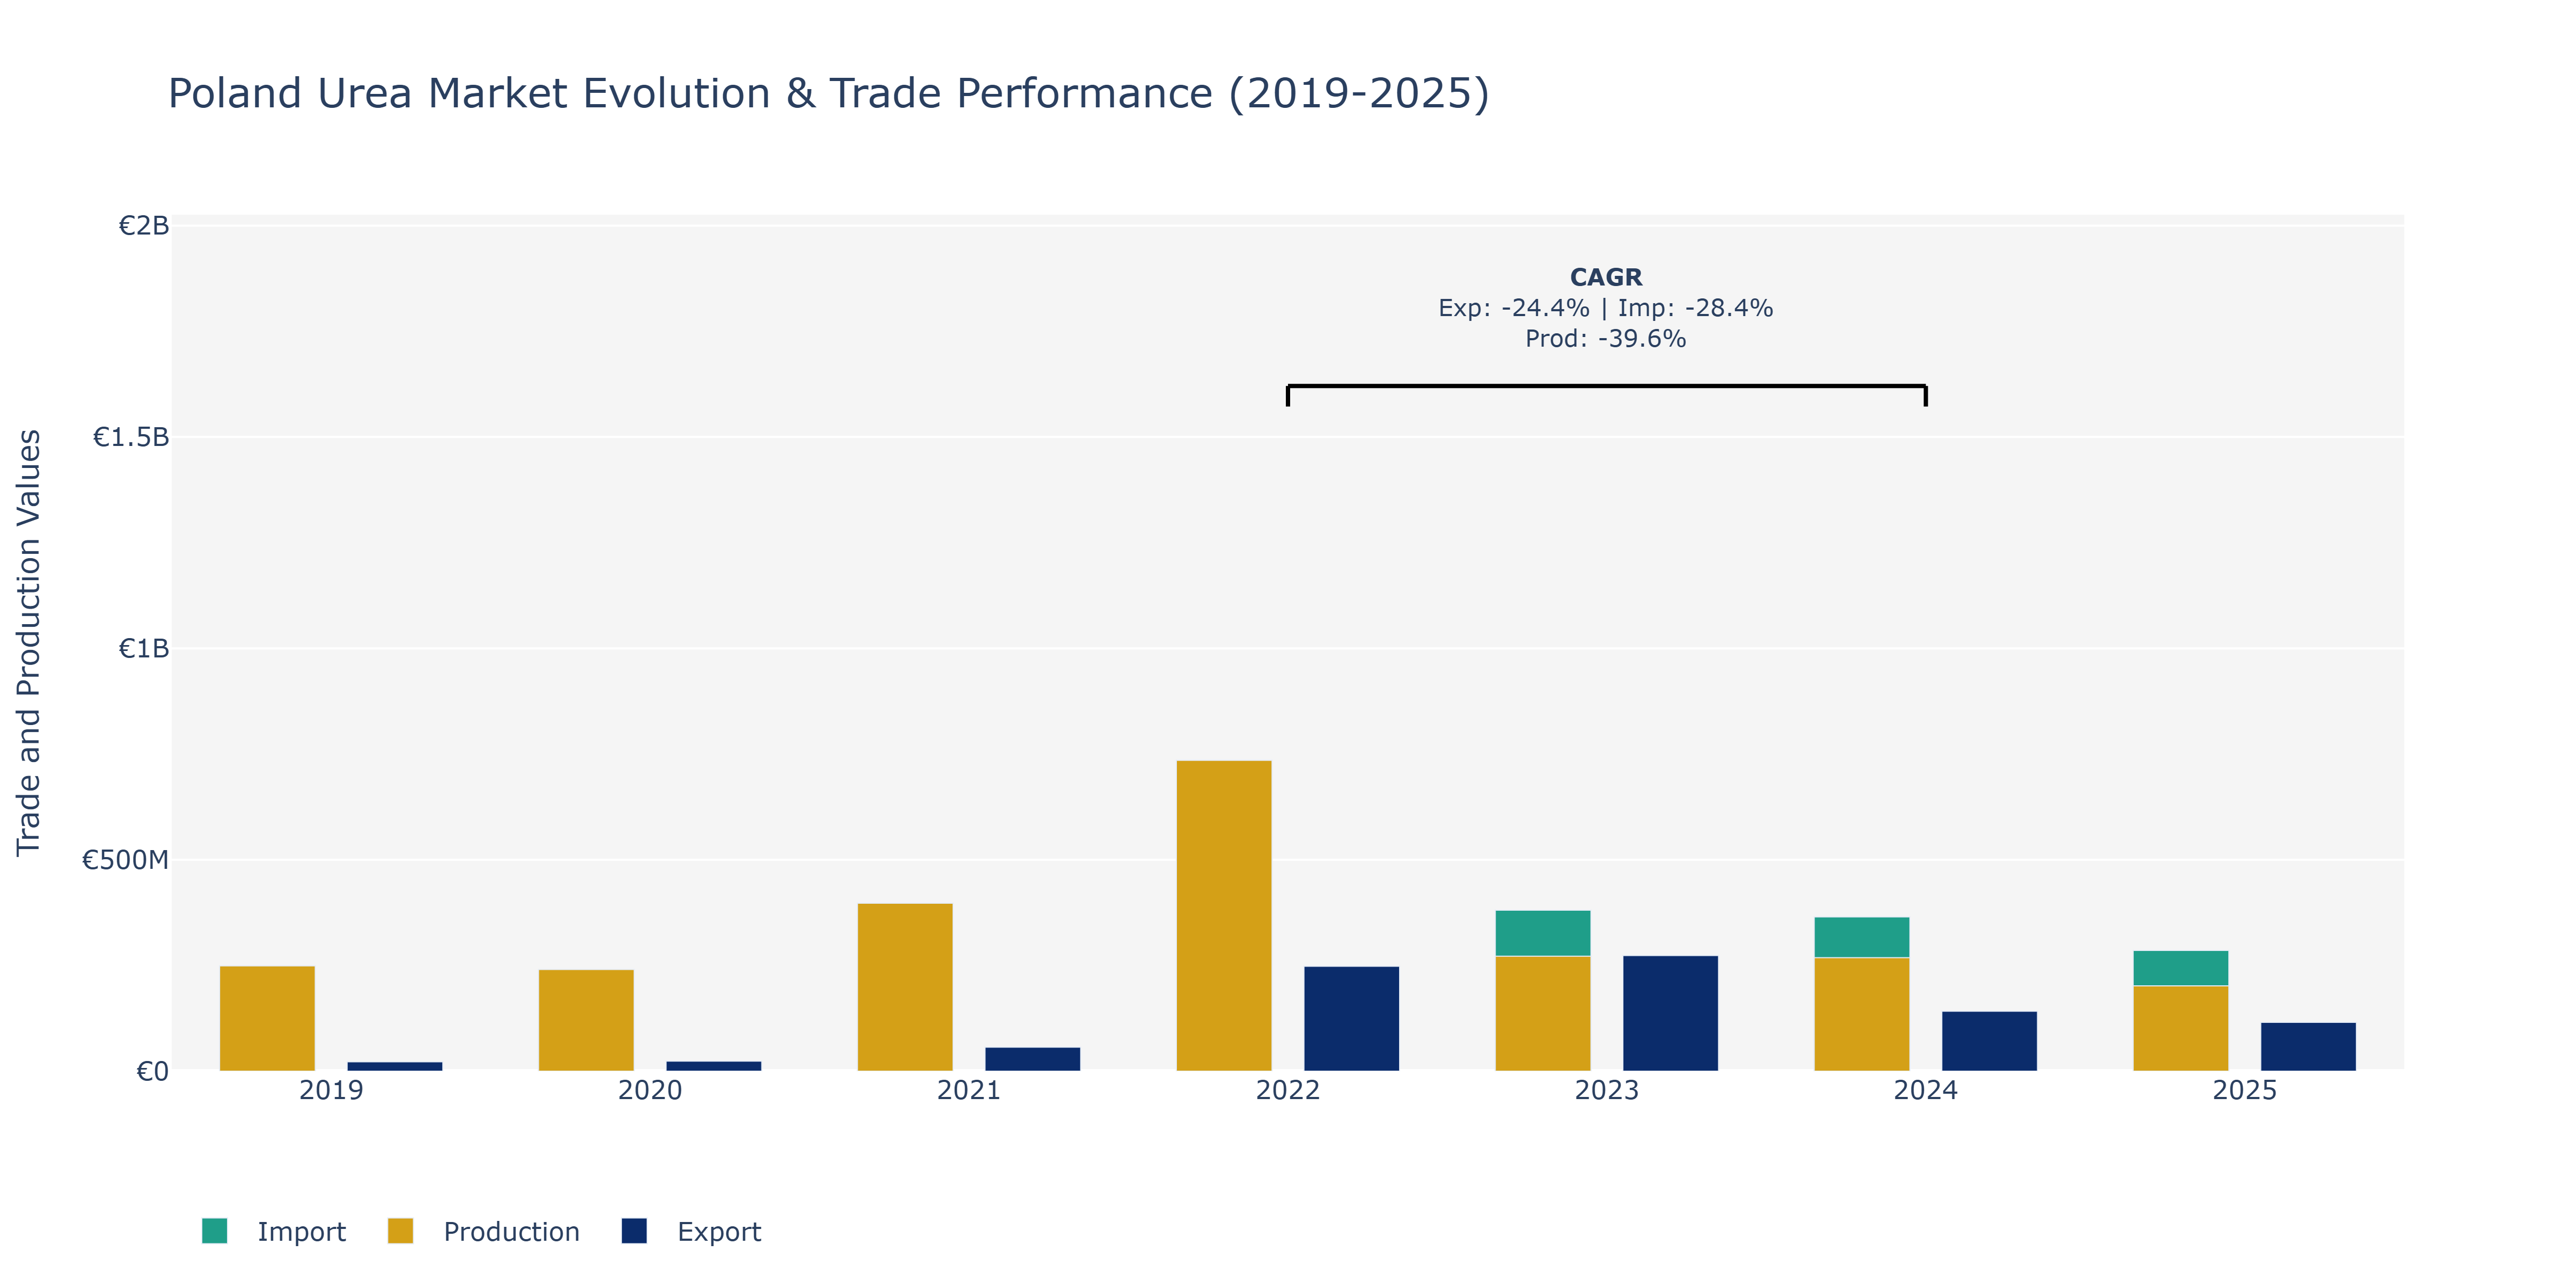
In the Poland Urea Market, from 2019 to 2025, both exports and production experienced fluctuations while imports showed a consistent downward trend. Exports saw a notable increase from €22.31 million in 2019 to €273.56 million in 2023 before declining in the following years. Imports decreased steadily from €133.05 million in 2019 to €285.73 million in 2025, reflecting potentially reduced demand or increased domestic production capacity. Meanwhile, production peaked at €397.22 million in 2021 before decreasing to €201.77 million in 2025, possibly due to market saturation or shifts in consumer preferences towards alternative products. These trends may be influenced by factors such as changes in agricultural practices, technological advancements in fertilizer production, or global market conditions affecting trade dynamics in the urea sector. Further analysis could explore how regulatory changes or sustainability initiatives impact the market's supply chain and trade relationships in the coming years.
Poland Urea Market Overview
The Urea market in Poland is largely driven by agricultural demand, as urea is a key component in nitrogen-based fertilizers. The market is influenced by factors like crop production, global fertilizer prices, and environmental regulations surrounding fertilizer use.
Drivers of the market
The Urea market in Poland is driven by the demand for urea as a key ingredient in fertilizers and industrial applications. Urea is widely used to enhance soil fertility and improve crop yields, supporting the agricultural sector. The growth of the agriculture industry, coupled with the increasing need for efficient and sustainable fertilizers, is driving the demand for urea. Additionally, urea is used in various industrial processes, including the production of resins and adhesives, further contributing to the market`s expansion.
Challenges of the market
The Urea market in Poland faces challenges such as fluctuations in global urea prices, which can impact local market dynamics and profitability. There are also concerns related to the environmental impact of urea production and its use in agriculture, requiring compliance with stringent environmental regulations. The market struggles with issues related to the availability and cost of raw materials used in urea production. Additionally, there are challenges associated with the efficient distribution and storage of urea products. The market must also address competition from alternative fertilizers and the need to innovate and improve urea formulations to meet changing agricultural demands.
Government Policy of the market
The Urea market in Poland is affected by agricultural policies and environmental regulations. The Polish government, in line with EU agricultural policies, supports the use of urea fertilizers to enhance crop yields while also regulating their use to minimize environmental impact. This includes policies aimed at reducing nitrogen runoff and promoting sustainable agricultural practices. Additionally, the governments support for agricultural productivity drives demand for urea as a key component in fertilizers.
Key Highlights of the Report:
- Poland Urea Market Outlook
- Market Size of Poland Urea Market, 2024
- Forecast of Poland Urea Market, 2031
- Historical Data and Forecast of Poland Urea Revenues & Volume for the Period 2018 - 2031
- Poland Urea Market Trend Evolution
- Poland Urea Market Drivers and Challenges
- Poland Urea Price Trends
- Poland Urea Porter's Five Forces
- Poland Urea Industry Life Cycle
- Historical Data and Forecast of Poland Urea Market Revenues & Volume By Grade for the Period 2018 - 2031
- Historical Data and Forecast of Poland Urea Market Revenues & Volume By Fertilizer for the Period 2018 - 2031
- Historical Data and Forecast of Poland Urea Market Revenues & Volume By Feed for the Period 2018 - 2031
- Historical Data and Forecast of Poland Urea Market Revenues & Volume By Technical for the Period 2018 - 2031
- Historical Data and Forecast of Poland Urea Market Revenues & Volume By End-user Industry for the Period 2018 - 2031
- Historical Data and Forecast of Poland Urea Market Revenues & Volume By Agriculture for the Period 2018 - 2031
- Historical Data and Forecast of Poland Urea Market Revenues & Volume By Chemical for the Period 2018 - 2031
- Historical Data and Forecast of Poland Urea Market Revenues & Volume By Automotive for the Period 2018 - 2031
- Historical Data and Forecast of Poland Urea Market Revenues & Volume By Medical for the Period 2018 - 2031
- Historical Data and Forecast of Poland Urea Market Revenues & Volume By Others for the Period 2018 - 2031
- Poland Urea Import Export Trade Statistics
- Market Opportunity Assessment By Grade
- Market Opportunity Assessment By End-user Industry
- Poland Urea Top Companies Market Share
- Poland Urea Competitive Benchmarking By Technical and Operational Parameters
- Poland Urea Company Profiles
- Poland Urea Key Strategic Recommendations
Frequently Asked Questions About the Market Study (FAQs):
6Wresearch actively monitors the Poland Urea Market and publishes its comprehensive annual report, highlighting emerging trends, growth drivers, revenue analysis, and forecast outlook. Our insights help businesses to make data-backed strategic decisions with ongoing market dynamics. Our analysts track relevent industries related to the Poland Urea Market, allowing our clients with actionable intelligence and reliable forecasts tailored to emerging regional needs.
Yes, we provide customisation as per your requirements. To learn more, feel free to contact us on sales@6wresearch.com
1 Executive Summary |
2 Introduction |
2.1 Key Highlights of the Report |
2.2 Report Description |
2.3 Market Scope & Segmentation |
2.4 Research Methodology |
2.5 Assumptions |
3 Poland Urea Market Overview |
3.1 Poland Country Macro Economic Indicators |
3.2 Poland Urea Market Revenues & Volume, 2021 & 2031F |
3.3 Poland Urea Market - Industry Life Cycle |
3.4 Poland Urea Market - Porter's Five Forces |
3.5 Poland Urea Market Revenues & Volume Share, By Grade, 2021 & 2031F |
3.6 Poland Urea Market Revenues & Volume Share, By End-user Industry, 2021 & 2031F |
4 Poland Urea Market Dynamics |
4.1 Impact Analysis |
4.2 Market Drivers |
4.2.1 Growth in agricultural sector in Poland leading to increased demand for urea as a key fertilizer |
4.2.2 Technological advancements in urea production processes driving efficiency and cost-effectiveness |
4.2.3 Government initiatives promoting sustainable agricultural practices and fertilizer use |
4.3 Market Restraints |
4.3.1 Fluctuating prices of natural gas, a key raw material for urea production, impacting production costs |
4.3.2 Environmental concerns regarding nitrogen runoff from urea application affecting regulatory landscape |
4.3.3 Competition from alternative fertilizers impacting market share |
5 Poland Urea Market Trends |
6 Poland Urea Market, By Types |
6.1 Poland Urea Market, By Grade |
6.1.1 Overview and Analysis |
6.1.2 Poland Urea Market Revenues & Volume, By Grade, 2021-2031F |
6.1.3 Poland Urea Market Revenues & Volume, By Fertilizer, 2021-2031F |
6.1.4 Poland Urea Market Revenues & Volume, By Feed, 2021-2031F |
6.1.5 Poland Urea Market Revenues & Volume, By Technical, 2021-2031F |
6.2 Poland Urea Market, By End-user Industry |
6.2.1 Overview and Analysis |
6.2.2 Poland Urea Market Revenues & Volume, By Agriculture, 2021-2031F |
6.2.3 Poland Urea Market Revenues & Volume, By Chemical, 2021-2031F |
6.2.4 Poland Urea Market Revenues & Volume, By Automotive, 2021-2031F |
6.2.5 Poland Urea Market Revenues & Volume, By Medical, 2021-2031F |
6.2.6 Poland Urea Market Revenues & Volume, By Others, 2021-2031F |
7 Poland Urea Market Import-Export Trade Statistics |
7.1 Poland Urea Market Export to Major Countries |
7.2 Poland Urea Market Imports from Major Countries |
8 Poland Urea Market Key Performance Indicators |
8.1 Average selling price of urea in Poland |
8.2 Adoption rate of urea in sustainable agricultural practices |
8.3 Investments in RD for urea production efficiency and environmental sustainability |
9 Poland Urea Market - Opportunity Assessment |
9.1 Poland Urea Market Opportunity Assessment, By Grade, 2021 & 2031F |
9.2 Poland Urea Market Opportunity Assessment, By End-user Industry, 2021 & 2031F |
10 Poland Urea Market - Competitive Landscape |
10.1 Poland Urea Market Revenue Share, By Companies, 2024 |
10.2 Poland Urea Market Competitive Benchmarking, By Operating and Technical Parameters |
11 Company Profiles |
12 Recommendations |
13 Disclaimer |
Global Go To Market Strategy - 2030
Export potential enables firms to identify high-growth global markets with greater confidence by combining advanced trade intelligence with a structured quantitative methodology. The framework analyzes emerging demand trends and country-level import patterns while integrating macroeconomic and trade datasets such as GDP and population forecasts, bilateral import–export flows, tariff structures, elasticity differentials between developed and developing economies, geographic distance, and import demand projections. Using weighted trade values from 2020–2024 as the base period to project country-to-country export potential for 2030, these inputs are operationalized through calculated drivers such as gravity model parameters, tariff impact factors, and projected GDP per-capita growth. Through an analysis of hidden potentials, demand hotspots, and market conditions that are most favorable to success, this method enables firms to focus on target countries, maximize returns, and global expansion with data, backed by accuracy.
By factoring in the projected importer demand gap that is currently unmet and could be potential opportunity, it identifies the potential for the Exporter (Country) among 190 countries, against the general trade analysis, which identifies the biggest importer or exporter.
To discover high-growth global markets and optimize your business strategy:
Click Here
Pricing
- Single User License$ 1,995
- Department License$ 2,400
- Site License$ 3,120
- Global License$ 3,795

Leadership Perspectives from Industry Events
Search
Thought Leadership and Analyst Meet


Our Clients
6WResearch In News
- India Export Attractiveness Tracker 2026
- India Air Conditioner Market Set for Strong Rebound in 2026 After Weather-Led Correction and GST-Driven Recovery: 6Wresearch
- ADAS in India: How Automatic Emergency Braking, Blind Spot Detection & Driver Monitoring are Transforming Road Safety
- Doha a strategic location for EV manufacturing hub: IPA Qatar
- Demand for luxury TVs surging in the GCC, says Samsung
- Empowering Growth: The Thriving Journey of Bangladesh’s Cable Industry
Latest Reports
- Nicaragua RPG Gaming Market (2026-2032)
- New Zealand RPG Gaming Market (2026-2032)
- Netherlands RPG Gaming Market (2026-2032)
- Nauru RPG Gaming Market (2026-2032)
- Namibia RPG Gaming Market (2026-2032)
- Mozambique RPG Gaming Market (2026-2032)
- Montenegro RPG Gaming Market (2026-2032)
- Mongolia RPG Gaming Market (2026-2032)
- Monaco RPG Gaming Market (2026-2032)
- Micronesia RPG Gaming Market (2026-2032)
Industry Events and Analyst Meet

EV India Expo 2026

HIMTEX 2026

India Refining Summit 2026

India EV Show 2026

EV tech India Expo 2026
Whitepaper
- Middle East & Africa Commercial Security Market Click here to view more.
- Middle East & Africa Fire Safety Systems & Equipment Market Click here to view more.
- GCC Drone Market Click here to view more.
- Middle East Lighting Fixture Market Click here to view more.
- GCC Physical & Perimeter Security Market Click here to view more.