Poland Water Filters Market (2026-2032) Outlook | Trends, Size, Revenue, Share, Value, Growth, Forecast, Industry, Analysis & Companies
Market Forecast By Media Type (Single & Dual Phase, Multimedia, Cartridge), By End Use Industry (Municipal, Industrial Oil & Gas, Chemicals & Petrochemicals, Food & Beverages, Pharmaceuticals) And Competitive Landscape
| Product Code: ETC4518916 | Publication Date: Jul 2023 | Updated Date: Mar 2026 | Product Type: Report | |
| Publisher: 6Wresearch | Author: Dhaval Chaurasia | No. of Pages: 85 | No. of Figures: 45 | No. of Tables: 25 |
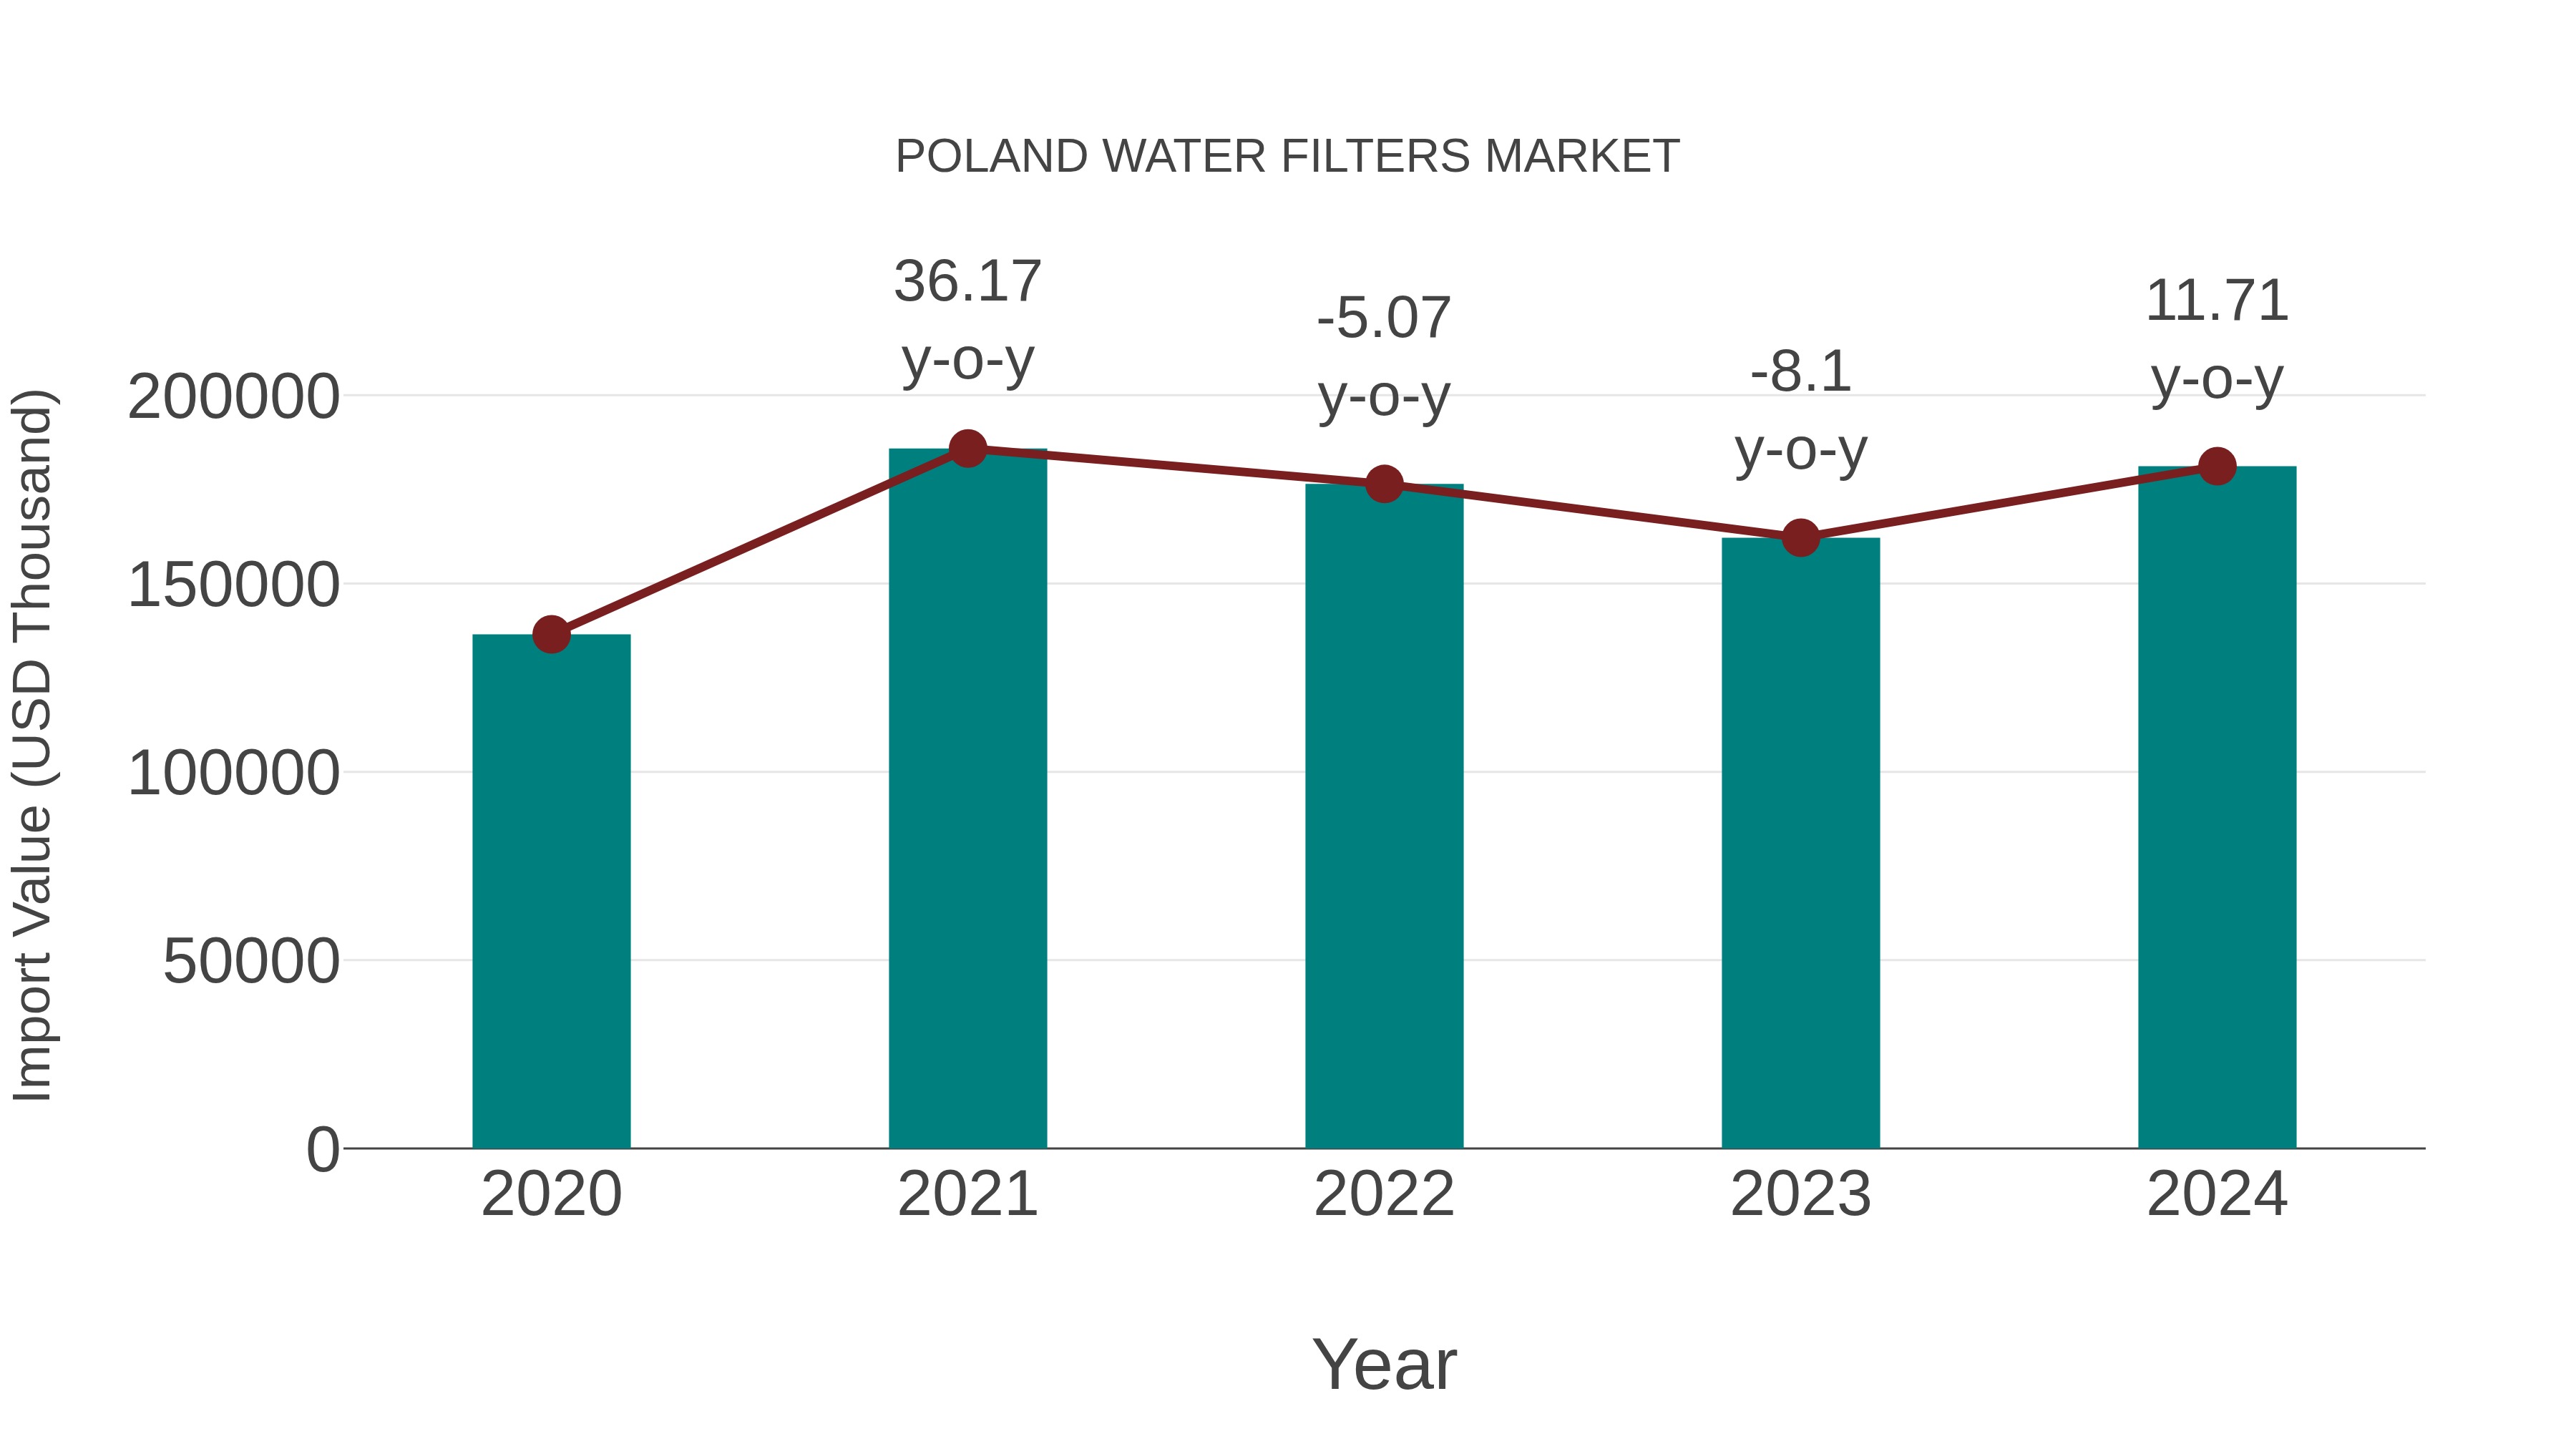
Poland Water Filters Market: Import Trend Analysis
In 2024, Poland water filters market saw a notable increase in imports. The trend indicated a growing reliance on imported water filtration products to meet domestic demand. This shift suggested a preference for foreign technology and quality in the market.
Poland Water Filters Market Overview
The water filters market in Poland is driven by growing consumer awareness of water quality and the need for effective filtration solutions. The market includes various types of filters, such as carbon filters, reverse osmosis systems, and UV filters. Growth is supported by increasing concerns about water contamination and rising disposable incomes. Challenges include competition from alternative water purification technologies and the need for continuous innovation to meet consumer demands.
Drivers of the market
The water filters market in Poland benefits from the increasing awareness of water quality and health concerns. Consumers are more inclined to invest in water filtration systems to ensure clean and safe drinking water. The rise in urbanization and industrial activities drives the demand for effective water filtration solutions. Technological advancements in filtration technologies and the growing availability of a variety of water filter options contribute to market growth.
Challenges of the market
The Poland water filters market encounters challenges such as the need for continuous innovation and competition from alternative water purification technologies. As consumers demand higher quality and more effective water filtration solutions, companies must invest in research and development to stay competitive. Additionally, the proliferation of various water filter technologies can create market saturation and price competition.
Government Policy of the market
Polands regulations for the water filters market emphasize product quality, safety, and environmental impact. The government sets standards for filtration technologies to ensure that they effectively remove contaminants and meet health regulations. Additionally, there are incentives for developing and adopting innovative filter technologies that enhance water purification and support sustainable practices.
Key Highlights of the Report:
- Poland Water Filters Market Outlook
- Market Size of Poland Water Filters Market, 2025
- Forecast of Poland Water Filters Market, 2032
- Historical Data and Forecast of Poland Water Filters Revenues & Volume for the Period 2022-2032F
- Poland Water Filters Market Trend Evolution
- Poland Water Filters Market Drivers and Challenges
- Poland Water Filters Price Trends
- Poland Water Filters Porter's Five Forces
- Poland Water Filters Industry Life Cycle
- Historical Data and Forecast of Poland Water Filters Market Revenues & Volume By Media Type for the Period 2022-2032F
- Historical Data and Forecast of Poland Water Filters Market Revenues & Volume By Single & Dual Phase for the Period 2022-2032F
- Historical Data and Forecast of Poland Water Filters Market Revenues & Volume By Multimedia for the Period 2022-2032F
- Historical Data and Forecast of Poland Water Filters Market Revenues & Volume By Cartridge for the Period 2022-2032F
- Historical Data and Forecast of Poland Water Filters Market Revenues & Volume By End Use Industry for the Period 2022-2032F
- Historical Data and Forecast of Poland Water Filters Market Revenues & Volume By Municipal for the Period 2022-2032F
- Historical Data and Forecast of Poland Water Filters Market Revenues & Volume By Industrial Oil & Gas for the Period 2022-2032F
- Historical Data and Forecast of Poland Water Filters Market Revenues & Volume By Chemicals & Petrochemicals for the Period 2022-2032F
- Historical Data and Forecast of Poland Water Filters Market Revenues & Volume By Food & Beverages for the Period 2022-2032F
- Historical Data and Forecast of Poland Water Filters Market Revenues & Volume By Pharmaceuticals for the Period 2022-2032F
- Poland Water Filters Import Export Trade Statistics
- Market Opportunity Assessment By Media Type
- Market Opportunity Assessment By End Use Industry
- Poland Water Filters Top Companies Market Share
- Poland Water Filters Competitive Benchmarking By Technical and Operational Parameters
- Poland Water Filters Company Profiles
- Poland Water Filters Key Strategic Recommendations
Poland Water Filters Market (2026-2032): FAQs
6Wresearch actively monitors the Poland Water Filters Market and publishes its comprehensive annual report, highlighting emerging trends, growth drivers, revenue analysis, and forecast outlook. Our insights help businesses to make data-backed strategic decisions with ongoing market dynamics. Our analysts track relevent industries related to the Poland Water Filters Market, allowing our clients with actionable intelligence and reliable forecasts tailored to emerging regional needs.
Yes, we provide customisation as per your requirements. To learn more, feel free to contact us on sales@6wresearch.com
1 Executive Summary |
2 Introduction |
2.1 Key Highlights of the Report |
2.2 Report Description |
2.3 Market Scope & Segmentation |
2.4 Research Methodology |
2.5 Assumptions |
3 Poland Water Filters Market Overview |
3.1 Poland Country Macro Economic Indicators |
3.2 Poland Water Filters Market Revenues & Volume, 2022 & 2032F |
3.3 Poland Water Filters Market - Industry Life Cycle |
3.4 Poland Water Filters Market - Porter's Five Forces |
3.5 Poland Water Filters Market Revenues & Volume Share, By Media Type, 2022 & 2032F |
3.6 Poland Water Filters Market Revenues & Volume Share, By End Use Industry, 2022 & 2032F |
4 Poland Water Filters Market Dynamics |
4.1 Impact Analysis |
4.2 Market Drivers |
4.2.1 Increasing awareness about water pollution and health concerns driving demand for water filters |
4.2.2 Growing emphasis on sustainable living and eco-friendly products in Poland |
4.2.3 Rise in disposable income leading to higher spending on health and wellness products |
4.3 Market Restraints |
4.3.1 High initial cost of water filters may deter price-sensitive consumers |
4.3.2 Lack of proper infrastructure for water treatment in some regions impacting market penetration |
4.3.3 Competition from bottled water industry as an alternative to water filters |
5 Poland Water Filters Market Trends |
6 Poland Water Filters Market, By Types |
6.1 Poland Water Filters Market, By Media Type |
6.1.1 Overview and Analysis |
6.1.2 Poland Water Filters Market Revenues & Volume, By Media Type, 2022-2032F |
6.1.3 Poland Water Filters Market Revenues & Volume, By Single & Dual Phase, 2022-2032F |
6.1.4 Poland Water Filters Market Revenues & Volume, By Multimedia, 2022-2032F |
6.1.5 Poland Water Filters Market Revenues & Volume, By Cartridge, 2022-2032F |
6.2 Poland Water Filters Market, By End Use Industry |
6.2.1 Overview and Analysis |
6.2.2 Poland Water Filters Market Revenues & Volume, By Municipal, 2022-2032F |
6.2.3 Poland Water Filters Market Revenues & Volume, By Industrial Oil & Gas, 2022-2032F |
6.2.4 Poland Water Filters Market Revenues & Volume, By Chemicals & Petrochemicals, 2022-2032F |
6.2.5 Poland Water Filters Market Revenues & Volume, By Food & Beverages, 2022-2032F |
6.2.6 Poland Water Filters Market Revenues & Volume, By Pharmaceuticals, 2022-2032F |
7 Poland Water Filters Market Import-Export Trade Statistics |
7.1 Poland Water Filters Market Export to Major Countries |
7.2 Poland Water Filters Market Imports from Major Countries |
8 Poland Water Filters Market Key Performance Indicators |
8.1 Average household expenditure on water filters |
8.2 Number of new product launches in the water filters segment |
8.3 Percentage of households using water filters for drinking water |
8.4 Growth in the number of water filter installations in residential and commercial buildings |
8.5 Consumer awareness levels about water quality and filtration technologies |
9 Poland Water Filters Market - Opportunity Assessment |
9.1 Poland Water Filters Market Opportunity Assessment, By Media Type, 2022 & 2032F |
9.2 Poland Water Filters Market Opportunity Assessment, By End Use Industry, 2022 & 2032F |
10 Poland Water Filters Market - Competitive Landscape |
10.1 Poland Water Filters Market Revenue Share, By Companies, 2025 |
10.2 Poland Water Filters Market Competitive Benchmarking, By Operating and Technical Parameters |
11 Company Profiles |
12 Recommendations |
13 Disclaimer |
Global Go To Market Strategy - 2030
Export potential enables firms to identify high-growth global markets with greater confidence by combining advanced trade intelligence with a structured quantitative methodology. The framework analyzes emerging demand trends and country-level import patterns while integrating macroeconomic and trade datasets such as GDP and population forecasts, bilateral import–export flows, tariff structures, elasticity differentials between developed and developing economies, geographic distance, and import demand projections. Using weighted trade values from 2020–2024 as the base period to project country-to-country export potential for 2030, these inputs are operationalized through calculated drivers such as gravity model parameters, tariff impact factors, and projected GDP per-capita growth. Through an analysis of hidden potentials, demand hotspots, and market conditions that are most favorable to success, this method enables firms to focus on target countries, maximize returns, and global expansion with data, backed by accuracy.
By factoring in the projected importer demand gap that is currently unmet and could be potential opportunity, it identifies the potential for the Exporter (Country) among 190 countries, against the general trade analysis, which identifies the biggest importer or exporter.
To discover high-growth global markets and optimize your business strategy:
Click Here
Pricing
- Single User License$ 1,995
- Department License$ 2,400
- Site License$ 3,120
- Global License$ 3,795

Leadership Perspectives from Industry Events
Search
Thought Leadership and Analyst Meet


Our Clients
6WResearch In News
- India Export Attractiveness Tracker 2026
- India Air Conditioner Market Set for Strong Rebound in 2026 After Weather-Led Correction and GST-Driven Recovery: 6Wresearch
- ADAS in India: How Automatic Emergency Braking, Blind Spot Detection & Driver Monitoring are Transforming Road Safety
- Doha a strategic location for EV manufacturing hub: IPA Qatar
- Demand for luxury TVs surging in the GCC, says Samsung
- Empowering Growth: The Thriving Journey of Bangladesh’s Cable Industry
Latest Reports
- Nicaragua RPG Gaming Market (2026-2032)
- New Zealand RPG Gaming Market (2026-2032)
- Netherlands RPG Gaming Market (2026-2032)
- Nauru RPG Gaming Market (2026-2032)
- Namibia RPG Gaming Market (2026-2032)
- Mozambique RPG Gaming Market (2026-2032)
- Montenegro RPG Gaming Market (2026-2032)
- Mongolia RPG Gaming Market (2026-2032)
- Monaco RPG Gaming Market (2026-2032)
- Micronesia RPG Gaming Market (2026-2032)
Industry Events and Analyst Meet

EV India Expo 2026

HIMTEX 2026

India Refining Summit 2026

India EV Show 2026

EV tech India Expo 2026
Whitepaper
- Middle East & Africa Commercial Security Market Click here to view more.
- Middle East & Africa Fire Safety Systems & Equipment Market Click here to view more.
- GCC Drone Market Click here to view more.
- Middle East Lighting Fixture Market Click here to view more.
- GCC Physical & Perimeter Security Market Click here to view more.