Portugal Drinking Chocolate Market (2026-2032) | Trends, Growth, Value, Competitive Landscape, Companies, Segmentation, Size & Revenue, Share, Outlook, Industry, Analysis, Forecast
Market Forecast By Type (Dark chocolate, Milk chocolate, White), By Cocoa content (60-90%, 40-60%, 30-40%, Others), By Distribution channel (Hypermarkets/supermarkets, Specialty store, Convenience stores, Online store, Other), By Application (Chocolate Drinks, Protein Shakes, Energy Drinks, Coffee Mixes, Others), By Flavour (Vanilla, Caramel, Honey, Hazelnut), By Form (Powder, Liquid), By Target customers (Adults, Kids), By End users (Food Service Providers, Household/Domestic, Corporates, Airlines) And Competitive Landscape
| Product Code: ETC8883070 | Publication Date: Sep 2024 | Updated Date: Apr 2026 | Product Type: Market Research Report | |
| Publisher: 6Wresearch | Author: Vasudha | No. of Pages: 75 | No. of Figures: 35 | No. of Tables: 20 |
Portugal Drinking Chocolate Market Size (2020-2030)
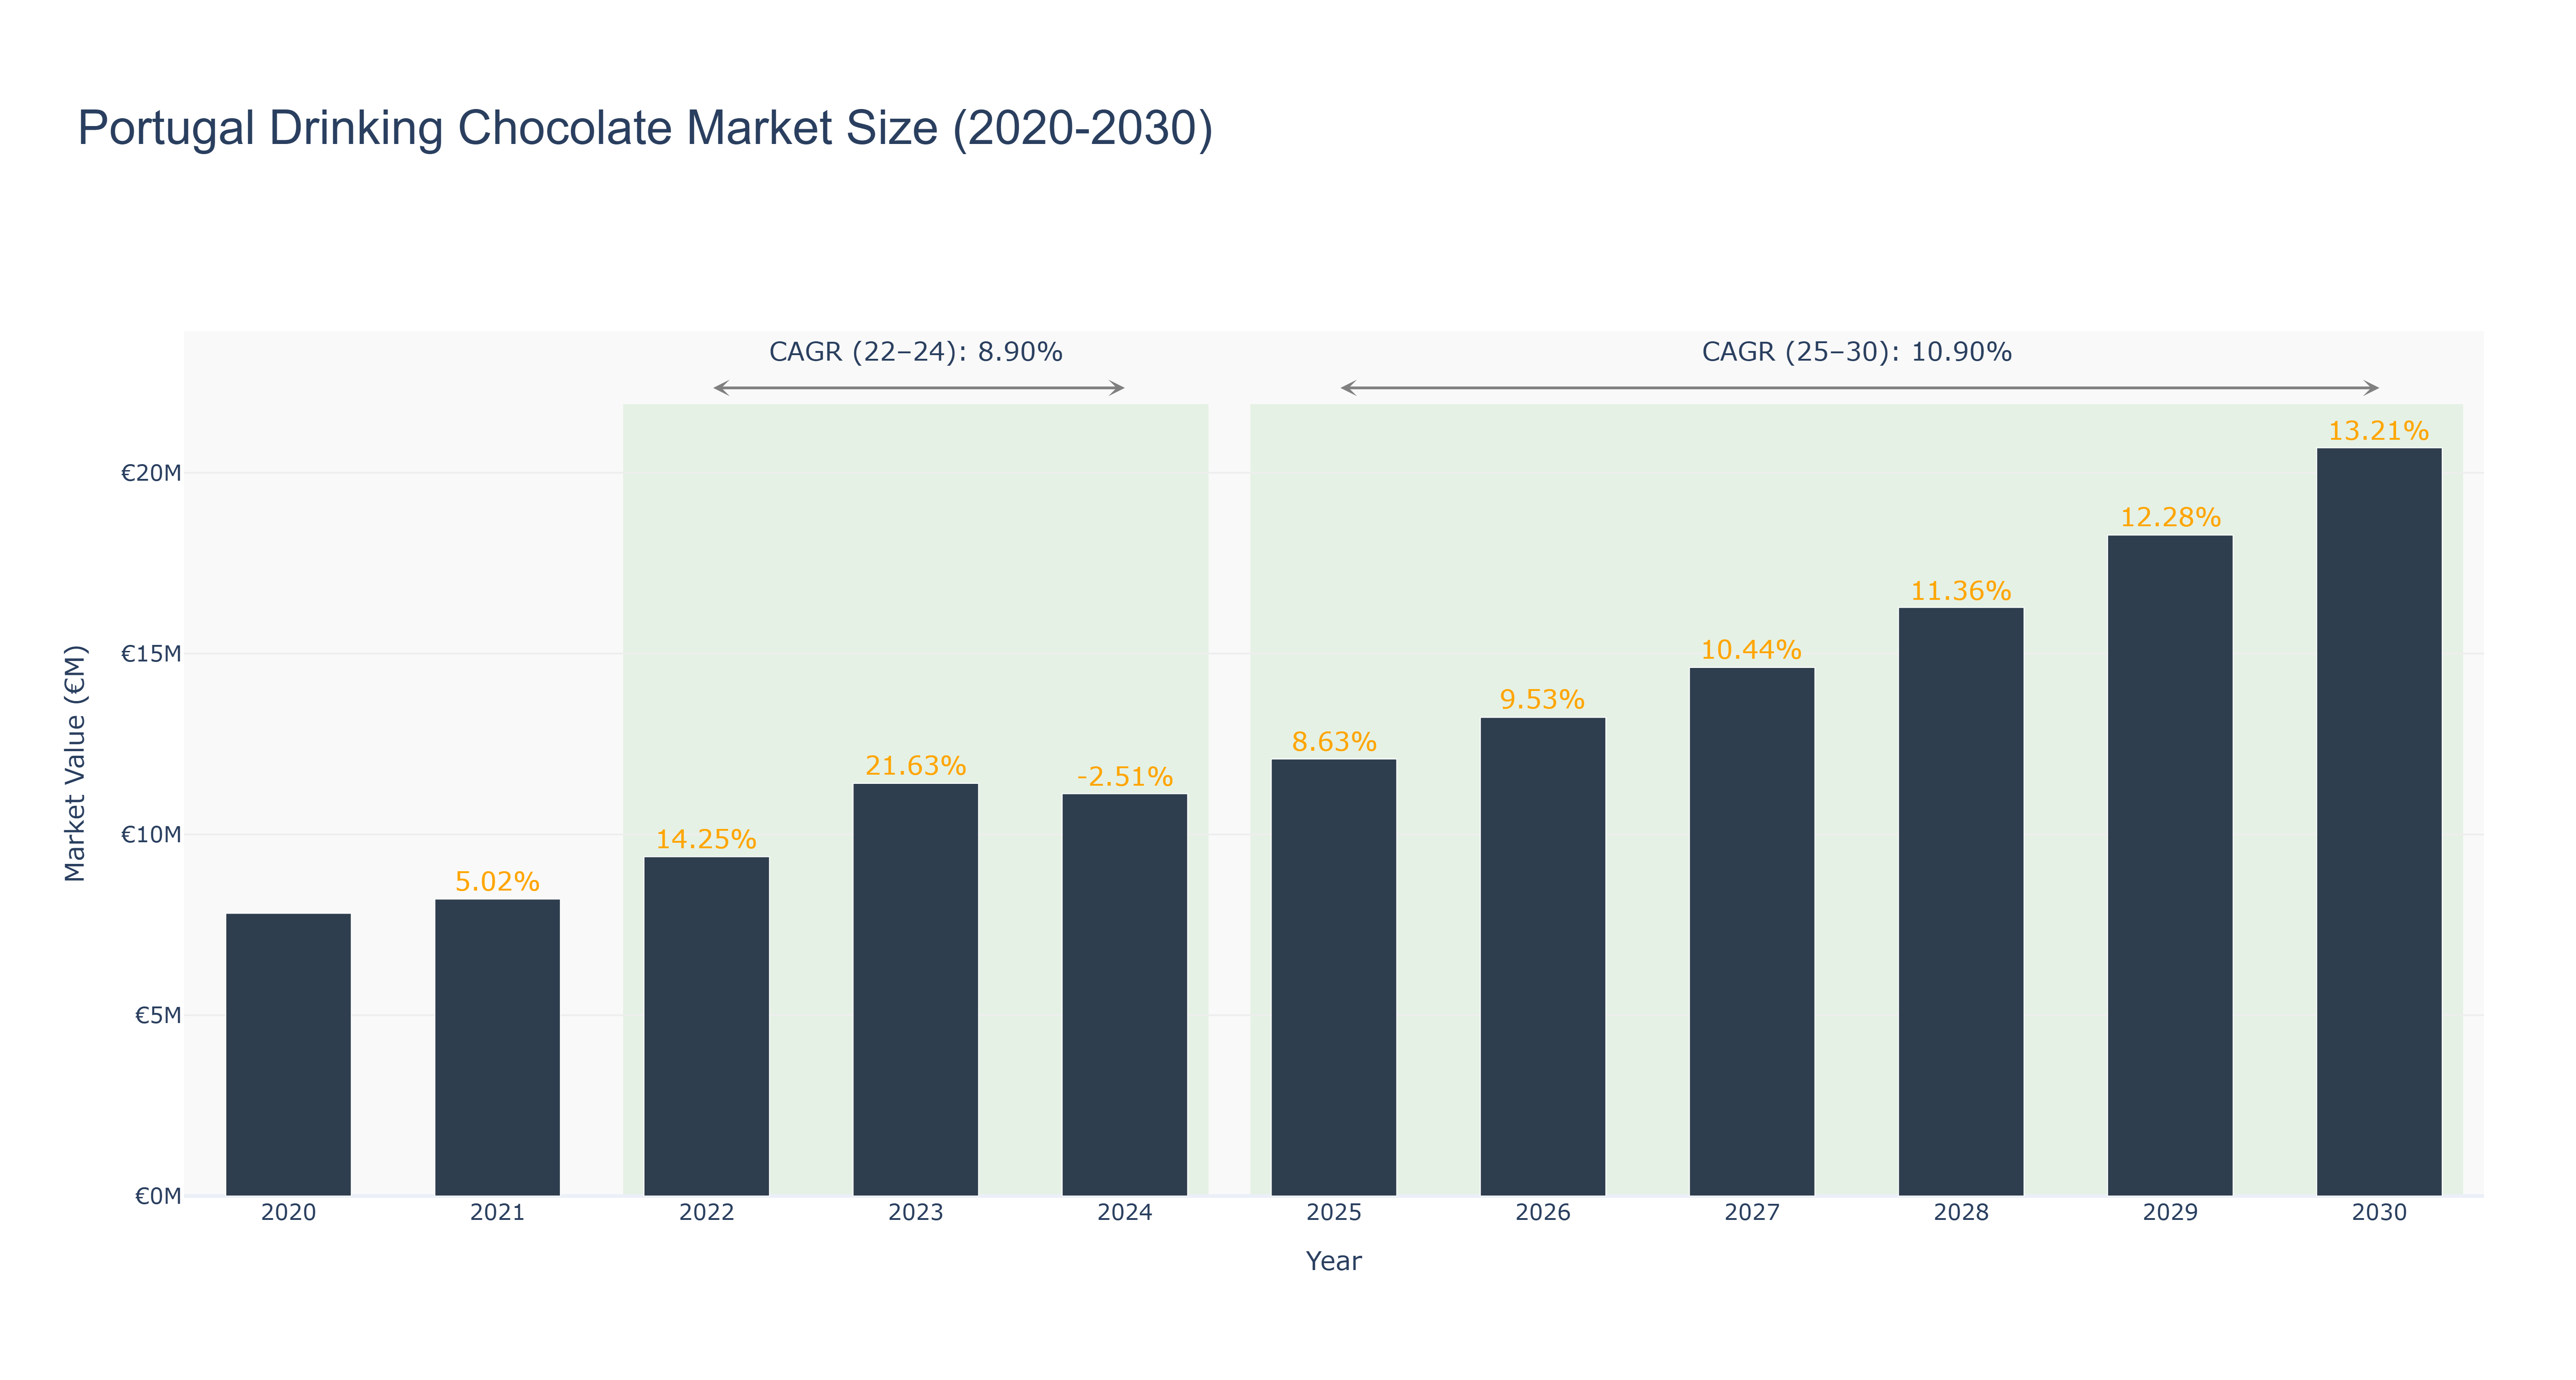
Portugal Drinking Chocolate Market has shown a steady growth trajectory over the years. The peak market size of €20.69 million is forecasted for 2030, with a strong CAGR of 10.90% from 2025 to 2030. The market experienced a slight dip in 2024 due to a temporary decline in consumer demand, but quickly recovered and continued its upward trend. The CAGR of 8.90% from 2022 to 2024 indicates a stable growth pattern despite the temporary setback. Industry drivers such as increasing consumer awareness of premium chocolate products and a growing trend towards indulgent beverages have contributed to the market's growth. Looking ahead, Portugal is set to introduce sustainable packaging initiatives in the drinking chocolate market, aligning with global sustainability trends and catering to eco-conscious consumers.
Portugal Drinking Chocolate Market: Production & Trade Performance (2019-2025)
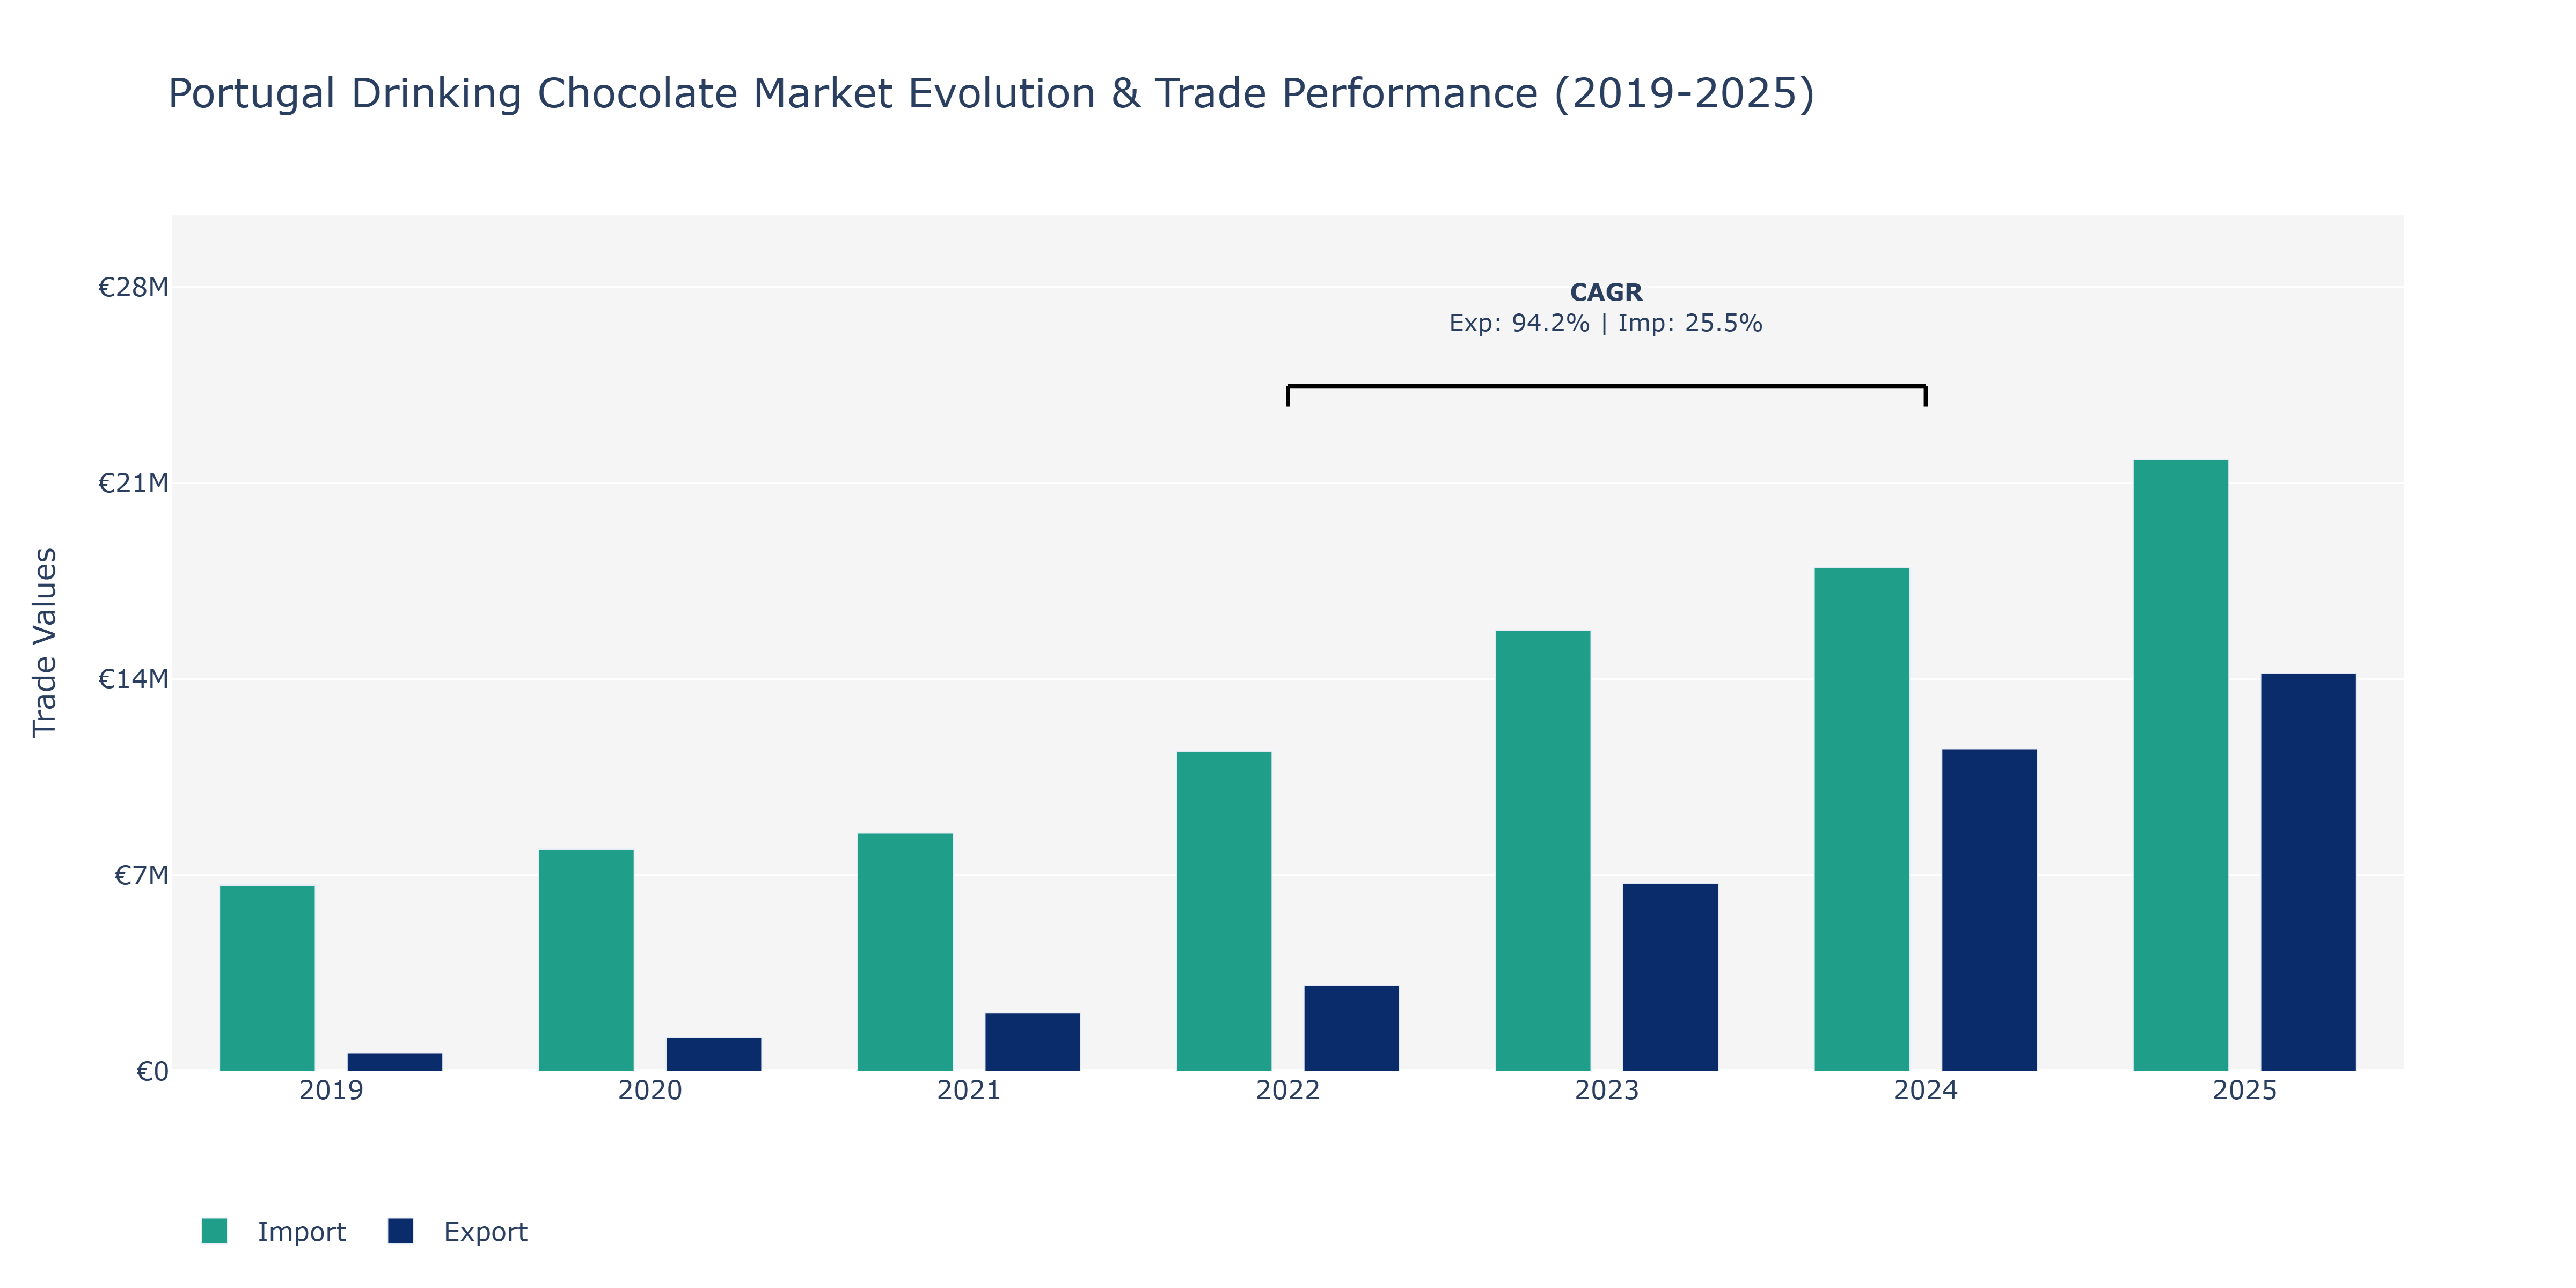
Between 2019 and 2025, Portugal's Drinking Chocolate Market saw remarkable growth in both exports and imports. Exports surged from €642.58 thousand in 2019 to €14.2 million in 2025, showing consistent year-on-year increases. On the other hand, imports also experienced substantial growth, rising from €6.65 million in 2019 to €21.85 million in 2025. Notably, there was a notable acceleration in both exports and imports starting in 2022. This growth can be attributed to a variety of factors such as increasing global demand for premium chocolate products, strategic marketing initiatives by key players in the market, and the rise of e-commerce platforms facilitating international trade. The surge in imports could indicate the growing popularity of foreign drinking chocolate brands in Portugal, while the significant increase in exports highlights the country's competitive advantage in producing high-quality drinking chocolate for the global market.
Key Highlights of the Report:
- Portugal Drinking Chocolate Market Outlook
- Market Size of Portugal Drinking Chocolate Market, 2025
- Forecast of Portugal Drinking Chocolate Market, 2032
- Historical Data and Forecast of Portugal Drinking Chocolate Revenues & Volume for the Period 2022 - 2032
- Portugal Drinking Chocolate Market Trend Evolution
- Portugal Drinking Chocolate Market Drivers and Challenges
- Portugal Drinking Chocolate Price Trends
- Portugal Drinking Chocolate Porter's Five Forces
- Portugal Drinking Chocolate Industry Life Cycle
- Historical Data and Forecast of Portugal Drinking Chocolate Market Revenues & Volume By Type for the Period 2022 - 2032
- Historical Data and Forecast of Portugal Drinking Chocolate Market Revenues & Volume By Dark chocolate for the Period 2022 - 2032
- Historical Data and Forecast of Portugal Drinking Chocolate Market Revenues & Volume By Milk chocolate for the Period 2022 - 2032
- Historical Data and Forecast of Portugal Drinking Chocolate Market Revenues & Volume By White for the Period 2022 - 2032
- Historical Data and Forecast of Portugal Drinking Chocolate Market Revenues & Volume By Cocoa content for the Period 2022 - 2032
- Historical Data and Forecast of Portugal Drinking Chocolate Market Revenues & Volume By 60-90% for the Period 2022 - 2032
- Historical Data and Forecast of Portugal Drinking Chocolate Market Revenues & Volume By 40-60% for the Period 2022 - 2032
- Historical Data and Forecast of Portugal Drinking Chocolate Market Revenues & Volume By 30-40% for the Period 2022 - 2032
- Historical Data and Forecast of Portugal Drinking Chocolate Market Revenues & Volume By Others for the Period 2022 - 2032
- Historical Data and Forecast of Portugal Drinking Chocolate Market Revenues & Volume By Distribution channel for the Period 2022 - 2032
- Historical Data and Forecast of Portugal Drinking Chocolate Market Revenues & Volume By Hypermarkets/supermarkets for the Period 2022 - 2032
- Historical Data and Forecast of Portugal Drinking Chocolate Market Revenues & Volume By Specialty store for the Period 2022 - 2032
- Historical Data and Forecast of Portugal Drinking Chocolate Market Revenues & Volume By Convenience stores for the Period 2022 - 2032
- Historical Data and Forecast of Portugal Drinking Chocolate Market Revenues & Volume By Online store for the Period 2022 - 2032
- Historical Data and Forecast of Portugal Drinking Chocolate Market Revenues & Volume By Other for the Period 2022 - 2032
- Historical Data and Forecast of Portugal Drinking Chocolate Market Revenues & Volume By Application for the Period 2022 - 2032
- Historical Data and Forecast of Portugal Drinking Chocolate Market Revenues & Volume By Chocolate Drinks for the Period 2022 - 2032
- Historical Data and Forecast of Portugal Drinking Chocolate Market Revenues & Volume By Protein Shakes for the Period 2022 - 2032
- Historical Data and Forecast of Portugal Drinking Chocolate Market Revenues & Volume By Energy Drinks for the Period 2022 - 2032
- Historical Data and Forecast of Portugal Drinking Chocolate Market Revenues & Volume By Coffee Mixes for the Period 2022 - 2032
- Historical Data and Forecast of Portugal Drinking Chocolate Market Revenues & Volume By Others for the Period 2022 - 2032
- Historical Data and Forecast of Portugal Drinking Chocolate Market Revenues & Volume By Flavour for the Period 2022 - 2032
- Historical Data and Forecast of Portugal Drinking Chocolate Market Revenues & Volume By Vanilla for the Period 2022 - 2032
- Historical Data and Forecast of Portugal Drinking Chocolate Market Revenues & Volume By Caramel for the Period 2022 - 2032
- Historical Data and Forecast of Portugal Drinking Chocolate Market Revenues & Volume By Honey for the Period 2022 - 2032
- Historical Data and Forecast of Portugal Drinking Chocolate Market Revenues & Volume By Hazelnut for the Period 2022 - 2032
- Historical Data and Forecast of Portugal Drinking Chocolate Market Revenues & Volume By Form for the Period 2022 - 2032
- Historical Data and Forecast of Portugal Drinking Chocolate Market Revenues & Volume By Powder for the Period 2022 - 2032
- Historical Data and Forecast of Portugal Drinking Chocolate Market Revenues & Volume By Liquid for the Period 2022 - 2032
- Historical Data and Forecast of Portugal Drinking Chocolate Market Revenues & Volume By Target customers for the Period 2022 - 2032
- Historical Data and Forecast of Portugal Drinking Chocolate Market Revenues & Volume By Adults for the Period 2022 - 2032
- Historical Data and Forecast of Portugal Drinking Chocolate Market Revenues & Volume By Kids for the Period 2022 - 2032
- Historical Data and Forecast of Portugal Drinking Chocolate Market Revenues & Volume By End users for the Period 2022 - 2032
- Historical Data and Forecast of Portugal Drinking Chocolate Market Revenues & Volume By Food Service Providers for the Period 2022 - 2032
- Historical Data and Forecast of Portugal Drinking Chocolate Market Revenues & Volume By Household/Domestic for the Period 2022 - 2032
- Historical Data and Forecast of Portugal Drinking Chocolate Market Revenues & Volume By Corporates for the Period 2022 - 2032
- Historical Data and Forecast of Portugal Drinking Chocolate Market Revenues & Volume By Airlines for the Period 2022 - 2032
- Portugal Drinking Chocolate Import Export Trade Statistics
- Market Opportunity Assessment By Type
- Market Opportunity Assessment By Cocoa content
- Market Opportunity Assessment By Distribution channel
- Market Opportunity Assessment By Application
- Market Opportunity Assessment By Flavour
- Market Opportunity Assessment By Form
- Market Opportunity Assessment By Target customers
- Market Opportunity Assessment By End users
- Portugal Drinking Chocolate Top Companies Market Share
- Portugal Drinking Chocolate Competitive Benchmarking By Technical and Operational Parameters
- Portugal Drinking Chocolate Company Profiles
- Portugal Drinking Chocolate Key Strategic Recommendations
Frequently Asked Questions About the Market Study (FAQs):
6Wresearch actively monitors the Portugal Drinking Chocolate Market and publishes its comprehensive annual report, highlighting emerging trends, growth drivers, revenue analysis, and forecast outlook. Our insights help businesses to make data-backed strategic decisions with ongoing market dynamics. Our analysts track relevent industries related to the Portugal Drinking Chocolate Market, allowing our clients with actionable intelligence and reliable forecasts tailored to emerging regional needs.
Yes, we provide customisation as per your requirements. To learn more, feel free to contact us on sales@6wresearch.com
1 Executive Summary |
2 Introduction |
2.1 Key Highlights of the Report |
2.2 Report Description |
2.3 Market Scope & Segmentation |
2.4 Research Methodology |
2.5 Assumptions |
3 Portugal Drinking Chocolate Market Overview |
3.1 Portugal Country Macro Economic Indicators |
3.2 Portugal Drinking Chocolate Market Revenues & Volume, 2022 & 2032F |
3.3 Portugal Drinking Chocolate Market - Industry Life Cycle |
3.4 Portugal Drinking Chocolate Market - Porter's Five Forces |
3.5 Portugal Drinking Chocolate Market Revenues & Volume Share, By Type, 2022 & 2032F |
3.6 Portugal Drinking Chocolate Market Revenues & Volume Share, By Cocoa content, 2022 & 2032F |
3.7 Portugal Drinking Chocolate Market Revenues & Volume Share, By Distribution channel, 2022 & 2032F |
3.8 Portugal Drinking Chocolate Market Revenues & Volume Share, By Application, 2022 & 2032F |
3.9 Portugal Drinking Chocolate Market Revenues & Volume Share, By Flavour, 2022 & 2032F |
3.10 Portugal Drinking Chocolate Market Revenues & Volume Share, By Form, 2022 & 2032F |
3.11 Portugal Drinking Chocolate Market Revenues & Volume Share, By Target customers, 2022 & 2032F |
4 Portugal Drinking Chocolate Market Dynamics |
4.1 Impact Analysis |
4.2 Market Drivers |
4.2.1 Increasing consumer demand for premium and gourmet chocolate products |
4.2.2 Growing health consciousness leading to the preference for functional and organic drinking chocolate |
4.2.3 Rising popularity of hot beverages and cafes in Portugal |
4.3 Market Restraints |
4.3.1 Price volatility of raw materials like cocoa beans impacting the cost of production |
4.3.2 Competition from other hot beverage options like coffee and tea |
4.3.3 Seasonal demand fluctuations affecting sales and production |
5 Portugal Drinking Chocolate Market Trends |
6 Portugal Drinking Chocolate Market, By Types |
6.1 Portugal Drinking Chocolate Market, By Type |
6.1.1 Overview and Analysis |
6.1.2 Portugal Drinking Chocolate Market Revenues & Volume, By Type, 2022 - 2032F |
6.1.3 Portugal Drinking Chocolate Market Revenues & Volume, By Dark chocolate, 2022 - 2032F |
6.1.4 Portugal Drinking Chocolate Market Revenues & Volume, By Milk chocolate, 2022 - 2032F |
6.1.5 Portugal Drinking Chocolate Market Revenues & Volume, By White, 2022 - 2032F |
6.2 Portugal Drinking Chocolate Market, By Cocoa content |
6.2.1 Overview and Analysis |
6.2.2 Portugal Drinking Chocolate Market Revenues & Volume, By 60-90%, 2022 - 2032F |
6.2.3 Portugal Drinking Chocolate Market Revenues & Volume, By 40-60%, 2022 - 2032F |
6.2.4 Portugal Drinking Chocolate Market Revenues & Volume, By 30-40%, 2022 - 2032F |
6.2.5 Portugal Drinking Chocolate Market Revenues & Volume, By Others, 2022 - 2032F |
6.3 Portugal Drinking Chocolate Market, By Distribution channel |
6.3.1 Overview and Analysis |
6.3.2 Portugal Drinking Chocolate Market Revenues & Volume, By Hypermarkets/supermarkets, 2022 - 2032F |
6.3.3 Portugal Drinking Chocolate Market Revenues & Volume, By Specialty store, 2022 - 2032F |
6.3.4 Portugal Drinking Chocolate Market Revenues & Volume, By Convenience stores, 2022 - 2032F |
6.3.5 Portugal Drinking Chocolate Market Revenues & Volume, By Online store, 2022 - 2032F |
6.3.6 Portugal Drinking Chocolate Market Revenues & Volume, By Other, 2022 - 2032F |
6.4 Portugal Drinking Chocolate Market, By Application |
6.4.1 Overview and Analysis |
6.4.2 Portugal Drinking Chocolate Market Revenues & Volume, By Chocolate Drinks, 2022 - 2032F |
6.4.3 Portugal Drinking Chocolate Market Revenues & Volume, By Protein Shakes, 2022 - 2032F |
6.4.4 Portugal Drinking Chocolate Market Revenues & Volume, By Energy Drinks, 2022 - 2032F |
6.4.5 Portugal Drinking Chocolate Market Revenues & Volume, By Coffee Mixes, 2022 - 2032F |
6.4.6 Portugal Drinking Chocolate Market Revenues & Volume, By Others, 2022 - 2032F |
6.5 Portugal Drinking Chocolate Market, By Flavour |
6.5.1 Overview and Analysis |
6.5.2 Portugal Drinking Chocolate Market Revenues & Volume, By Vanilla, 2022 - 2032F |
6.5.3 Portugal Drinking Chocolate Market Revenues & Volume, By Caramel, 2022 - 2032F |
6.5.4 Portugal Drinking Chocolate Market Revenues & Volume, By Honey, 2022 - 2032F |
6.5.5 Portugal Drinking Chocolate Market Revenues & Volume, By Hazelnut, 2022 - 2032F |
6.6 Portugal Drinking Chocolate Market, By Form |
6.6.1 Overview and Analysis |
6.6.2 Portugal Drinking Chocolate Market Revenues & Volume, By Powder, 2022 - 2032F |
6.6.3 Portugal Drinking Chocolate Market Revenues & Volume, By Liquid, 2022 - 2032F |
6.7 Portugal Drinking Chocolate Market, By Target customers |
6.7.1 Overview and Analysis |
6.7.2 Portugal Drinking Chocolate Market Revenues & Volume, By Adults, 2022 - 2032F |
6.7.3 Portugal Drinking Chocolate Market Revenues & Volume, By Kids, 2022 - 2032F |
6.8 Portugal Drinking Chocolate Market, By End users |
6.8.1 Overview and Analysis |
6.8.2 Portugal Drinking Chocolate Market Revenues & Volume, By Food Service Providers, 2022 - 2032F |
6.8.3 Portugal Drinking Chocolate Market Revenues & Volume, By Household/Domestic, 2022 - 2032F |
6.8.4 Portugal Drinking Chocolate Market Revenues & Volume, By Airlines, 2022 - 2032F |
6.8.5 Portugal Drinking Chocolate Market Revenues & Volume, By Airlines, 2022 - 2032F |
7 Portugal Drinking Chocolate Market Import-Export Trade Statistics |
7.1 Portugal Drinking Chocolate Market Export to Major Countries |
7.2 Portugal Drinking Chocolate Market Imports from Major Countries |
8 Portugal Drinking Chocolate Market Key Performance Indicators |
8.1 Consumer engagement on social media platforms for drinking chocolate brands |
8.2 Number of new product launches in the drinking chocolate market |
8.3 Percentage of consumers opting for organic or functional drinking chocolate products |
9 Portugal Drinking Chocolate Market - Opportunity Assessment |
9.1 Portugal Drinking Chocolate Market Opportunity Assessment, By Type, 2022 & 2032F |
9.2 Portugal Drinking Chocolate Market Opportunity Assessment, By Cocoa content, 2022 & 2032F |
9.3 Portugal Drinking Chocolate Market Opportunity Assessment, By Distribution channel, 2022 & 2032F |
9.4 Portugal Drinking Chocolate Market Opportunity Assessment, By Application, 2022 & 2032F |
9.5 Portugal Drinking Chocolate Market Opportunity Assessment, By Flavour, 2022 & 2032F |
9.6 Portugal Drinking Chocolate Market Opportunity Assessment, By Form, 2022 & 2032F |
9.7 Portugal Drinking Chocolate Market Opportunity Assessment, By Target customers, 2022 & 2032F |
9.7 Portugal Drinking Chocolate Market Opportunity Assessment, By End users, 2022 & 2032F |
10 Portugal Drinking Chocolate Market - Competitive Landscape |
10.1 Portugal Drinking Chocolate Market Revenue Share, By Companies, 2025 |
10.2 Portugal Drinking Chocolate Market Competitive Benchmarking, By Operating and Technical Parameters |
11 Company Profiles |
12 Recommendations |
13 Disclaimer |
Global Go To Market Strategy - 2030
Export potential enables firms to identify high-growth global markets with greater confidence by combining advanced trade intelligence with a structured quantitative methodology. The framework analyzes emerging demand trends and country-level import patterns while integrating macroeconomic and trade datasets such as GDP and population forecasts, bilateral import–export flows, tariff structures, elasticity differentials between developed and developing economies, geographic distance, and import demand projections. Using weighted trade values from 2020–2024 as the base period to project country-to-country export potential for 2030, these inputs are operationalized through calculated drivers such as gravity model parameters, tariff impact factors, and projected GDP per-capita growth. Through an analysis of hidden potentials, demand hotspots, and market conditions that are most favorable to success, this method enables firms to focus on target countries, maximize returns, and global expansion with data, backed by accuracy.
By factoring in the projected importer demand gap that is currently unmet and could be potential opportunity, it identifies the potential for the Exporter (Country) among 190 countries, against the general trade analysis, which identifies the biggest importer or exporter.
To discover high-growth global markets and optimize your business strategy:
Click Here
Pricing
- Single User License$ 1,995
- Department License$ 2,400
- Site License$ 3,120
- Global License$ 3,795

Leadership Perspectives from Industry Events
Search
Thought Leadership and Analyst Meet


Our Clients
6WResearch In News
- India Export Attractiveness Tracker 2026
- India Air Conditioner Market Set for Strong Rebound in 2026 After Weather-Led Correction and GST-Driven Recovery: 6Wresearch
- ADAS in India: How Automatic Emergency Braking, Blind Spot Detection & Driver Monitoring are Transforming Road Safety
- Doha a strategic location for EV manufacturing hub: IPA Qatar
- Demand for luxury TVs surging in the GCC, says Samsung
- Empowering Growth: The Thriving Journey of Bangladesh’s Cable Industry
Latest Reports
- Qatar Access and Home Network Market (2026-2032)
- Nicaragua RPG Gaming Market (2026-2032)
- New Zealand RPG Gaming Market (2026-2032)
- Netherlands RPG Gaming Market (2026-2032)
- Nauru RPG Gaming Market (2026-2032)
- Namibia RPG Gaming Market (2026-2032)
- Mozambique RPG Gaming Market (2026-2032)
- Montenegro RPG Gaming Market (2026-2032)
- Mongolia RPG Gaming Market (2026-2032)
- Monaco RPG Gaming Market (2026-2032)
Industry Events and Analyst Meet

EV India Expo 2026

HIMTEX 2026

India Refining Summit 2026

India EV Show 2026

EV tech India Expo 2026
Whitepaper
- Middle East & Africa Commercial Security Market Click here to view more.
- Middle East & Africa Fire Safety Systems & Equipment Market Click here to view more.
- GCC Drone Market Click here to view more.
- Middle East Lighting Fixture Market Click here to view more.
- GCC Physical & Perimeter Security Market Click here to view more.