Portugal Driving Metal Chain Market (2026-2032) | Value, Industry, Companies, Revenue, Growth, Segmentation, Outlook, Analysis, Share, Size, Forecast & Trends
Market Forecast By Type (Stainless Steel Chain, Carbon Steel Chain, Alloy Chain, Copper Chain, Others), By Application (Automobile, Agricultural, Construction, Others) And Competitive Landscape
| Product Code: ETC4924545 | Publication Date: Nov 2023 | Updated Date: Apr 2026 | Product Type: Market Research Report | |
| Publisher: 6Wresearch | Author: Shubham Padhi | No. of Pages: 60 | No. of Figures: 30 | No. of Tables: 5 |
Portugal Driving Metal Chain Market Size (2020-2030)
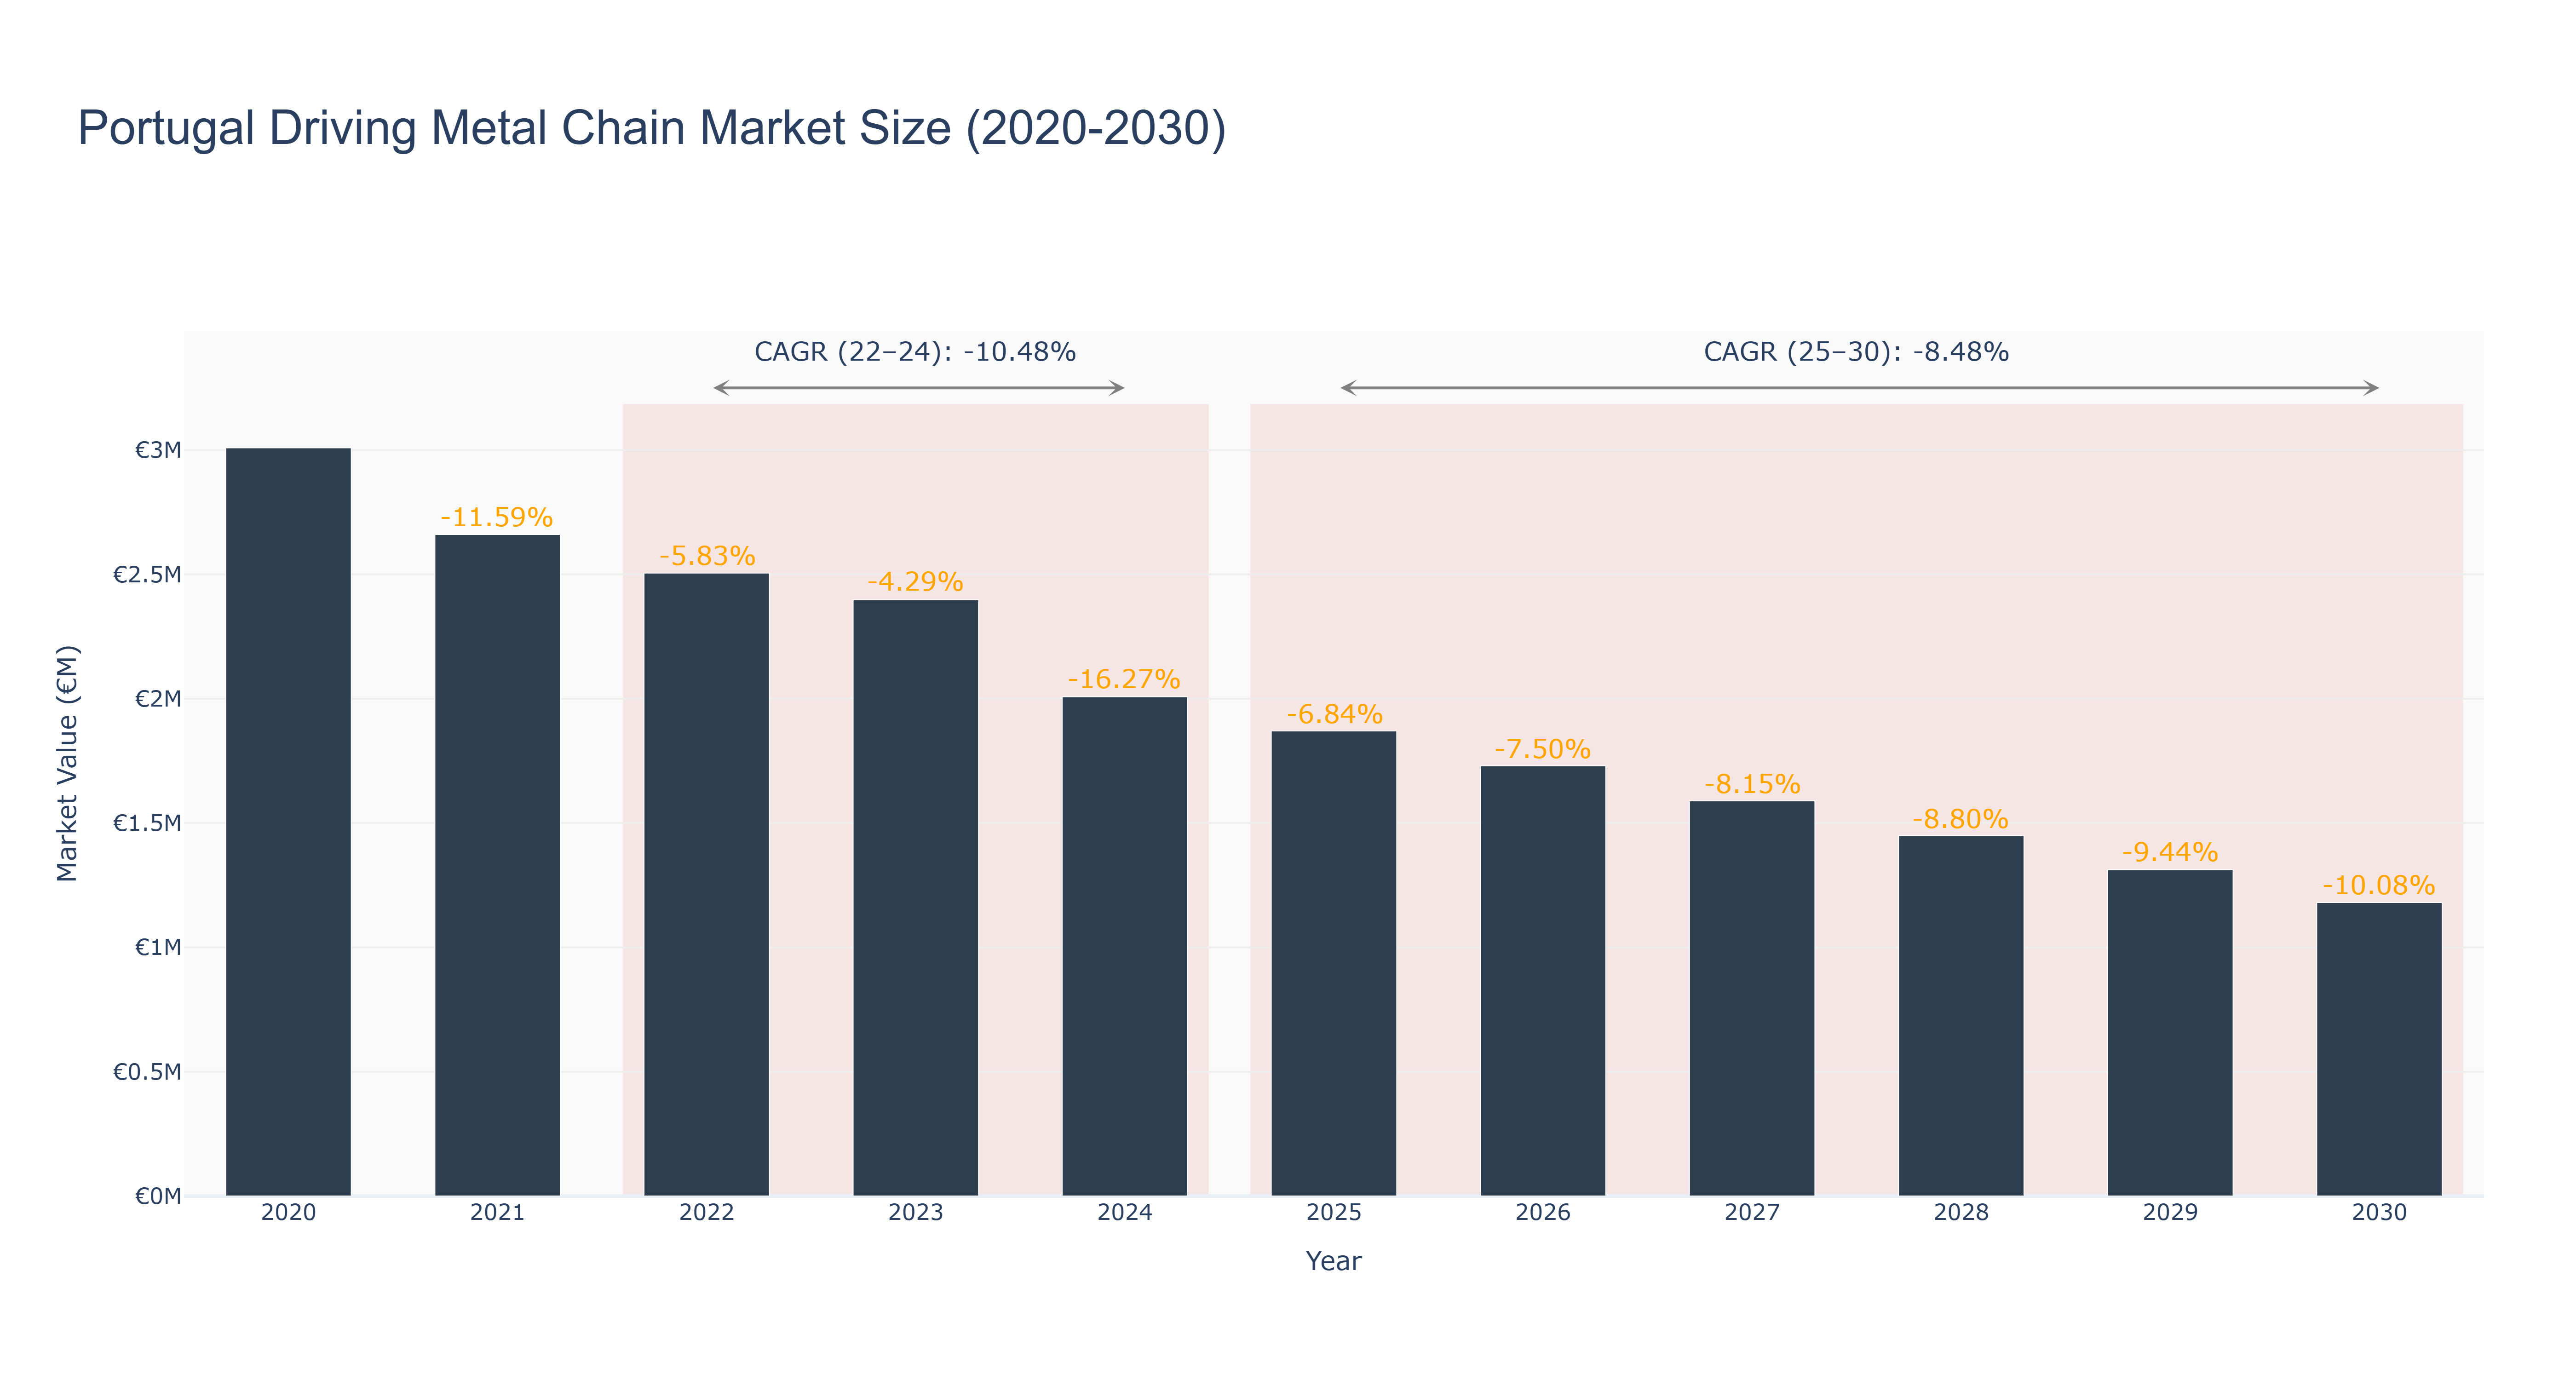
The Portugal Driving Metal Chain Market experienced its peak in 2020 with a market size of €3.01 million; however, it has since faced a notable decline, recording a market size of €2.01 million in 2024, reflecting an actual CAGR of -10.48% from 2022 to 2024. This downward trend can be attributed to various factors, including reduced demand from key industries, increased competition from alternative materials, and economic challenges affecting consumer spending. Looking ahead, the forecasted period from 2025 to 2030 anticipates a continued contraction, with projected market sizes decreasing from €1.87 million in 2025 to €1.18 million by 2030, resulting in a CAGR of -8.48%. The market may be influenced by ongoing technological advancements and shifts toward sustainable practices; however, without significant investment or innovation, recovery remains uncertain.
Portugal Driving Metal Chain Market: Production & Trade Performance (2019-2025)
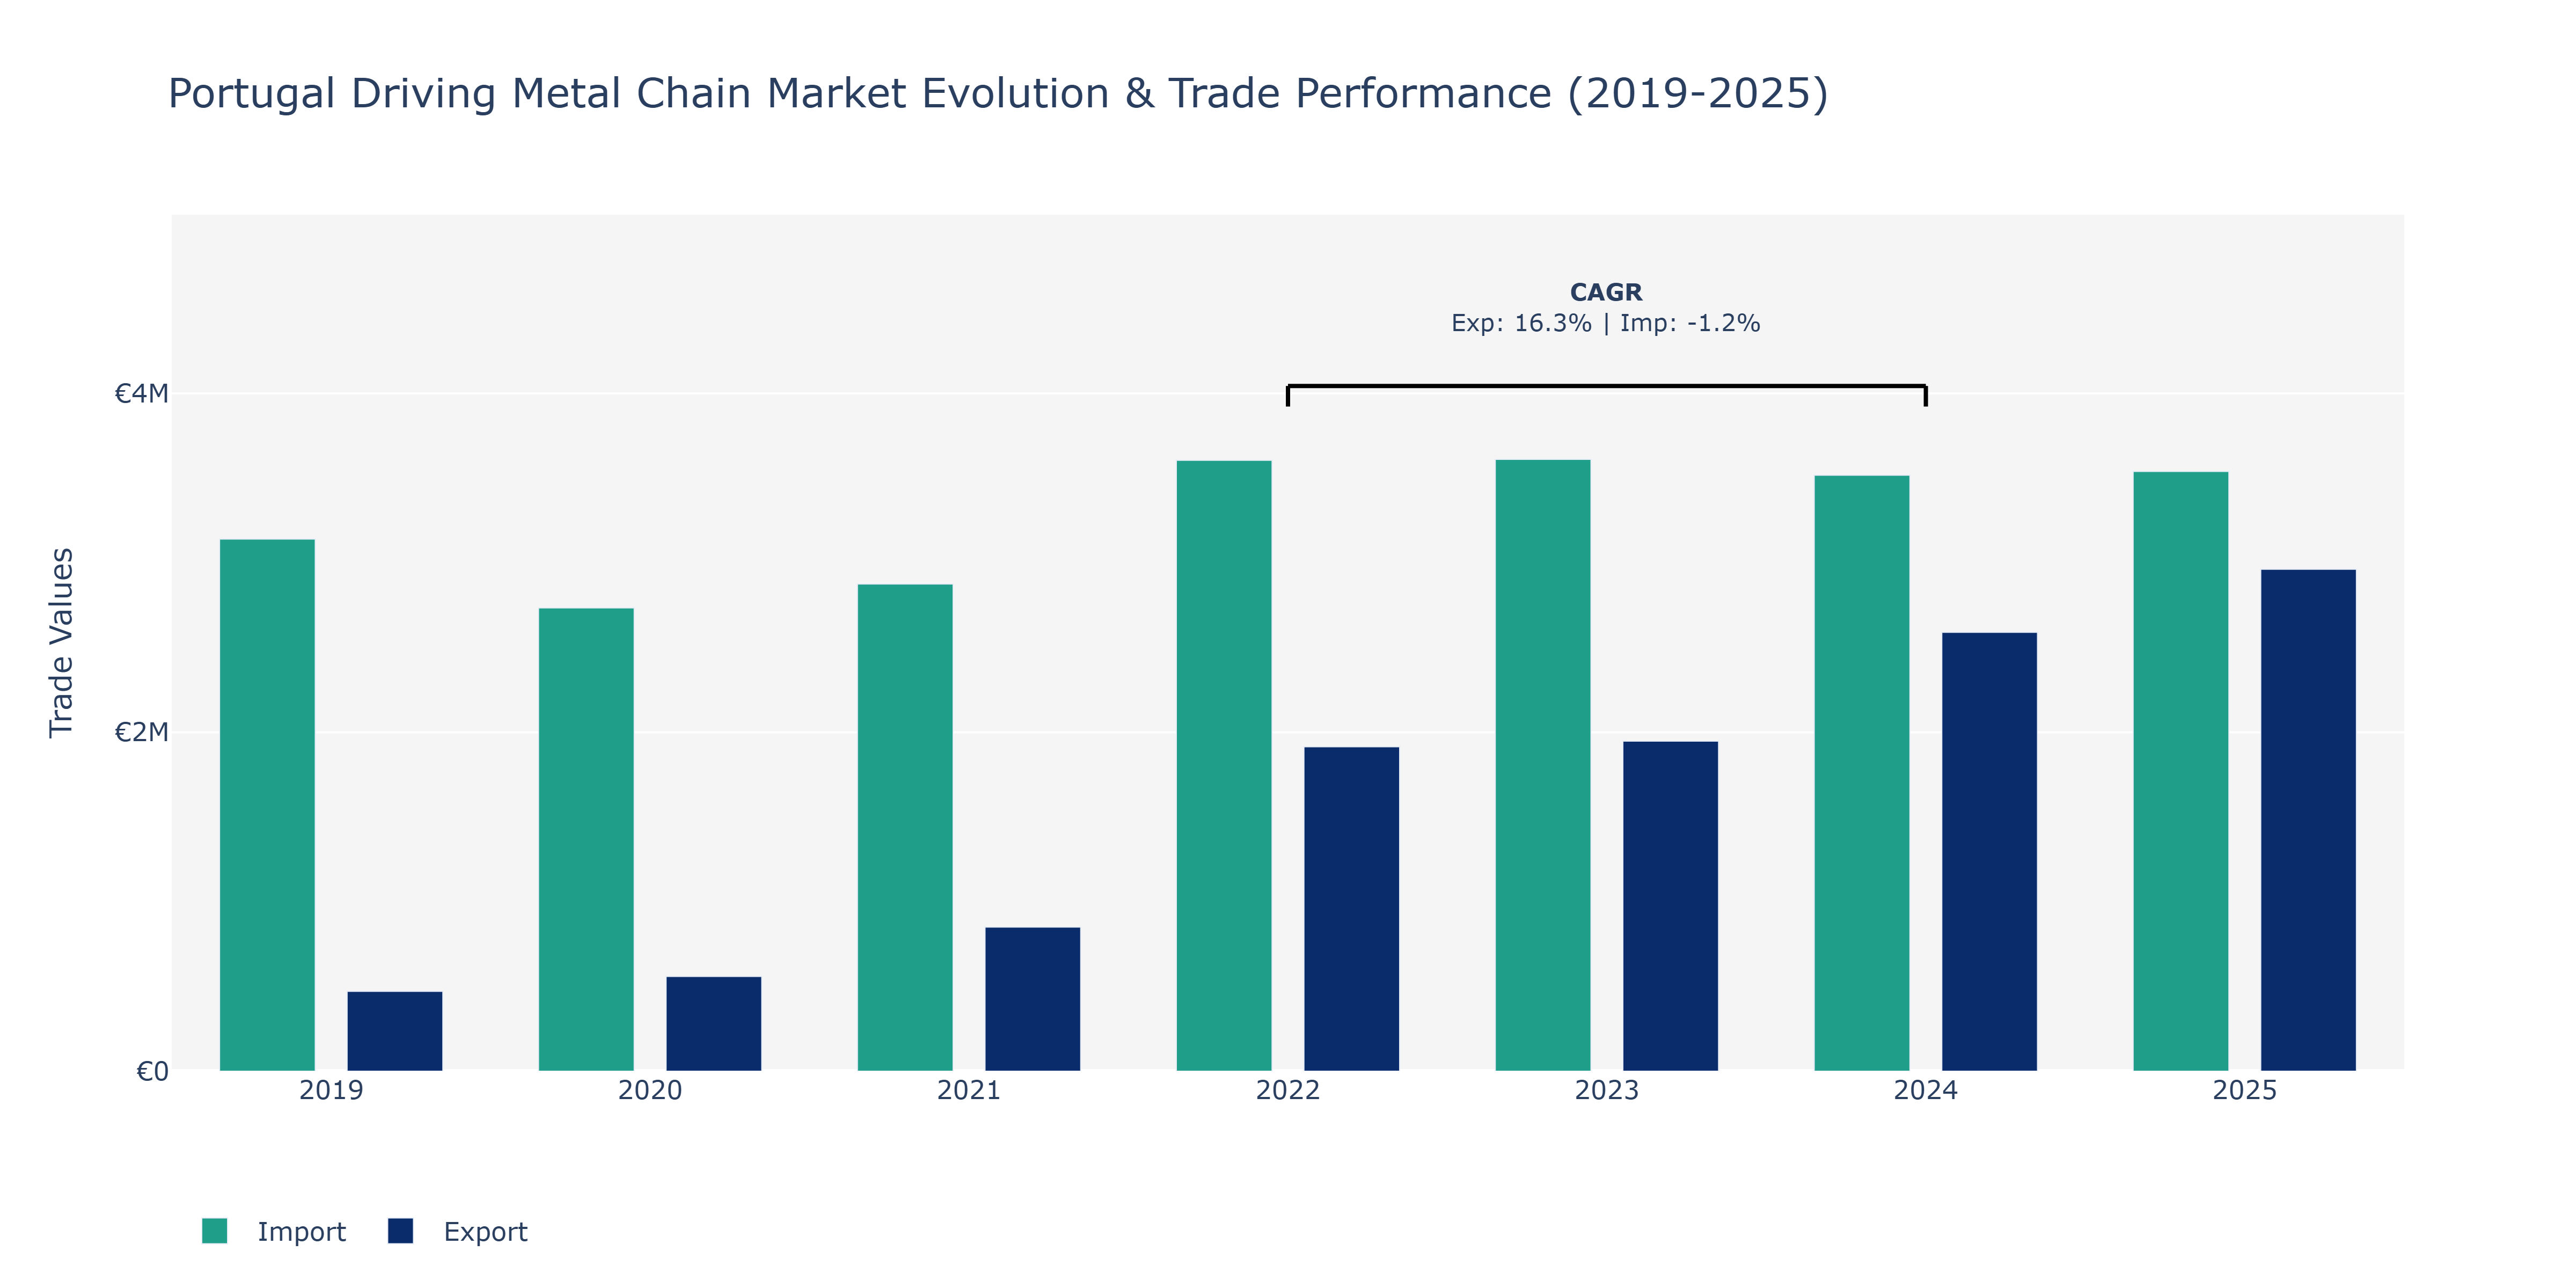
Between 2019 and 2025, the Portugal Driving Metal Chain Market saw a notable rise in exports and imports. Exports surged from €471.26 thousand in 2019 to around €2.96 million in 2025, showing a consistent upward trend. On the other hand, imports fluctuated, with a peak of €3.61 million in 2023 but slightly declining to €3.54 million in 2025. These fluctuations can be attributed to various factors. The increase in exports can be linked to rising demand for Portuguese metal chains globally, potentially due to the country's reputation for quality manufacturing. In contrast, the dip in imports post-2023 could be a result of efforts to promote domestic production or shifts in sourcing strategies to optimize costs. The market's growth aligns with the global trend of increasing demand for metal chains in industries such as automotive, construction, and agriculture, further fueling Portugal's position in the market.
Key Highlights of the Report:
- Portugal Driving Metal Chain Market Outlook
- Market Size of Portugal Driving Metal Chain Market, 2025
- Forecast of Portugal Driving Metal Chain Market, 2032
- Historical Data and Forecast of Portugal Driving Metal Chain Revenues & Volume for the Period 2022 - 2032F
- Portugal Driving Metal Chain Market Trend Evolution
- Portugal Driving Metal Chain Market Drivers and Challenges
- Portugal Driving Metal Chain Price Trends
- Portugal Driving Metal Chain Porter`s Five Forces
- Portugal Driving Metal Chain Industry Life Cycle
- Historical Data and Forecast of Portugal Driving Metal Chain Market Revenues & Volume By Type for the Period 2022 - 2032F
- Historical Data and Forecast of Portugal Driving Metal Chain Market Revenues & Volume By Stainless Steel Chain for the Period 2022 - 2032F
- Historical Data and Forecast of Portugal Driving Metal Chain Market Revenues & Volume By Carbon Steel Chain for the Period 2022 - 2032F
- Historical Data and Forecast of Portugal Driving Metal Chain Market Revenues & Volume By Alloy Chain for the Period 2022 - 2032F
- Historical Data and Forecast of Portugal Driving Metal Chain Market Revenues & Volume By Copper Chain for the Period 2022 - 2032F
- Historical Data and Forecast of Portugal Driving Metal Chain Market Revenues & Volume By Others for the Period 2022 - 2032F
- Historical Data and Forecast of Portugal Driving Metal Chain Market Revenues & Volume By Application for the Period 2022 - 2032F
- Historical Data and Forecast of Portugal Driving Metal Chain Market Revenues & Volume By Automobile for the Period 2022 - 2032F
- Historical Data and Forecast of Portugal Driving Metal Chain Market Revenues & Volume By Agricultural for the Period 2022 - 2032F
- Historical Data and Forecast of Portugal Driving Metal Chain Market Revenues & Volume By Construction for the Period 2022 - 2032F
- Historical Data and Forecast of Portugal Driving Metal Chain Market Revenues & Volume By Others for the Period 2022 - 2032F
- Portugal Driving Metal Chain Import Export Trade Statistics
- Market Opportunity Assessment By Type
- Market Opportunity Assessment By Application
- Portugal Driving Metal Chain Top Companies Market Share
- Portugal Driving Metal Chain Competitive Benchmarking By Technical and Operational Parameters
- Portugal Driving Metal Chain Company Profiles
- Portugal Driving Metal Chain Key Strategic Recommendations
Frequently Asked Questions About the Market Study (FAQs):
6Wresearch actively monitors the Portugal Driving Metal Chain Market and publishes its comprehensive annual report, highlighting emerging trends, growth drivers, revenue analysis, and forecast outlook. Our insights help businesses to make data-backed strategic decisions with ongoing market dynamics. Our analysts track relevent industries related to the Portugal Driving Metal Chain Market, allowing our clients with actionable intelligence and reliable forecasts tailored to emerging regional needs.
Yes, we provide customisation as per your requirements. To learn more, feel free to contact us on sales@6wresearch.com
1 Executive Summary |
2 Introduction |
2.1 Key Highlights of the Report |
2.2 Report Description |
2.3 Market Scope & Segmentation |
2.4 Research Methodology |
2.5 Assumptions |
3 Portugal Driving Metal Chain Market Overview |
3.1 Portugal Country Macro Economic Indicators |
3.2 Portugal Driving Metal Chain Market Revenues & Volume, 2022 & 2032F |
3.3 Portugal Driving Metal Chain Market - Industry Life Cycle |
3.4 Portugal Driving Metal Chain Market - Porter's Five Forces |
3.5 Portugal Driving Metal Chain Market Revenues & Volume Share, By Type, 2022 & 2032F |
3.6 Portugal Driving Metal Chain Market Revenues & Volume Share, By Application, 2022 & 2032F |
4 Portugal Driving Metal Chain Market Dynamics |
4.1 Impact Analysis |
4.2 Market Drivers |
4.2.1 Growing automotive industry in Portugal, leading to increased demand for metal chains in vehicles. |
4.2.2 Expansion of the construction sector in Portugal, driving the need for metal chains in machinery and equipment. |
4.2.3 Rise in infrastructure projects and investments in the country, boosting the demand for metal chains for various applications. |
4.2.4 Increasing focus on renewable energy projects in Portugal, creating opportunities for metal chains in wind turbines and other applications. |
4.3 Market Restraints |
4.3.1 Competition from alternative materials like synthetic chains impacting the demand for metal chains. |
4.3.2 Fluctuating raw material prices affecting the production cost of metal chains. |
4.3.3 Economic uncertainty and market volatility leading to cautious spending by businesses, impacting the market for metal chains. |
4.3.4 Stringent regulations related to environmental standards and safety requirements affecting the manufacturing and usage of metal chains. |
5 Portugal Driving Metal Chain Market Trends |
6 Portugal Driving Metal Chain Market Segmentations |
6.1 Portugal Driving Metal Chain Market, By Type |
6.1.1 Overview and Analysis |
6.1.2 Portugal Driving Metal Chain Market Revenues & Volume, By Stainless Steel Chain, 2022 - 2032F |
6.1.3 Portugal Driving Metal Chain Market Revenues & Volume, By Carbon Steel Chain, 2022 - 2032F |
6.1.4 Portugal Driving Metal Chain Market Revenues & Volume, By Alloy Chain, 2022 - 2032F |
6.1.5 Portugal Driving Metal Chain Market Revenues & Volume, By Copper Chain, 2022 - 2032F |
6.1.6 Portugal Driving Metal Chain Market Revenues & Volume, By Others, 2022 - 2032F |
6.2 Portugal Driving Metal Chain Market, By Application |
6.2.1 Overview and Analysis |
6.2.2 Portugal Driving Metal Chain Market Revenues & Volume, By Automobile, 2022 - 2032F |
6.2.3 Portugal Driving Metal Chain Market Revenues & Volume, By Agricultural, 2022 - 2032F |
6.2.4 Portugal Driving Metal Chain Market Revenues & Volume, By Construction, 2022 - 2032F |
6.2.5 Portugal Driving Metal Chain Market Revenues & Volume, By Others, 2022 - 2032F |
7 Portugal Driving Metal Chain Market Import-Export Trade Statistics |
7.1 Portugal Driving Metal Chain Market Export to Major Countries |
7.2 Portugal Driving Metal Chain Market Imports from Major Countries |
8 Portugal Driving Metal Chain Market Key Performance Indicators |
8.1 Percentage increase in demand from the automotive sector in Portugal. |
8.2 Number of new construction projects using metal chains in the country. |
8.3 Growth in the renewable energy sector and its impact on the adoption of metal chains. |
8.4 Innovation rate in metal chain technology and product development. |
8.5 Number of partnerships or collaborations with key industries driving the metal chain market. |
9 Portugal Driving Metal Chain Market - Opportunity Assessment |
9.1 Portugal Driving Metal Chain Market Opportunity Assessment, By Type, 2022 & 2032F |
9.2 Portugal Driving Metal Chain Market Opportunity Assessment, By Application, 2022 & 2032F |
10 Portugal Driving Metal Chain Market - Competitive Landscape |
10.1 Portugal Driving Metal Chain Market Revenue Share, By Companies, 2025 |
10.2 Portugal Driving Metal Chain Market Competitive Benchmarking, By Operating and Technical Parameters |
11 Company Profiles |
12 Recommendations | 13 Disclaimer |
Global Go To Market Strategy - 2030
Export potential enables firms to identify high-growth global markets with greater confidence by combining advanced trade intelligence with a structured quantitative methodology. The framework analyzes emerging demand trends and country-level import patterns while integrating macroeconomic and trade datasets such as GDP and population forecasts, bilateral import–export flows, tariff structures, elasticity differentials between developed and developing economies, geographic distance, and import demand projections. Using weighted trade values from 2020–2024 as the base period to project country-to-country export potential for 2030, these inputs are operationalized through calculated drivers such as gravity model parameters, tariff impact factors, and projected GDP per-capita growth. Through an analysis of hidden potentials, demand hotspots, and market conditions that are most favorable to success, this method enables firms to focus on target countries, maximize returns, and global expansion with data, backed by accuracy.
By factoring in the projected importer demand gap that is currently unmet and could be potential opportunity, it identifies the potential for the Exporter (Country) among 190 countries, against the general trade analysis, which identifies the biggest importer or exporter.
To discover high-growth global markets and optimize your business strategy:
Click Here
Pricing
- Single User License$ 1,995
- Department License$ 2,400
- Site License$ 3,120
- Global License$ 3,795

Leadership Perspectives from Industry Events
Search
Thought Leadership and Analyst Meet


Our Clients
6WResearch In News
- India Export Attractiveness Tracker 2026
- India Air Conditioner Market Set for Strong Rebound in 2026 After Weather-Led Correction and GST-Driven Recovery: 6Wresearch
- ADAS in India: How Automatic Emergency Braking, Blind Spot Detection & Driver Monitoring are Transforming Road Safety
- Doha a strategic location for EV manufacturing hub: IPA Qatar
- Demand for luxury TVs surging in the GCC, says Samsung
- Empowering Growth: The Thriving Journey of Bangladesh’s Cable Industry
Latest Reports
- Nicaragua RPG Gaming Market (2026-2032)
- New Zealand RPG Gaming Market (2026-2032)
- Netherlands RPG Gaming Market (2026-2032)
- Nauru RPG Gaming Market (2026-2032)
- Namibia RPG Gaming Market (2026-2032)
- Mozambique RPG Gaming Market (2026-2032)
- Montenegro RPG Gaming Market (2026-2032)
- Mongolia RPG Gaming Market (2026-2032)
- Monaco RPG Gaming Market (2026-2032)
- Micronesia RPG Gaming Market (2026-2032)
Industry Events and Analyst Meet

EV India Expo 2026

HIMTEX 2026

India Refining Summit 2026

India EV Show 2026

EV tech India Expo 2026
Whitepaper
- Middle East & Africa Commercial Security Market Click here to view more.
- Middle East & Africa Fire Safety Systems & Equipment Market Click here to view more.
- GCC Drone Market Click here to view more.
- Middle East Lighting Fixture Market Click here to view more.
- GCC Physical & Perimeter Security Market Click here to view more.