Portugal Vanadium compounds Market (2026-2032) | Outlook, Trends, Forecast, Size, Industry, Growth, Share, Analysis, Revenue, Companies, Segmentation & Value
Market Forecast By Application (Chemical Catalysts, Pharmaceuticals, Pigments, Glaze) And Competitive Landscape
| Product Code: ETC4811495 | Publication Date: Nov 2023 | Updated Date: Apr 2026 | Product Type: Market Research Report | |
| Publisher: 6Wresearch | Author: Shubham Padhi | No. of Pages: 60 | No. of Figures: 30 | No. of Tables: 5 |
Portugal Vanadium Compounds Market Size (2020-2030)
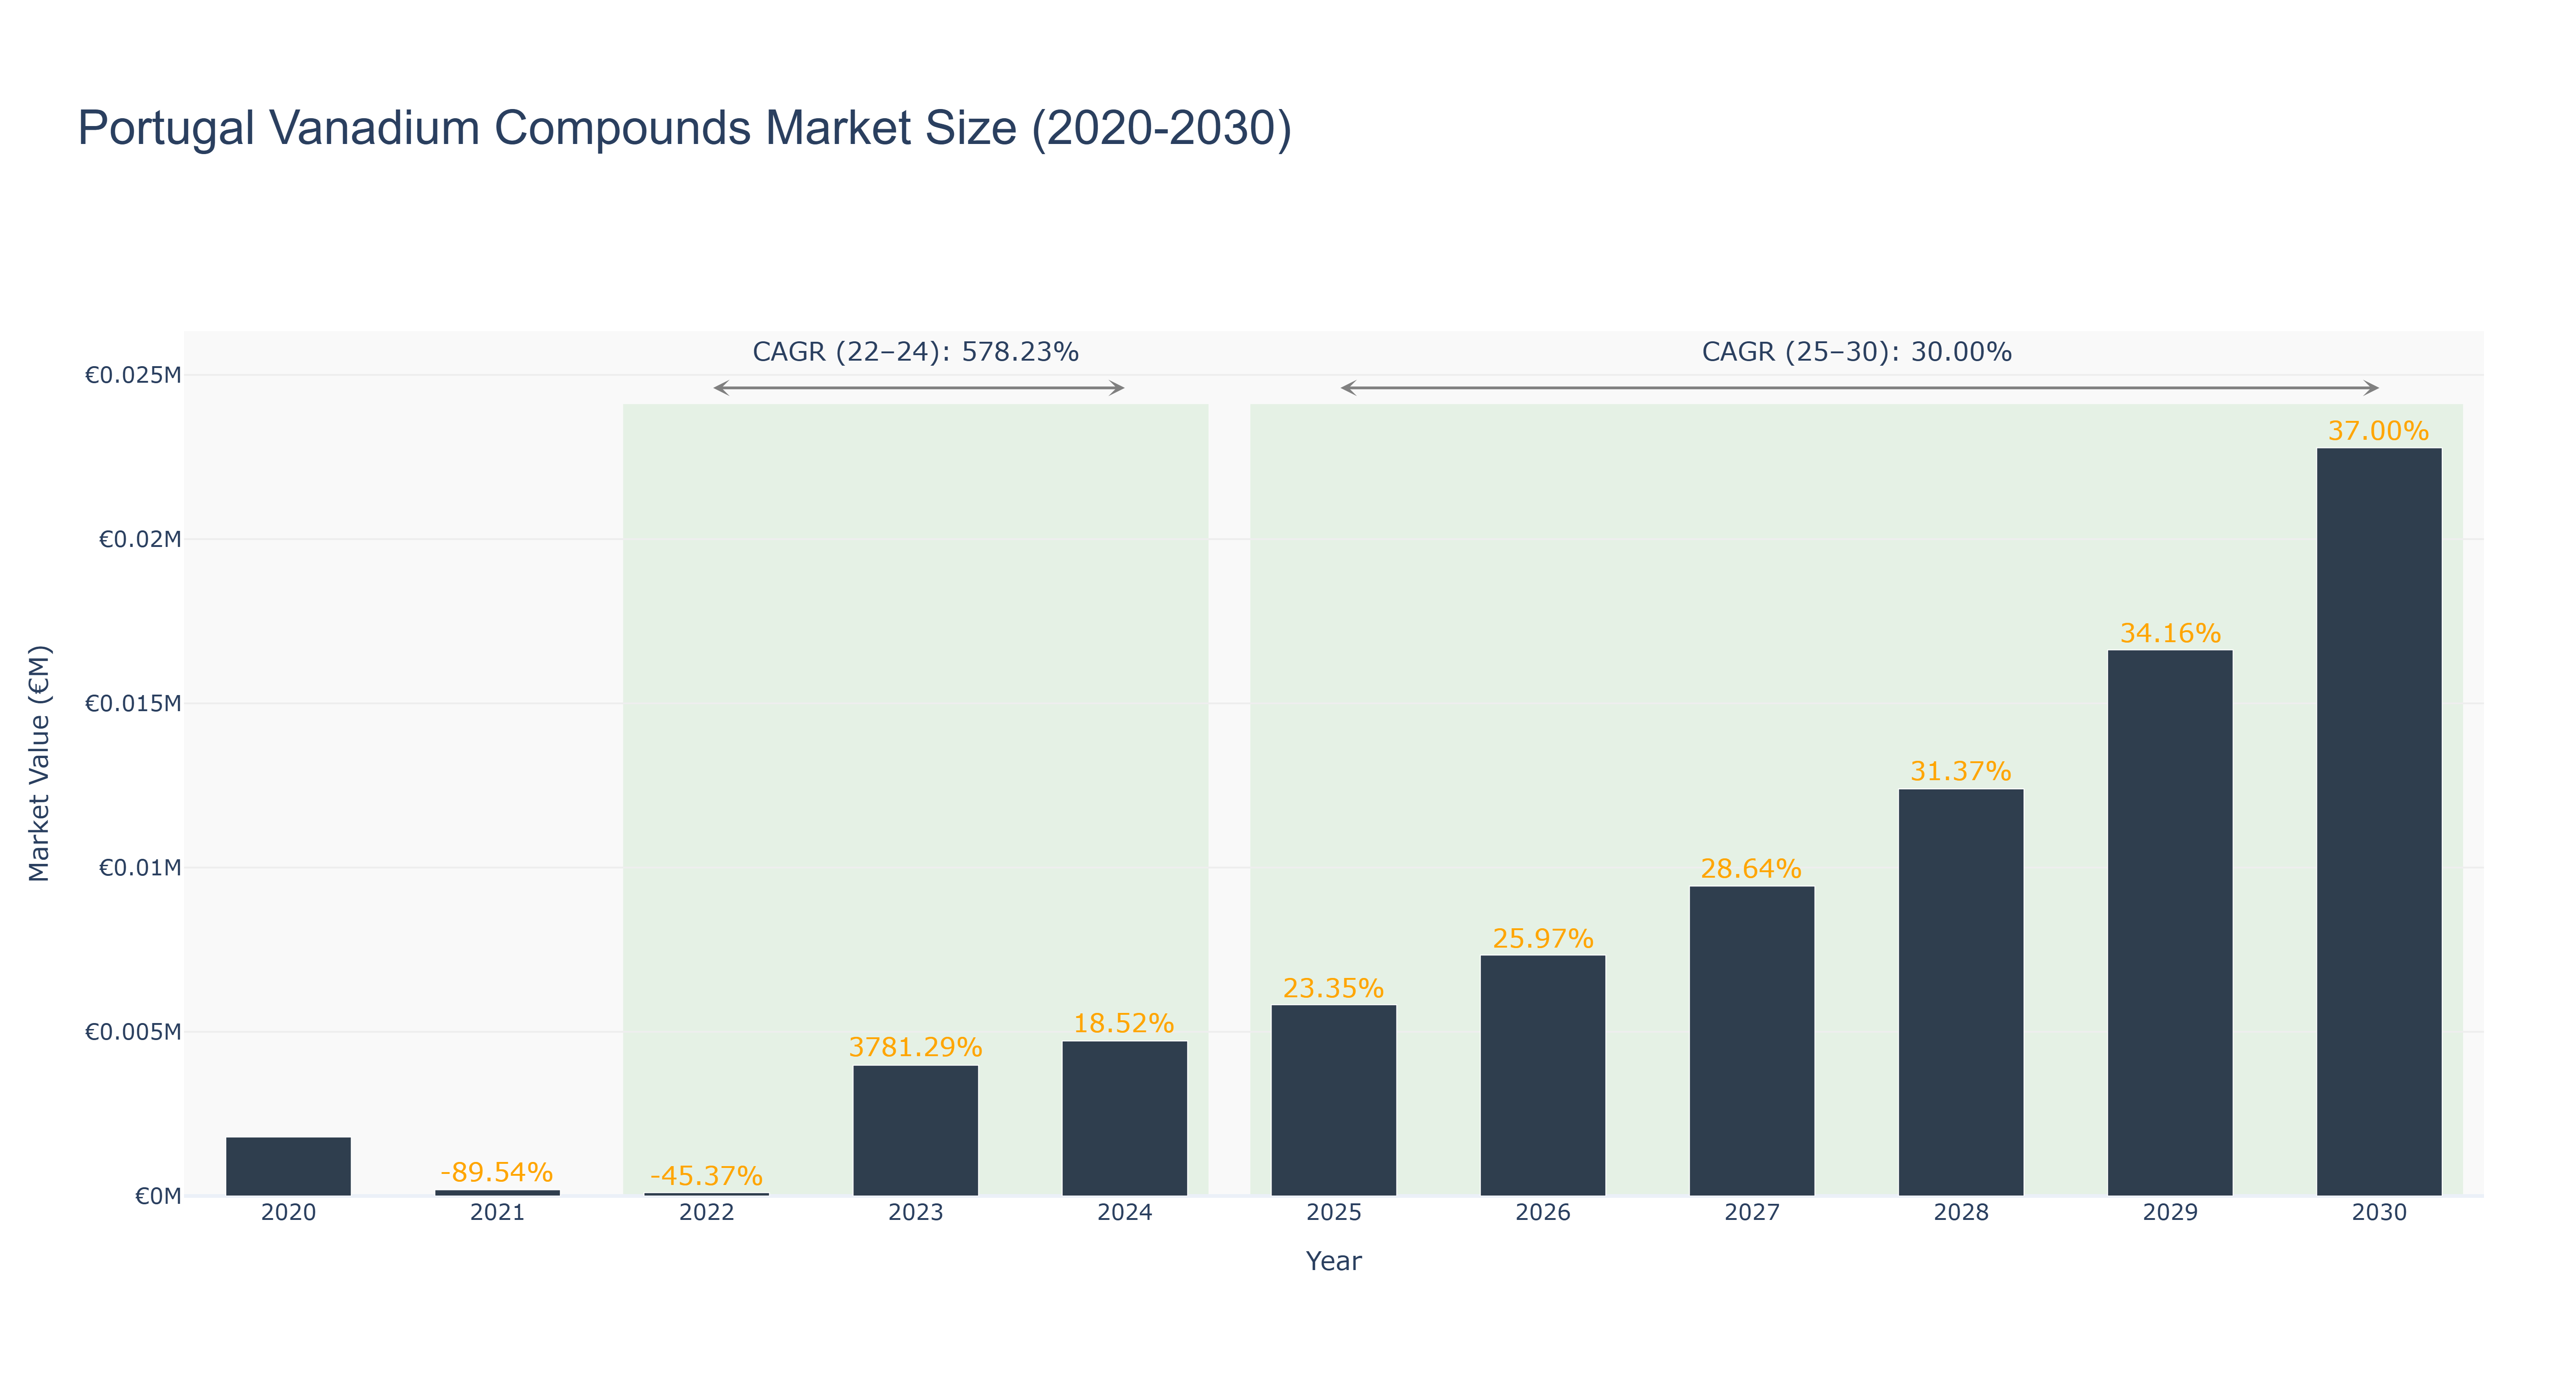
The Portugal Vanadium Compounds Market has experienced significant volatility over the past few years, with a peak market size of €187.80 thousand in 2021, followed by a sharp decline to €102.60 thousand in 2022. However, the market rebounded dramatically in 2023, reaching €3.98 thousand, driven by increased demand from renewable energy storage applications and advancements in battery technology. The actual market size is projected to grow at a remarkable CAGR of 578.23% from 2022 to 2024, reaching €4.72 thousand in 2024. Looking ahead, the forecasted period from 2025 to 2030 indicates sustained growth, with a projected CAGR of 30.00%, culminating in a market size of €22.78 thousand by 2030. This upward trajectory is likely fueled by ongoing investments in sustainable energy solutions and the increasing adoption of vanadium redox flow batteries, positioning Portugal as a key player in the vanadium market landscape.
Portugal Vanadium Compounds Market: Production & Trade Performance (2019-2025)
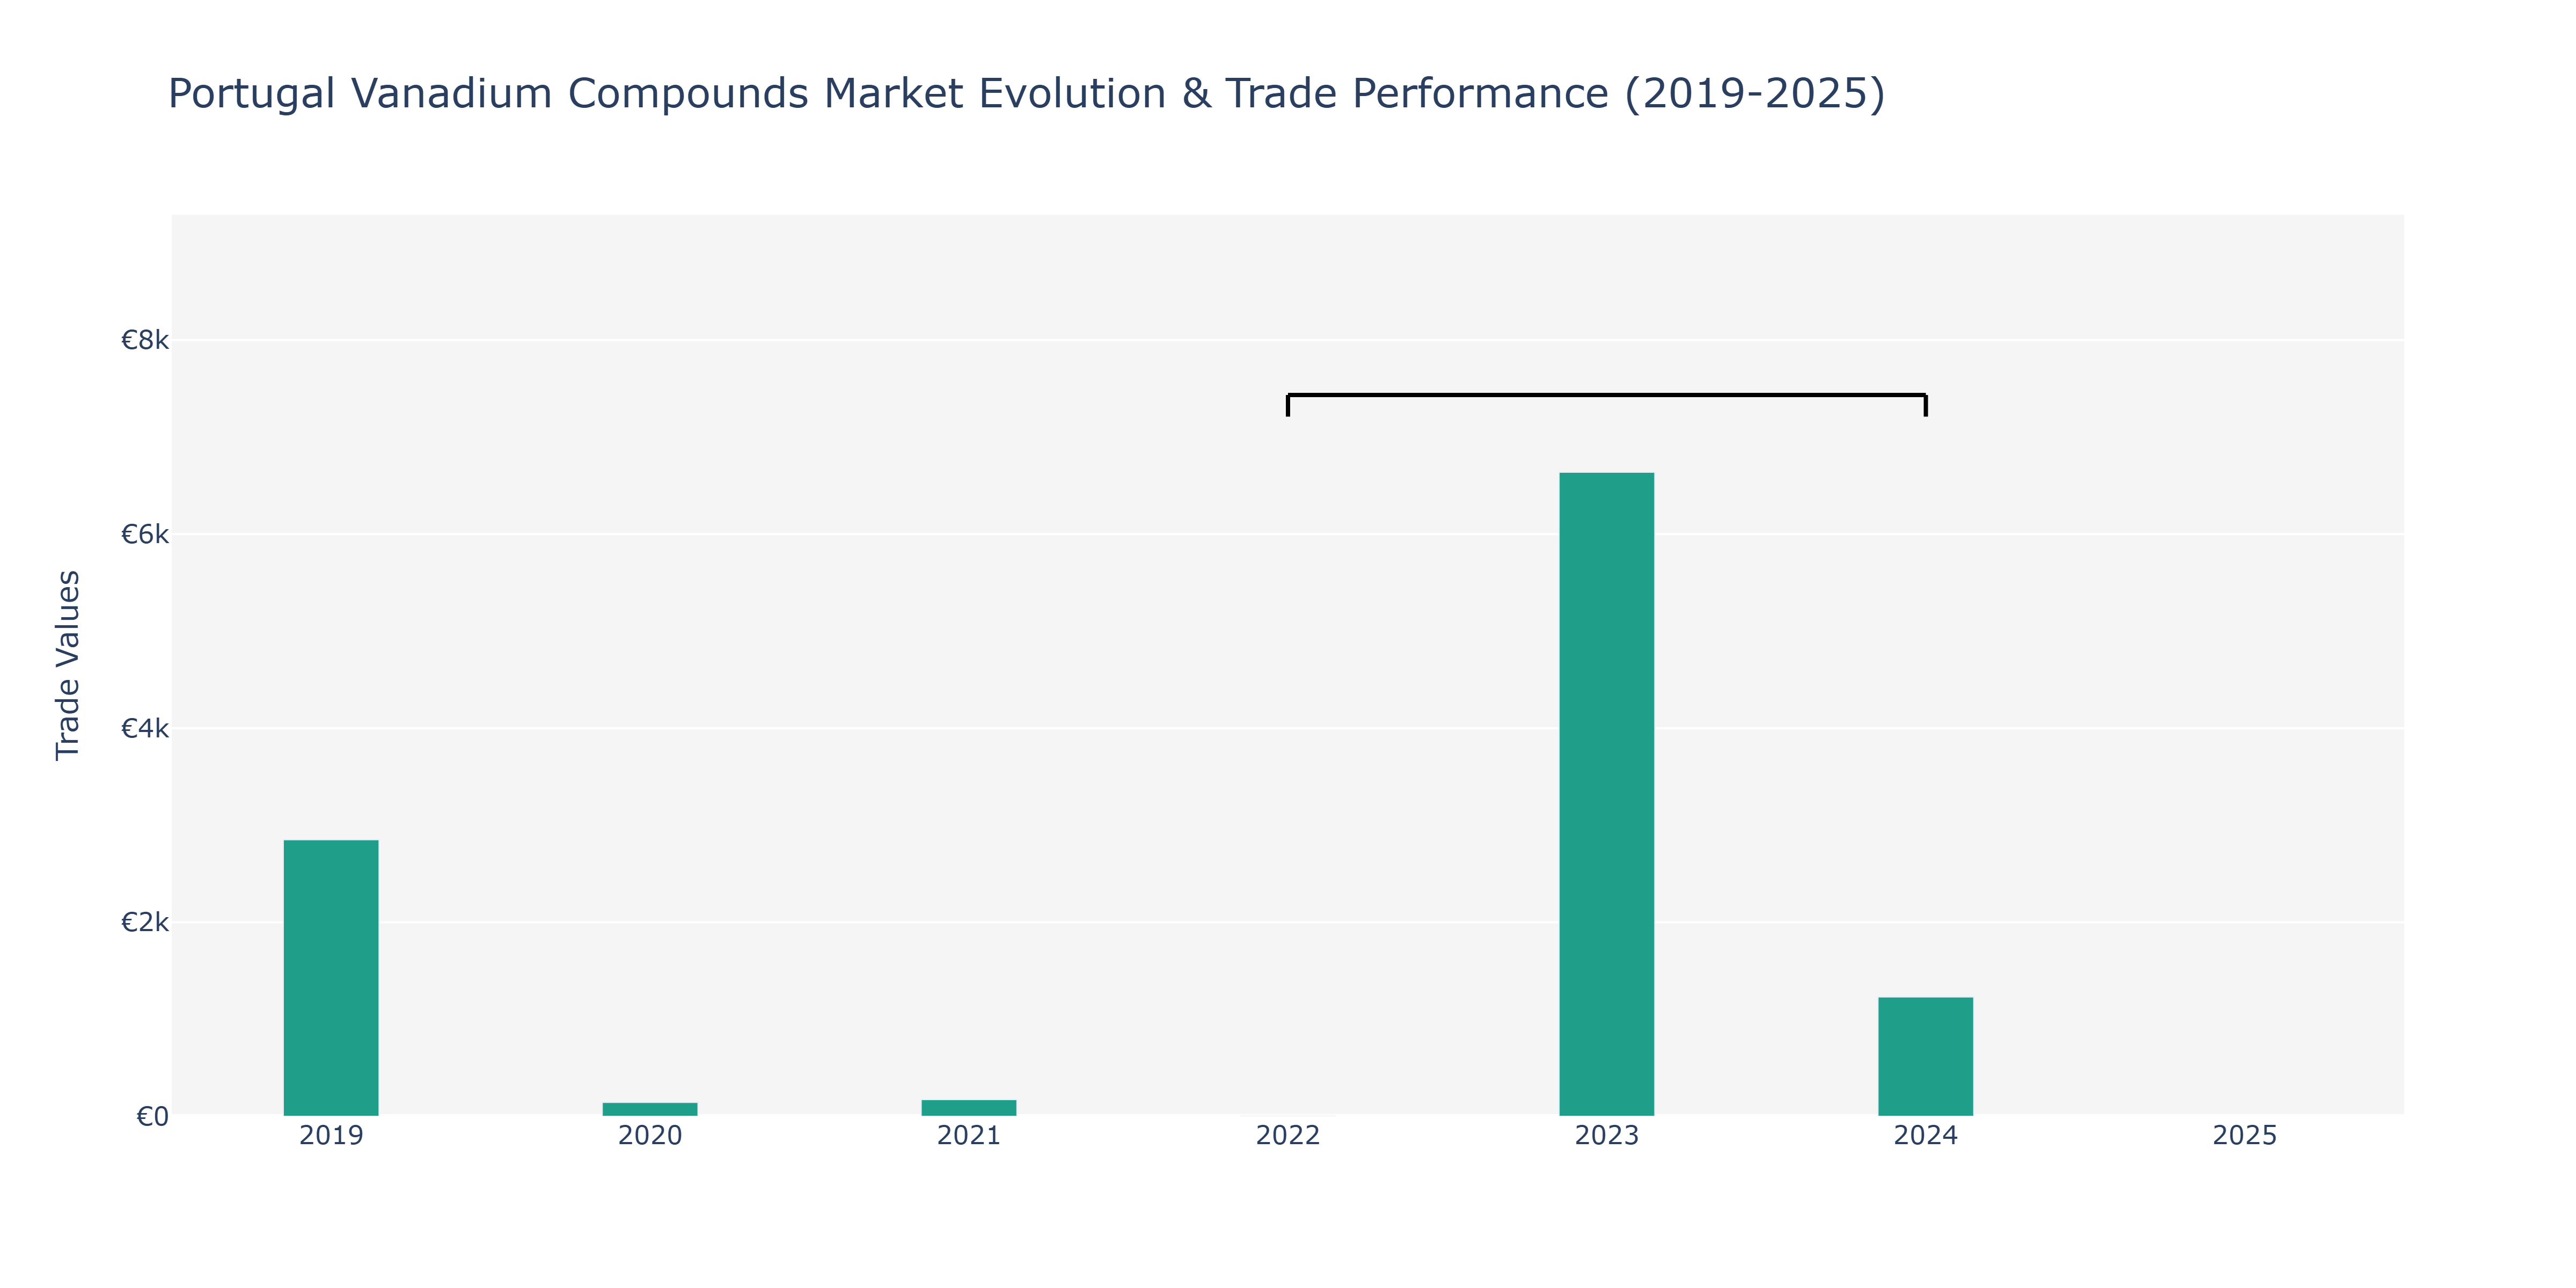
Between 2019 and 2021, the Portugal Vanadium Compounds Market experienced a noticeable decline in imports, dropping from €2.85 thousand to €142 million, before a slight recovery to €171 million in 2021. This initial decrease could be attributed to factors like changing global market dynamics, economic uncertainties, or possibly shifts in local demand. However, in 2023, imports surged to €6.64 thousand, marking a substantial increase compared to previous years. This spike could be linked to increased industrial activities, infrastructure projects, or strategic initiatives by market players. The following year, 2024, saw a decrease to €1.23 thousand, which might be a result of market stabilization, regulatory changes, or adjustments in supply chains. These fluctuations highlight the market's sensitivity to various external factors, emphasizing the importance of adaptive strategies for stakeholders in the Portugal Vanadium Compounds sector.
Key Highlights of the Report:
- Portugal Vanadium compounds Market Outlook
- Market Size of Portugal Vanadium compounds Market, 2025
- Forecast of Portugal Vanadium compounds Market, 2032
- Historical Data and Forecast of Portugal Vanadium compounds Revenues & Volume for the Period 2022 - 2032F
- Portugal Vanadium compounds Market Trend Evolution
- Portugal Vanadium compounds Market Drivers and Challenges
- Portugal Vanadium compounds Price Trends
- Portugal Vanadium compounds Porter`s Five Forces
- Portugal Vanadium compounds Industry Life Cycle
- Historical Data and Forecast of Portugal Vanadium compounds Market Revenues & Volume By Application for the Period 2022 - 2032F
- Historical Data and Forecast of Portugal Vanadium compounds Market Revenues & Volume By Chemical Catalysts for the Period 2022 - 2032F
- Historical Data and Forecast of Portugal Vanadium compounds Market Revenues & Volume By Pharmaceuticals for the Period 2022 - 2032F
- Historical Data and Forecast of Portugal Vanadium compounds Market Revenues & Volume By Pigments for the Period 2022 - 2032F
- Historical Data and Forecast of Portugal Vanadium compounds Market Revenues & Volume By Glaze for the Period 2022 - 2032F
- Portugal Vanadium compounds Import Export Trade Statistics
- Market Opportunity Assessment By Application
- Portugal Vanadium compounds Top Companies Market Share
- Portugal Vanadium compounds Competitive Benchmarking By Technical and Operational Parameters
- Portugal Vanadium compounds Company Profiles
- Portugal Vanadium compounds Key Strategic Recommendations
Frequently Asked Questions About the Market Study (FAQs):
6Wresearch actively monitors the Portugal Vanadium compounds Market and publishes its comprehensive annual report, highlighting emerging trends, growth drivers, revenue analysis, and forecast outlook. Our insights help businesses to make data-backed strategic decisions with ongoing market dynamics. Our analysts track relevent industries related to the Portugal Vanadium compounds Market, allowing our clients with actionable intelligence and reliable forecasts tailored to emerging regional needs.
Yes, we provide customisation as per your requirements. To learn more, feel free to contact us on sales@6wresearch.com
1 Executive Summary |
2 Introduction |
2.1 Key Highlights of the Report |
2.2 Report Description |
2.3 Market Scope & Segmentation |
2.4 Research Methodology |
2.5 Assumptions |
3 Portugal Vanadium compounds Market Overview |
3.1 Portugal Country Macro Economic Indicators |
3.2 Portugal Vanadium compounds Market Revenues & Volume, 2022 & 2032F |
3.3 Portugal Vanadium compounds Market - Industry Life Cycle |
3.4 Portugal Vanadium compounds Market - Porter's Five Forces |
3.5 Portugal Vanadium compounds Market Revenues & Volume Share, By Application, 2022 & 2032F |
4 Portugal Vanadium compounds Market Dynamics |
4.1 Impact Analysis |
4.2 Market Drivers |
4.2.1 Increasing demand for energy storage solutions |
4.2.2 Growing adoption of vanadium compounds in steel manufacturing |
4.2.3 Government initiatives promoting renewable energy sources |
4.3 Market Restraints |
4.3.1 Fluctuating raw material prices |
4.3.2 Market volatility due to geopolitical factors |
4.3.3 Regulatory challenges in the vanadium compounds industry |
5 Portugal Vanadium compounds Market Trends |
6 Portugal Vanadium compounds Market Segmentations |
6.1 Portugal Vanadium compounds Market, By Application |
6.1.1 Overview and Analysis |
6.1.2 Portugal Vanadium compounds Market Revenues & Volume, By Chemical Catalysts, 2022 - 2032F |
6.1.3 Portugal Vanadium compounds Market Revenues & Volume, By Pharmaceuticals, 2022 - 2032F |
6.1.4 Portugal Vanadium compounds Market Revenues & Volume, By Pigments, 2022 - 2032F |
6.1.5 Portugal Vanadium compounds Market Revenues & Volume, By Glaze, 2022 - 2032F |
7 Portugal Vanadium compounds Market Import-Export Trade Statistics |
7.1 Portugal Vanadium compounds Market Export to Major Countries |
7.2 Portugal Vanadium compounds Market Imports from Major Countries |
8 Portugal Vanadium compounds Market Key Performance Indicators |
8.1 Average selling price of vanadium compounds |
8.2 Research and development investment in vanadium technologies |
8.3 Number of new energy storage projects incorporating vanadium compounds |
8.4 Percentage of vanadium compounds used in steel production |
8.5 Adoption rate of vanadium compounds in renewable energy applications |
9 Portugal Vanadium compounds Market - Opportunity Assessment |
9.1 Portugal Vanadium compounds Market Opportunity Assessment, By Application, 2022 & 2032F |
10 Portugal Vanadium compounds Market - Competitive Landscape |
10.1 Portugal Vanadium compounds Market Revenue Share, By Companies, 2025 |
10.2 Portugal Vanadium compounds Market Competitive Benchmarking, By Operating and Technical Parameters |
11 Company Profiles |
12 Recommendations | 13 Disclaimer |
Global Go To Market Strategy - 2030
Export potential enables firms to identify high-growth global markets with greater confidence by combining advanced trade intelligence with a structured quantitative methodology. The framework analyzes emerging demand trends and country-level import patterns while integrating macroeconomic and trade datasets such as GDP and population forecasts, bilateral import–export flows, tariff structures, elasticity differentials between developed and developing economies, geographic distance, and import demand projections. Using weighted trade values from 2020–2024 as the base period to project country-to-country export potential for 2030, these inputs are operationalized through calculated drivers such as gravity model parameters, tariff impact factors, and projected GDP per-capita growth. Through an analysis of hidden potentials, demand hotspots, and market conditions that are most favorable to success, this method enables firms to focus on target countries, maximize returns, and global expansion with data, backed by accuracy.
By factoring in the projected importer demand gap that is currently unmet and could be potential opportunity, it identifies the potential for the Exporter (Country) among 190 countries, against the general trade analysis, which identifies the biggest importer or exporter.
To discover high-growth global markets and optimize your business strategy:
Click Here
Pricing
- Single User License$ 1,995
- Department License$ 2,400
- Site License$ 3,120
- Global License$ 3,795

Leadership Perspectives from Industry Events
Search
Thought Leadership and Analyst Meet


Our Clients
6WResearch In News
- Doha a strategic location for EV manufacturing hub: IPA Qatar
- Demand for luxury TVs surging in the GCC, says Samsung
- Empowering Growth: The Thriving Journey of Bangladesh’s Cable Industry
- Demand for luxury TVs surging in the GCC, says Samsung
- Video call with a traditional healer? Once unthinkable, it’s now common in South Africa
- Intelligent Buildings To Smooth GCC’s Path To Net Zero
Latest Reports
- Taiwan Airport Wireless Infrastructure Market (2026-2032)
- Vietnam Airport Wireless Infrastructure Market (2026-2032)
- Thailand Airport Wireless Infrastructure Market (2026-2032)
- South Korea Airport Wireless Infrastructure Market (2026-2032)
- Romania Airport Wireless Infrastructure Market (2026-2032)
- Qatar Airport Wireless Infrastructure Market (2026-2032)
- Philippines Airport Wireless Infrastructure Market (2026-2032)
- Japan Airport Wireless Infrastructure Market (2026-2032)
- Taiwan Airport Winter Services Market (2026-2032)
- Vietnam Airport Winter Services Market (2026-2032)
Industry Events and Analyst Meet

HIMTEX 2026

India Refining Summit 2026

India EV Show 2026

EV tech India Expo 2026

Auto Tech Asia 2026
Whitepaper
- Middle East & Africa Commercial Security Market Click here to view more.
- Middle East & Africa Fire Safety Systems & Equipment Market Click here to view more.
- GCC Drone Market Click here to view more.
- Middle East Lighting Fixture Market Click here to view more.
- GCC Physical & Perimeter Security Market Click here to view more.