Qatar Alcohols and Epoxides Market (2026-2032) | Forecast, Outlook, Trends, Size, Companies, Value, Analysis, Share, Revenue, Growth & Industry
Market Forecast By Product Types (Alocohols, Epoxides), By Epoxides (Ethylene Oxide, Propylene Oxide), By Alcohols Type (Ethyl, Denatured, Isopropyl, Rubbing), By Applications (Coated Fabric, Wire & Cable, Flooring & Wall Coverings, Film & Sheet, Medical Devices, Consumer Goods, Others) And Competitive Landscape
| Product Code: ETC028681 | Publication Date: Jul 2023 | Updated Date: Jun 2026 | Product Type: Report | |
| Publisher: 6Wresearch | Author: Ravi Bhandari | No. of Pages: 70 | No. of Figures: 35 | No. of Tables: 5 |
Qatar Alcohols and Epoxides Market Summary
The qatar alcohols and epoxides market was estimated at USD 441 Million in 2025 and is projected to reach USD 589 Million by 2032, growing at a CAGR of 5.2% from 2026 to 2032.
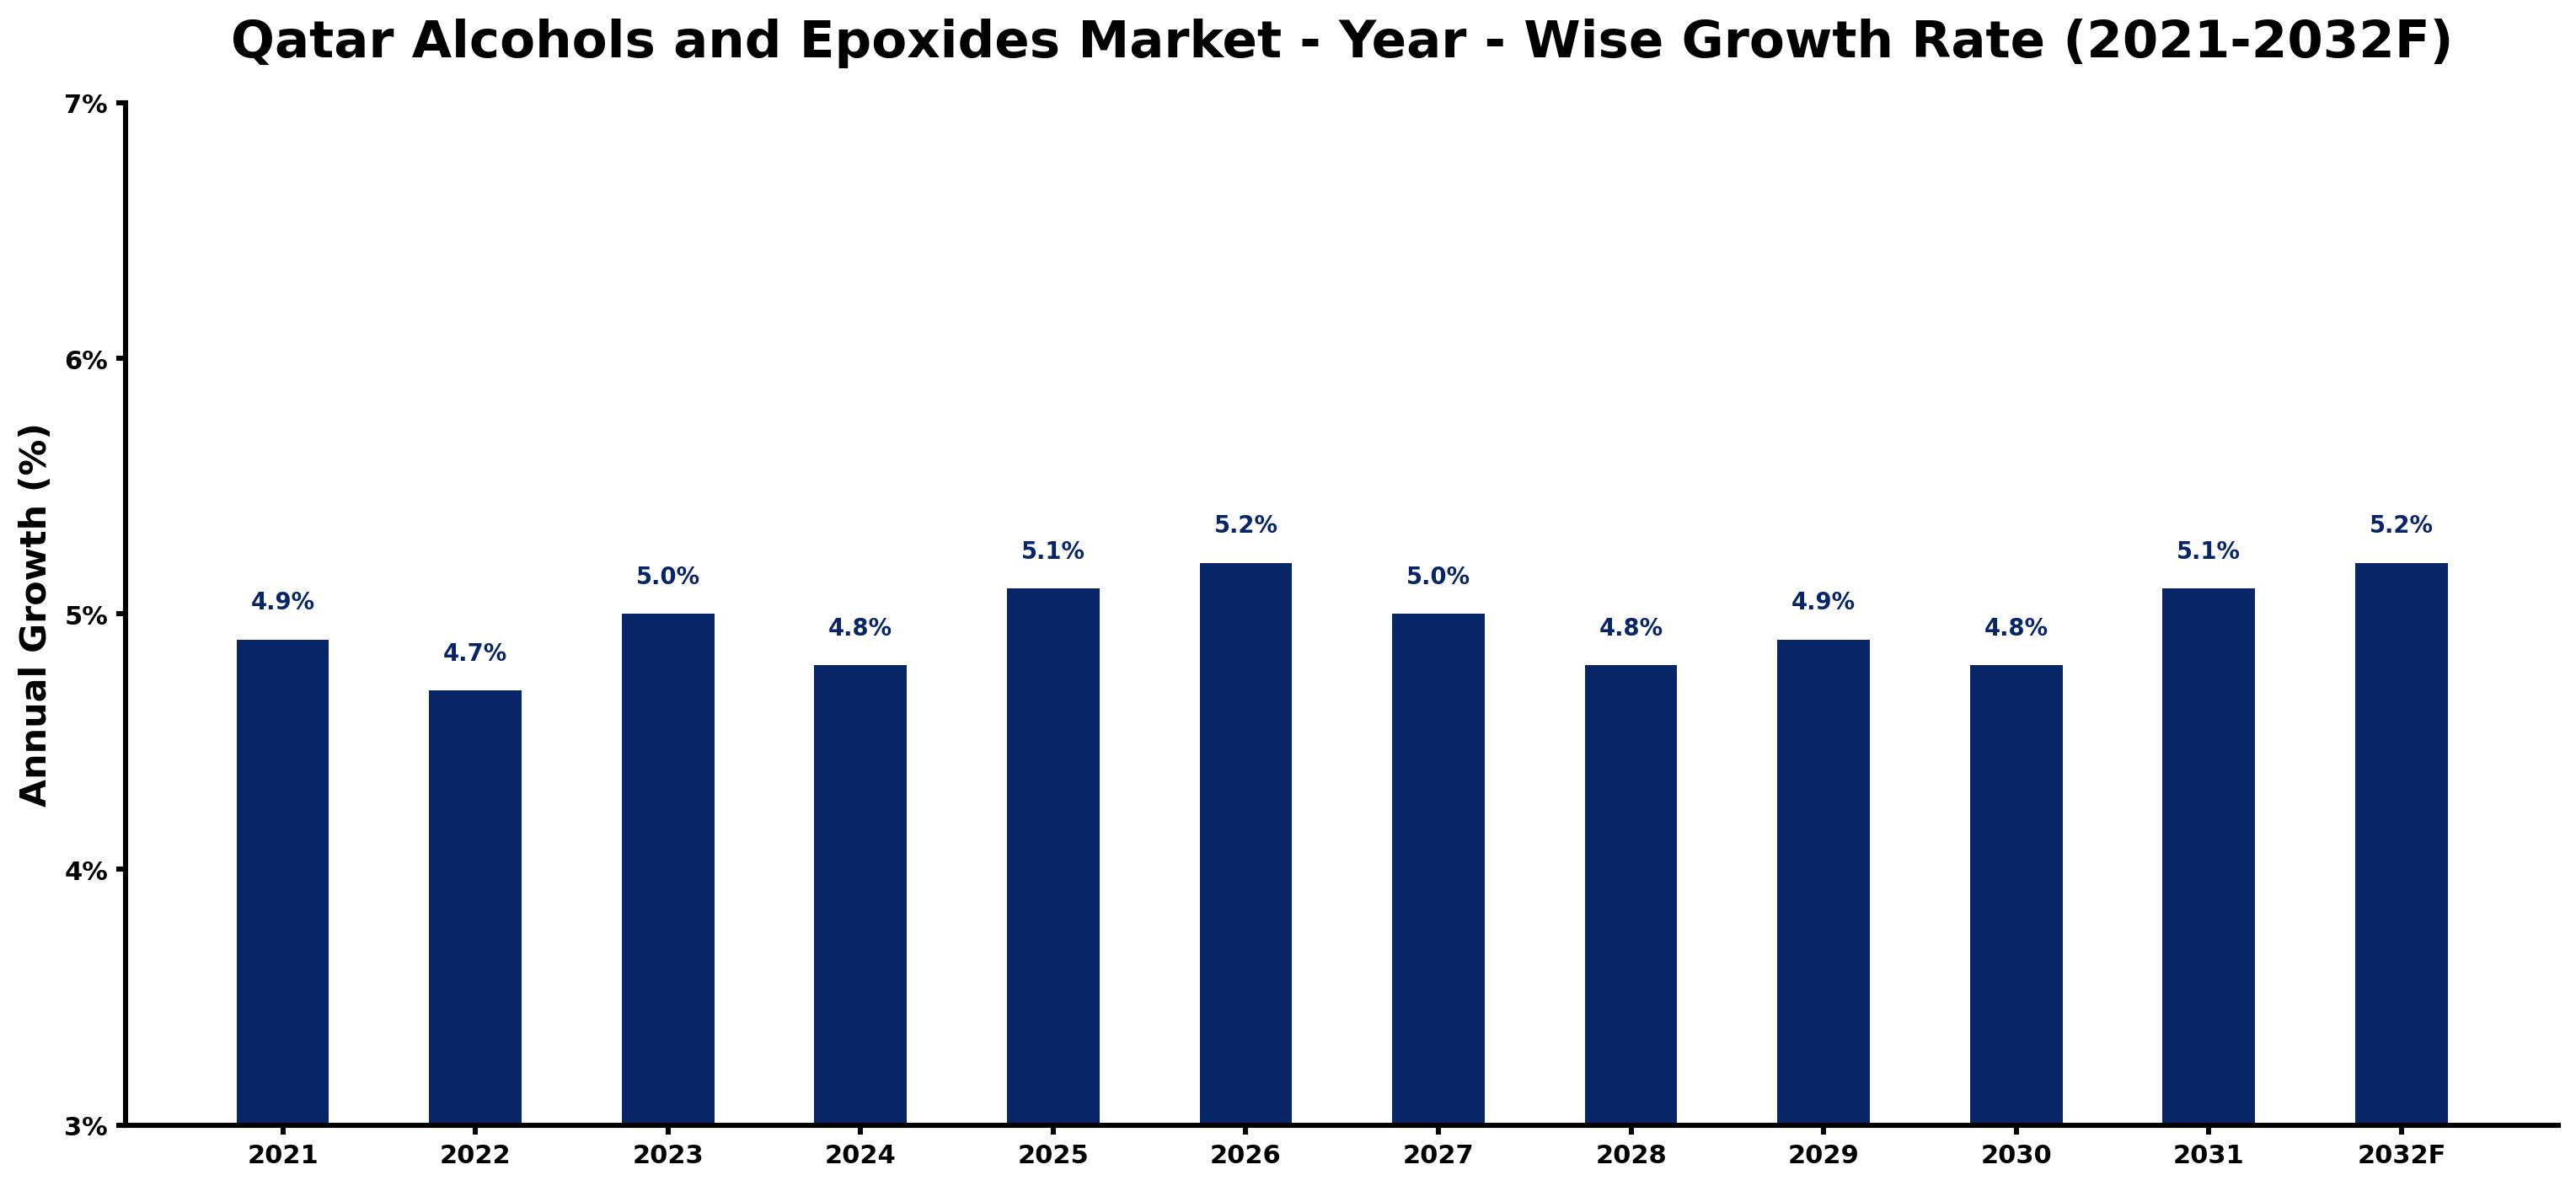
Qatar Alcohols and Epoxides Market Growth Rate Analysis (2021-2032)
The Qatar Alcohols and Epoxides market has displayed a stable growth pattern, with annual growth rates fluctuating between 4.7% and 5.2% over the past few years. After recording a solid growth of 4.9% in 2021, the market slightly contracted to 4.7% in 2022, primarily due to global supply chain disruptions. However, a resurgence in consumer demand and increased investment in petrochemical infrastructure propelled growth to 5.0% in 2023, with further increases to 5.1% by 2025, driven by technological advancements and a strong push for energy transition. By 2032, the growth is expected to stabilize at around 5.2%, reflecting ongoing improvements in industrial efficiency and a favorable regulatory environment.
Qatar Alcohols and Epoxides Market Year-wise Growth Rate and Key Drivers
This graph highlights how the Qatar Alcohols and Epoxides Market has steadily grown over the past five years, supported by major growth factors.
The table below presents the year wise growth rates along with the key drivers influencing the market
| Year | Growth Rate | Major Drivers |
| 2021 | 4.9% | Increased local manufacturing capabilities are reshaping Qatar's alcohols and epoxides landscape. |
| 2022 | 4.7% | Domestic consumption patterns indicate a slow shift towards premium alcohol products. |
| 2023 | 5.0% | Corporate investments in eco-friendly packaging solutions show promise for future market expansion. |
| 2024 | 4.8% | Increasing demand for specialty chemicals in construction supports the epoxides sector growth. |
| 2025 | 5.1% | Evolving consumer preferences highlight a gradual acceptance of diverse alcoholic beverages. |
| 2026 | 5.2% | Collaboration with international brands enhances product variety and market accessibility. |
| 2027 | 5.0% | Growing interest in sustainable production methods attracts eco-conscious consumers and brands. |
| 2028 | 4.8% | Integration of technology in production processes improves efficiency and product quality. |
| 2029 | 4.9% | A robust hospitality sector drives demand for alcohol, reflecting changing cultural attitudes. |
| 2030 | 4.8% | Market diversification initiatives encourage local entrepreneurs to innovate in alcohol offerings. |
| 2031 | 5.1% | International tourism influx boosts awareness and consumption of premium alcohol products. |
| 2032 | 5.2% | Sustainability narratives resonate with consumers, shaping future buying decisions in the market. |
Note - Market size estimations and growth projections presented in this report are based on 6Wresearch's advanced forecasting approach, validated with industry datasets as of June 2026.
Qatar Alcohols and Epoxides Market Synopsis
The Qatar Alcohols and Epoxides Market is projected to reach 5.2% and witness significant growth during the forecast period (2026-2032). This market comprises essential organic compounds that serve vital roles across diverse industries, including solvents, intermediates for synthesizing various products, and as key components in fuels. Epoxides, conversely, find application as chemical intermediates pivotal for producing adhesives, polymers, resins, and coatings. The forthcoming years are expected to see a pronounced expansion of this market, primarily driven by escalating demand from pivotal end-use sectors such as paints coatings and pharmaceuticals & cosmetics.
Qatar Alcohols and Epoxides Market Growth Drivers
The growth trajectory of the Qatar alcohols and epoxides market is strongly influenced by several interlinked factors:
- The increasing demand from the paints and coatings sectors highlights the necessity for advanced alcohol and epoxide formulations that meet higher environmental standards and performance criteria.
- Pharmaceuticals and cosmetics are rapidly evolving industries in Qatar, with rising consumer awareness driving the need for high-quality chemical intermediates.
- Technological advancements in manufacturing are significantly enhancing production efficiencies, thereby increasing the output capacity of alcohols and epoxides.
- Government initiatives focused on environmental sustainability further create a robust demand for eco-friendly industrial chemicals, directly benefiting the alcohols and epoxides market.
- The influx of investments from multinational corporations aimed at product innovation and development is catalyzing more advanced production techniques within the region.
Qatar Alcohols and Epoxides Market Challenges and Restraints
Despite its growth potential, the Qatar alcohols and epoxides market faces several challenges that might impede its expansion:
- High research and development costs for new product lines can restrict the financial resources available for market participants, limiting innovation opportunities.
- Stringent regulations imposed by governments globally on specific chemical types can impact operational profitability and market entry strategies.
- Potential disruptions in supply chains due to geopolitical tensions could affect the availability of raw materials necessary for production.
- Market players may struggle with fluctuating raw material prices, which can lead to unpredictable profit margins and financial forecasting.
- Consumer trends towards sustainability could necessitate rapid shifts in production methods, challenging established manufacturing practices.
Qatar Alcohols and Epoxides Market Government Investment and Initiatives
The government of Qatar has been increasingly supportive of the alcohols and epoxides market through various initiatives designed to foster industrial growth and sustainability:
- Investment in infrastructure development aimed at enhancing the efficiency and capacity of chemical manufacturing facilities is a top governmental priority.
- Policies promoting the adoption of eco-friendly practices are encouraging manufacturers to transition towards greener alternatives in their production processes.
- Collaborations between the government and educational institutions are fostering research in chemical engineering, aiding in innovation and workforce development.
- The government is actively promoting public-private partnerships to catalyze advancements in research and product development within the sector.
- Various tax incentives and subsidies are provided to companies investing in sustainable technologies, enhancing the overall attractiveness of the region for chemical production.
Qatar Alcohols and Epoxides Market Latest Developments (May 2025 - June 2026)
Over the period from May 2025 to June 2026, several key developments have shaped the landscape of the Qatar alcohols and epoxides market:
- The industry has witnessed a resurgence in manufacturing capacity following the easing of COVID-19 restrictions, leading to a slight rebound in domestic consumption.
- Innovative product launches aimed at meeting the rising demands of the cosmetics sector have made significant strides in the market.
- Collaboration among regional players to explore synergies in research and development has been increasingly common, aimed at overcoming shared challenges.
- The impact of environmental regulations continues to influence production methodologies, with increasing emphasis placed on reducing waste and emissions.
- Trade dynamics in the region have been gradually improving, with export activities witnessing a moderate uptick post-lockdown, although challenges remain.
Qatar Alcohols and Epoxides Market - Key Attractiveness of the Report
- 10 Years of Market Numbers
- Historical Data Starting from 2022 to 2025
- Base Year: 2025
- Forecast Data until 2032
- Key Performance Indicators Impacting the Market
- Major Upcoming Developments and Projects
The growth is primarily driven by increasing demands from the paints & coatings and pharmaceuticals sectors, alongside significant investments in production technologies.
Key Highlights of the Report:
- Qatar Alcohols and Epoxides Market Outlook
- Market Size of Qatar Alcohols and Epoxides Market, 2025
- Forecast of Qatar Alcohols and Epoxides Market, 2032
- Historical Data and Forecast of Qatar Alcohols and Epoxides Revenues & Volume for the Period 2022-2032F
- Qatar Alcohols and Epoxides Market Trend Evolution
- Qatar Alcohols and Epoxides Market Drivers and Challenges
- Qatar Alcohols and Epoxides Price Trends
- Qatar Alcohols and Epoxides Porter's Five Forces
- Qatar Alcohols and Epoxides Industry Life Cycle
- Historical Data and Forecast of Qatar Alcohols and Epoxides Market Revenues & Volume By Product Types for the Period 2022-2032F
- Historical Data and Forecast of Qatar Alcohols and Epoxides Market Revenues & Volume By Alocohols for the Period 2022-2032F
- Historical Data and Forecast of Qatar Alcohols and Epoxides Market Revenues & Volume By Epoxides for the Period 2022-2032F
- Historical Data and Forecast of Qatar Alcohols and Epoxides Market Revenues & Volume By Epoxides for the Period 2022-2032F
- Historical Data and Forecast of Qatar Alcohols and Epoxides Market Revenues & Volume By Ethylene Oxide for the Period 2022-2032F
- Historical Data and Forecast of Qatar Alcohols and Epoxides Market Revenues & Volume By Propylene Oxide for the Period 2022-2032F
- Historical Data and Forecast of Qatar Alcohols and Epoxides Market Revenues & Volume By Alcohols Type for the Period 2022-2032F
- Historical Data and Forecast of Qatar Alcohols and Epoxides Market Revenues & Volume By Ethyl for the Period 2022-2032F
- Historical Data and Forecast of Qatar Alcohols and Epoxides Market Revenues & Volume By Denatured for the Period 2022-2032F
- Historical Data and Forecast of Qatar Alcohols and Epoxides Market Revenues & Volume By Isopropyl? for the Period 2022-2032F
- Historical Data and Forecast of Qatar Alcohols and Epoxides Market Revenues & Volume By Rubbing for the Period 2022-2032F
- Historical Data and Forecast of Qatar Alcohols and Epoxides Market Revenues & Volume By Applications for the Period 2022-2032F
- Historical Data and Forecast of Qatar Alcohols and Epoxides Market Revenues & Volume By Coated Fabric for the Period 2022-2032F
- Historical Data and Forecast of Qatar Alcohols and Epoxides Market Revenues & Volume By Wire & Cable for the Period 2022-2032F
- Historical Data and Forecast of Qatar Alcohols and Epoxides Market Revenues & Volume By Flooring & Wall Coverings for the Period 2022-2032F
- Historical Data and Forecast of Qatar Alcohols and Epoxides Market Revenues & Volume By Film & Sheet for the Period 2022-2032F
- Historical Data and Forecast of Qatar Alcohols and Epoxides Market Revenues & Volume By Medical Devices for the Period 2022-2032F
- Historical Data and Forecast of Qatar Alcohols and Epoxides Market Revenues & Volume By Consumer Goods for the Period 2022-2032F
- Historical Data and Forecast of Qatar Alcohols and Epoxides Market Revenues & Volume By Others for the Period 2022-2032F
- Qatar Alcohols and Epoxides Import Export Trade Statistics
- Market Opportunity Assessment By Product Types
- Market Opportunity Assessment By Epoxides
- Market Opportunity Assessment By Alcohols Type
- Market Opportunity Assessment By Applications
- Qatar Alcohols and Epoxides Top Companies Market Share
- Qatar Alcohols and Epoxides Competitive Benchmarking By Technical and Operational Parameters
- Qatar Alcohols and Epoxides Company Profiles
- Qatar Alcohols and Epoxides Key Strategic Recommendations
Frequently Asked Questions About the Market Study (FAQs):
The growth is primarily driven by increasing demands from the paints & coatings and pharmaceuticals sectors, alongside significant investments in production technologies.
The pandemic initially led to a decline in consumption and exports due to lockdowns, but the industry is gradually recovering as restrictions are lifted.
Key challenges include high R&D costs, stringent regulations on chemicals, and fluctuating raw material prices.
Government policies supporting sustainable industrial practices and investment in infrastructure are pivotal in fostering a conducive environment for market growth.
6Wresearch actively monitors the Qatar Alcohols and Epoxides Market and publishes its comprehensive annual report, highlighting emerging trends, growth drivers, revenue analysis, and forecast outlook. Our insights help businesses to make data-backed strategic decisions with ongoing market dynamics. Our analysts track relevent industries related to the Qatar Alcohols and Epoxides Market, allowing our clients with actionable intelligence and reliable forecasts tailored to emerging regional needs.
Yes, we provide customisation as per your requirements. To learn more, feel free to contact us on sales@6wresearch.com
1 Executive Summary |
2 Introduction |
2.1 Key Highlights of the Report |
2.2 Report Description |
2.3 Market Scope & Segmentation |
2.4 Research Methodology |
2.5 Assumptions |
3 Qatar Alcohols and Epoxides Market Overview |
3.1 Qatar Country Macro Economic Indicators |
3.2 Qatar Alcohols and Epoxides Market Revenues & Volume, 2022 & 2032F |
3.3 Qatar Alcohols and Epoxides Market - Industry Life Cycle |
3.4 Qatar Alcohols and Epoxides Market - Porter's Five Forces |
3.5 Qatar Alcohols and Epoxides Market Revenues & Volume Share, By Product Types, 2022 & 2032F |
3.6 Qatar Alcohols and Epoxides Market Revenues & Volume Share, By Epoxides, 2022 & 2032F |
3.7 Qatar Alcohols and Epoxides Market Revenues & Volume Share, By Alcohols Type, 2022 & 2032F |
3.8 Qatar Alcohols and Epoxides Market Revenues & Volume Share, By Applications, 2022 & 2032F |
4 Qatar Alcohols and Epoxides Market Dynamics |
4.1 Impact Analysis |
4.2 Market Drivers |
4.3 Market Restraints |
5 Qatar Alcohols and Epoxides Market Trends |
6 Qatar Alcohols and Epoxides Market, By Types |
6.1 Qatar Alcohols and Epoxides Market, By Product Types |
6.1.1 Overview and Analysis |
6.1.2 Qatar Alcohols and Epoxides Market Revenues & Volume, By Product Types, 2022-2032F |
6.1.3 Qatar Alcohols and Epoxides Market Revenues & Volume, By Alocohols, 2022-2032F |
6.1.4 Qatar Alcohols and Epoxides Market Revenues & Volume, By Epoxides, 2022-2032F |
6.2 Qatar Alcohols and Epoxides Market, By Epoxides |
6.2.1 Overview and Analysis |
6.2.2 Qatar Alcohols and Epoxides Market Revenues & Volume, By Ethylene Oxide, 2022-2032F |
6.2.3 Qatar Alcohols and Epoxides Market Revenues & Volume, By Propylene Oxide, 2022-2032F |
6.3 Qatar Alcohols and Epoxides Market, By Alcohols Type |
6.3.1 Overview and Analysis |
6.3.2 Qatar Alcohols and Epoxides Market Revenues & Volume, By Ethyl, 2022-2032F |
6.3.3 Qatar Alcohols and Epoxides Market Revenues & Volume, By Denatured, 2022-2032F |
6.3.4 Qatar Alcohols and Epoxides Market Revenues & Volume, By Isopropyl , 2022-2032F |
6.3.5 Qatar Alcohols and Epoxides Market Revenues & Volume, By Rubbing, 2022-2032F |
6.4 Qatar Alcohols and Epoxides Market, By Applications |
6.4.1 Overview and Analysis |
6.4.2 Qatar Alcohols and Epoxides Market Revenues & Volume, By Coated Fabric, 2022-2032F |
6.4.3 Qatar Alcohols and Epoxides Market Revenues & Volume, By Wire & Cable, 2022-2032F |
6.4.4 Qatar Alcohols and Epoxides Market Revenues & Volume, By Flooring & Wall Coverings, 2022-2032F |
6.4.5 Qatar Alcohols and Epoxides Market Revenues & Volume, By Film & Sheet, 2022-2032F |
6.4.6 Qatar Alcohols and Epoxides Market Revenues & Volume, By Medical Devices, 2022-2032F |
6.4.7 Qatar Alcohols and Epoxides Market Revenues & Volume, By Consumer Goods, 2022-2032F |
7 Qatar Alcohols and Epoxides Market Import-Export Trade Statistics |
7.1 Qatar Alcohols and Epoxides Market Export to Major Countries |
7.2 Qatar Alcohols and Epoxides Market Imports from Major Countries |
8 Qatar Alcohols and Epoxides Market Key Performance Indicators |
9 Qatar Alcohols and Epoxides Market - Opportunity Assessment |
9.1 Qatar Alcohols and Epoxides Market Opportunity Assessment, By Product Types, 2022 & 2032F |
9.2 Qatar Alcohols and Epoxides Market Opportunity Assessment, By Epoxides, 2022 & 2032F |
9.3 Qatar Alcohols and Epoxides Market Opportunity Assessment, By Alcohols Type, 2022 & 2032F |
9.4 Qatar Alcohols and Epoxides Market Opportunity Assessment, By Applications, 2022 & 2032F |
10 Qatar Alcohols and Epoxides Market - Competitive Landscape |
10.1 Qatar Alcohols and Epoxides Market Revenue Share, By Companies, 2025 |
10.2 Qatar Alcohols and Epoxides Market Competitive Benchmarking, By Operating and Technical Parameters |
11 Company Profiles |
12 Recommendations |
13 Disclaimer |
Global Go To Market Strategy - 2030
Export potential enables firms to identify high-growth global markets with greater confidence by combining advanced trade intelligence with a structured quantitative methodology. The framework analyzes emerging demand trends and country-level import patterns while integrating macroeconomic and trade datasets such as GDP and population forecasts, bilateral import–export flows, tariff structures, elasticity differentials between developed and developing economies, geographic distance, and import demand projections. Using weighted trade values from 2020–2024 as the base period to project country-to-country export potential for 2030, these inputs are operationalized through calculated drivers such as gravity model parameters, tariff impact factors, and projected GDP per-capita growth. Through an analysis of hidden potentials, demand hotspots, and market conditions that are most favorable to success, this method enables firms to focus on target countries, maximize returns, and global expansion with data, backed by accuracy.
By factoring in the projected importer demand gap that is currently unmet and could be potential opportunity, it identifies the potential for the Exporter (Country) among 190 countries, against the general trade analysis, which identifies the biggest importer or exporter.
To discover high-growth global markets and optimize your business strategy:
Click Here
Pricing
- Single User License$ 1,995
- Department License$ 2,400
- Site License$ 3,120
- Global License$ 3,795

Leadership Perspectives from Industry Events
Search
Thought Leadership and Analyst Meet


Our Clients
6WResearch In News
- India Air Conditioner Market Set for Strong Rebound in 2026 After Weather-Led Correction and GST-Driven Recovery: 6Wresearch
- ADAS in India: How Automatic Emergency Braking, Blind Spot Detection & Driver Monitoring are Transforming Road Safety
- Doha a strategic location for EV manufacturing hub: IPA Qatar
- Demand for luxury TVs surging in the GCC, says Samsung
- Empowering Growth: The Thriving Journey of Bangladesh’s Cable Industry
- Demand for luxury TVs surging in the GCC, says Samsung
Latest Reports
- Nicaragua RPG Gaming Market (2026-2032)
- New Zealand RPG Gaming Market (2026-2032)
- Netherlands RPG Gaming Market (2026-2032)
- Nauru RPG Gaming Market (2026-2032)
- Namibia RPG Gaming Market (2026-2032)
- Mozambique RPG Gaming Market (2026-2032)
- Montenegro RPG Gaming Market (2026-2032)
- Mongolia RPG Gaming Market (2026-2032)
- Monaco RPG Gaming Market (2026-2032)
- Micronesia RPG Gaming Market (2026-2032)
Industry Events and Analyst Meet

HIMTEX 2026

India Refining Summit 2026

India EV Show 2026

EV tech India Expo 2026

Auto Tech Asia 2026
Whitepaper
- Middle East & Africa Commercial Security Market Click here to view more.
- Middle East & Africa Fire Safety Systems & Equipment Market Click here to view more.
- GCC Drone Market Click here to view more.
- Middle East Lighting Fixture Market Click here to view more.
- GCC Physical & Perimeter Security Market Click here to view more.