Qatar Cable Assemblies Market (2026-2032) | Companies, Revenue, Value, Share, Analysis, Industry, Forecast, Size, Outlook, Trends & Growth
Market Forecast By Product (Custom/Application Specific assemblies, Rectangular assemblies, Radio frequency (RF) assemblies, Circular assemblies, Fiber optics assemblies, Printed circuit board (PCB) assemblies, Others), By Application (Automotive, Telecom, Computers and peripherals, Industrial, Military & Aerospace, Medical, Others) And Competitive Landscape
| Product Code: ETC032641 | Publication Date: Jul 2023 | Updated Date: Jun 2026 | Product Type: Report | |
| Publisher: 6Wresearch | Author: Ravi Bhandari | No. of Pages: 70 | No. of Figures: 35 | No. of Tables: 5 |
Qatar Cable Assemblies Market Summary
The qatar cable assemblies market was estimated at USD 407 Million in 2025 and is projected to reach USD 549 Million by 2032, growing at a CAGR of 4.9% from 2026 to 2032.
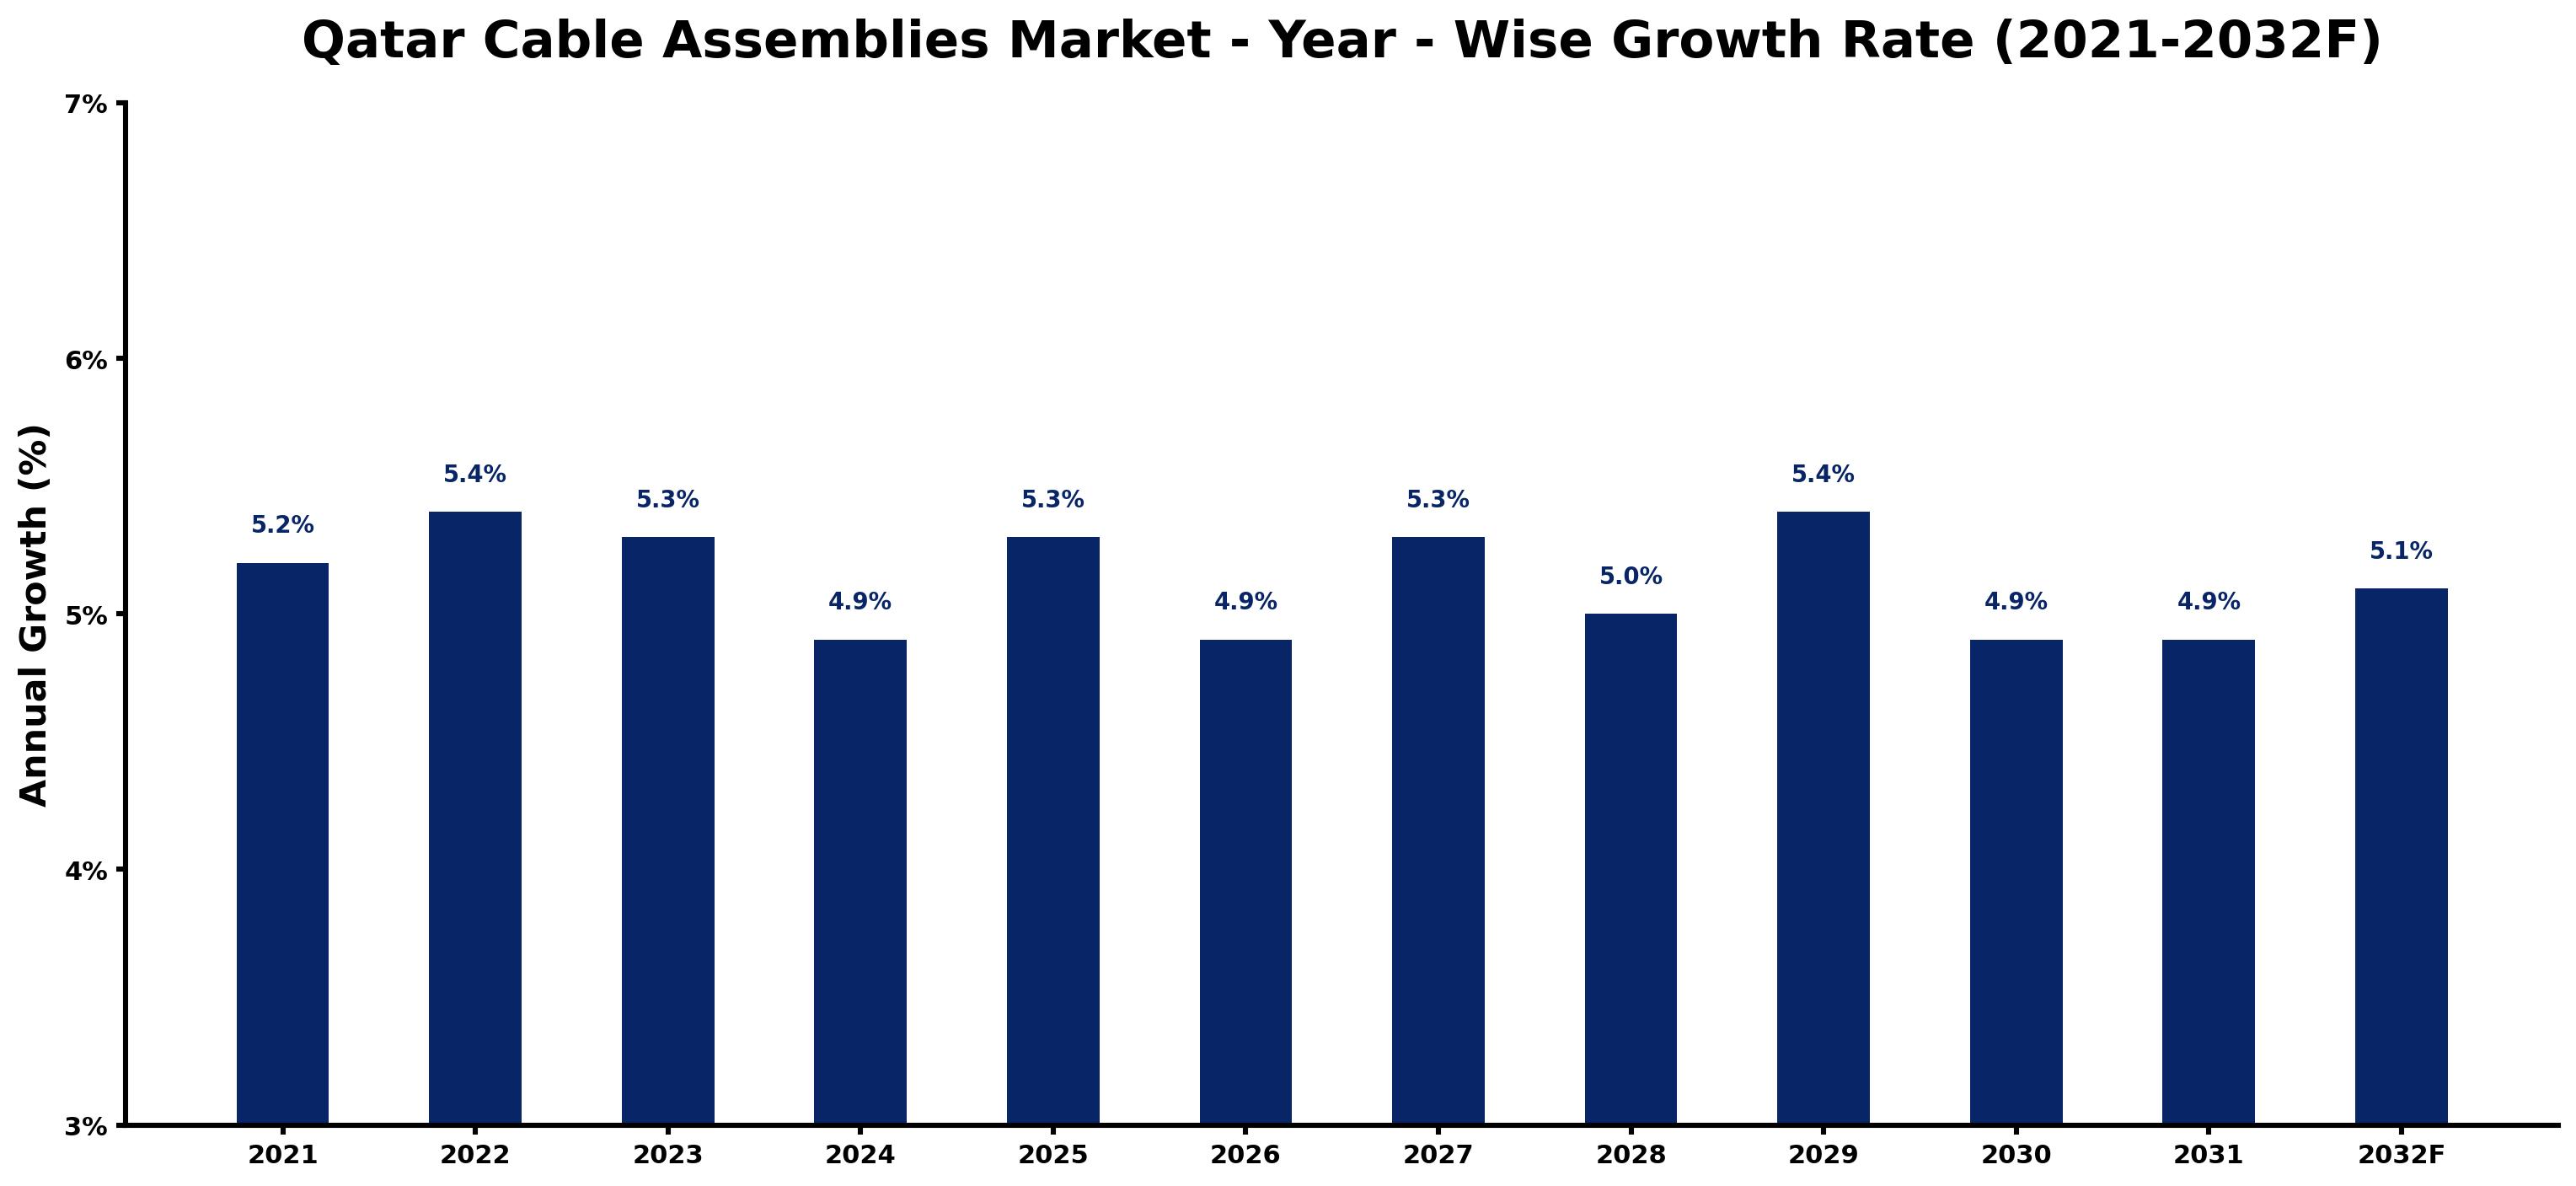
Qatar Cable Assemblies Market Growth Rate Analysis (2021-2032)
The Qatar cable assemblies market has experienced a stable performance over the past few years, reflecting a steady growth rate that peaked at 5.4% in 2022. This uptick can be attributed to increased investments in infrastructure and energy transition projects, as Qatar continues to diversify its economy away from oil dependency. Although growth moderated to 5.3% in 2023 and further fluctuated around 4.9% to 5.4% through 2031, demand remains robust, driven by advancements in digitalization and rising consumer expectations. Factors such as ongoing technological innovations and supportive governmental policies are expected to sustain the market's resilience, even amid slight annual fluctuations.
Qatar Cable Assemblies Market Year-wise Growth Rate and Key Drivers
This graph highlights how the Qatar Cable Assemblies Market has steadily grown over the past five years, supported by major growth factors.
The table below presents the year‑wise growth rates along with the key drivers influencing the market
| Year | Growth Rate | Major Drivers |
| 2021 | 5.2% | Post-lockdown retail projects contributed to a robust demand for reliable cable assemblies. |
| 2022 | 5.4% | Construction expansion in Qatar's infrastructure translated into increased cable assembly requirements. |
| 2023 | 5.3% | Corporate investments in high-tech facilities boosted the need for specialized cable solutions. |
| 2024 | 4.9% | Emerging trends in smart buildings created new opportunities for advanced cable technologies. |
| 2025 | 5.3% | Local production initiatives aimed to enhance supply chain resilience and reduce costs. |
| 2026 | 4.9% | Sustainability concerns prompted a shift towards eco-friendly cable materials in manufacturing. |
| 2027 | 5.3% | Regional energy diversification efforts focused on upgrading outdated electrical grid systems. |
| 2028 | 5.0% | Innovations in renewable energy technologies generated demand for efficient cable assemblies. |
| 2029 | 5.4% | Infrastructure upgrades for the FIFA World Cup spurred temporary spikes in cable demand. |
| 2030 | 4.9% | Technological advancements in telecom services significantly impacted cable assembly specifications. |
| 2031 | 4.9% | Smart city projects necessitated customized cable solutions for integrated urban development. |
| 2032 | 5.1% | Integration of IoT technologies pushed for higher-performance cable assemblies across sectors. |
Note - Market size estimations and growth projections presented in this report are based on 6Wresearch’s advanced forecasting approach, validated with industry datasets as of June 2026.
Qatar Cable Assemblies Market Synopsis
The Qatar Cable Assemblies Market is projected to reach 5.1% and witness significant growth during the forecast period (2026-2032). This market is anticipated to achieve a compound annual growth rate (CAGR) of 8.8%, driven largely by several key factors including the rising number of data centers, substantial investments in smart city initiatives, and ongoing construction projects within the region. Additionally, an increasing demand for renewable energy solutions is further stimulating the expansion of cable assembly applications in Qatar.
Qatar Cable Assemblies Market Growth Drivers
The drivers behind growth in the Qatar Cable Assemblies Market are multifaceted and stem from both private sector initiatives and government policies. Key growth drivers include:
- The Qatar National Vision 2031 underscores government efforts towards developing smart cities, which has encouraged the adoption of advanced cable assembly solutions across various sectors.
- An increase in infrastructure developments, including large-scale projects such as Lusail City and the Ras Abu Aboud Stadium, significantly contributes to the demand for robust cabling solutions.
- A surge in data-driven industries necessitates the proliferation of high-capacity data centers, further driving the cable assemblies market as these facilities require extensive cabling for optimized operations.
- The growing emphasis on renewable energy projects prompts investment in cabling solutions that are essential for energy transmission and distribution.
- The increasing integration of advanced technologies such as IoT and automation in sectors such as healthcare and transportation creates a pressing need for high-quality cable assemblies.
Qatar Cable Assemblies Market Challenges and Restraints
Despite the positive outlook, the Qatar Cable Assemblies Market faces several challenges that could impede its growth. These challenges include:
- High initial costs associated with the installation and maintenance of cable assemblies can deter many businesses from investing in these solutions.
- The technical complexities involved in integrating modern cable technology can lead to delays and increased costs, affecting market dynamics.
- The recent economic impacts from the COVID-19 pandemic have slowed production capacities and disrupted supply chains, contributing to uncertainty within the market.
- Regulatory challenges can arise as standards for cable assemblies evolve, leading to increased compliance costs for manufacturers and suppliers.
- The competitive landscape within the region, characterized by numerous players, can lead to price wars that may affect profitability for companies involved in the cable assemblies market.
Qatar Cable Assemblies Market Government Investment and Initiatives
The government of Qatar has been proactive in promoting the cable assemblies market through various investment and development initiatives. Major factors influencing government support include:
- The implementation of the Qatar National Vision 2031, which aims at transforming the nation into a sustainable economy, encourages investments in infrastructure and modern technologies.
- Public spending on infrastructure, particularly in sectors like healthcare and transportation, presents opportunities for enhanced cable assemblies that meet the latest technological standards.
- Government initiatives have led to the establishment of regulations that promote the use of energy-efficient and sustainable cable systems, creating a favorable environment for market growth.
- Incentives provided for smart city projects encourage private sector participation in the development of advanced cabling solutions.
- Collaboration between government entities and the private sector facilitates research and development efforts aimed at enhancing the quality and efficiency of cable assemblies.
Qatar Cable Assemblies Market Latest Developments (May 2025 - June 2026)
In the recent period leading up to mid-2026, the Qatar Cable Assemblies Market has experienced several noteworthy developments. The trends indicate a shift in industry direction, marked by:
- An increased focus on developing eco-friendly cable solutions, aligning with global sustainability goals and local environmental policies.
- Innovations in cable technology, particularly in the area of high-speed data transmission, have emerged as critical advancements catering to demand from expanding data center infrastructures.
- Strengthening partnerships between local manufacturers and international technology providers to enhance the quality of cable assemblies available in the market.
- Growing engagements in various trade exhibitions and conferences aimed at showcasing cutting-edge cable assembly technologies and establishing networking opportunities within the industry.
- A notable recovery in the production capabilities post-COVID-19, as manufacturers adapt to new operational norms and improve supply chain resilience.
Qatar Cable Assemblies Market - Key Attractiveness of the Report
- 10 Years of Market Numbers
- Historical Data Starting from 2022 to 2025
- Base Year: 2025
- Forecast Data until 2032
- Key Performance Indicators Impacting the Market
- Major Upcoming Developments and Projects
Key Highlights of the Report:
- Qatar Cable Assemblies Market Outlook
- Market Size of Qatar Cable Assemblies Market, 2025
- Forecast of Qatar Cable Assemblies Market, 2032
- Historical Data and Forecast of Qatar Cable Assemblies Revenues & Volume for the Period 2022-2032F
- Qatar Cable Assemblies Market Trend Evolution
- Qatar Cable Assemblies Market Drivers and Challenges
- Qatar Cable Assemblies Price Trends
- Qatar Cable Assemblies Porter's Five Forces
- Qatar Cable Assemblies Industry Life Cycle
- Historical Data and Forecast of Qatar Cable Assemblies Market Revenues & Volume By Product for the Period 2022-2032F
- Historical Data and Forecast of Qatar Cable Assemblies Market Revenues & Volume By Custom/Application Specific assemblies for the Period 2022-2032F
- Historical Data and Forecast of Qatar Cable Assemblies Market Revenues & Volume By Rectangular assemblies for the Period 2022-2032F
- Historical Data and Forecast of Qatar Cable Assemblies Market Revenues & Volume By Radio frequency (RF) assemblies for the Period 2022-2032F
- Historical Data and Forecast of Qatar Cable Assemblies Market Revenues & Volume By Circular assemblies for the Period 2022-2032F
- Historical Data and Forecast of Qatar Cable Assemblies Market Revenues & Volume By Fiber optics assemblies for the Period 2022-2032F
- Historical Data and Forecast of Qatar Cable Assemblies Market Revenues & Volume By Printed circuit board (PCB) assemblies for the Period 2022-2032F
- Historical Data and Forecast of Qatar Cable Assemblies Market Revenues & Volume By Others for the Period 2022-2032F
- Historical Data and Forecast of Qatar Cable Assemblies Market Revenues & Volume By Application for the Period 2022-2032F
- Historical Data and Forecast of Qatar Cable Assemblies Market Revenues & Volume By Automotive for the Period 2022-2032F
- Historical Data and Forecast of Qatar Cable Assemblies Market Revenues & Volume By Telecom for the Period 2022-2032F
- Historical Data and Forecast of Qatar Cable Assemblies Market Revenues & Volume By Computers and peripherals for the Period 2022-2032F
- Historical Data and Forecast of Qatar Cable Assemblies Market Revenues & Volume By Industrial for the Period 2022-2032F
- Historical Data and Forecast of Qatar Cable Assemblies Market Revenues & Volume By Military & Aerospace for the Period 2022-2032F
- Historical Data and Forecast of Qatar Cable Assemblies Market Revenues & Volume By Medical for the Period 2022-2032F
- Historical Data and Forecast of Qatar Cable Assemblies Market Revenues & Volume By Others for the Period 2022-2032F
- Qatar Cable Assemblies Import Export Trade Statistics
- Market Opportunity Assessment By Product
- Market Opportunity Assessment By Application
- Qatar Cable Assemblies Top Companies Market Share
- Qatar Cable Assemblies Competitive Benchmarking By Technical and Operational Parameters
- Qatar Cable Assemblies Company Profiles
- Qatar Cable Assemblies Key Strategic Recommendations
Frequently Asked Questions About the Market Study (FAQs):
The growth is primarily driven by the increasing number of data centers, government initiatives like the Qatar National Vision 2031, and investments in smart city projects.
Key challenges include high installation costs, regulatory complexities, and the impact of the COVID-19 pandemic on supply chains.
The government promotes market growth through investments in infrastructure, incentives for energy-efficient solutions, and initiatives supporting smart city development.
Recent trends include a focus on eco-friendly products, innovations in high-speed cable technology, and stronger collaborations between local and international firms.
6Wresearch actively monitors the Qatar Cable Assemblies Market and publishes its comprehensive annual report, highlighting emerging trends, growth drivers, revenue analysis, and forecast outlook. Our insights help businesses to make data-backed strategic decisions with ongoing market dynamics. Our analysts track relevent industries related to the Qatar Cable Assemblies Market, allowing our clients with actionable intelligence and reliable forecasts tailored to emerging regional needs.
Yes, we provide customisation as per your requirements. To learn more, feel free to contact us on sales@6wresearch.com
1 Executive Summary |
2 Introduction |
2.1 Key Highlights of the Report |
2.2 Report Description |
2.3 Market Scope & Segmentation |
2.4 Research Methodology |
2.5 Assumptions |
3 Qatar Cable Assemblies Market Overview |
3.1 Qatar Country Macro Economic Indicators |
3.2 Qatar Cable Assemblies Market Revenues & Volume, 2022 & 2032F |
3.3 Qatar Cable Assemblies Market - Industry Life Cycle |
3.4 Qatar Cable Assemblies Market - Porter's Five Forces |
3.5 Qatar Cable Assemblies Market Revenues & Volume Share, By Product, 2022 & 2032F |
3.6 Qatar Cable Assemblies Market Revenues & Volume Share, By Application, 2022 & 2032F |
4 Qatar Cable Assemblies Market Dynamics |
4.1 Impact Analysis |
4.2 Market Drivers |
4.3 Market Restraints |
5 Qatar Cable Assemblies Market Trends |
6 Qatar Cable Assemblies Market, By Types |
6.1 Qatar Cable Assemblies Market, By Product |
6.1.1 Overview and Analysis |
6.1.2 Qatar Cable Assemblies Market Revenues & Volume, By Product, 2022-2032F |
6.1.3 Qatar Cable Assemblies Market Revenues & Volume, By Custom/Application Specific assemblies, 2022-2032F |
6.1.4 Qatar Cable Assemblies Market Revenues & Volume, By Rectangular assemblies, 2022-2032F |
6.1.5 Qatar Cable Assemblies Market Revenues & Volume, By Radio frequency (RF) assemblies, 2022-2032F |
6.1.6 Qatar Cable Assemblies Market Revenues & Volume, By Circular assemblies, 2022-2032F |
6.1.7 Qatar Cable Assemblies Market Revenues & Volume, By Fiber optics assemblies, 2022-2032F |
6.1.8 Qatar Cable Assemblies Market Revenues & Volume, By Printed circuit board (PCB) assemblies, 2022-2032F |
6.2 Qatar Cable Assemblies Market, By Application |
6.2.1 Overview and Analysis |
6.2.2 Qatar Cable Assemblies Market Revenues & Volume, By Automotive, 2022-2032F |
6.2.3 Qatar Cable Assemblies Market Revenues & Volume, By Telecom, 2022-2032F |
6.2.4 Qatar Cable Assemblies Market Revenues & Volume, By Computers and peripherals, 2022-2032F |
6.2.5 Qatar Cable Assemblies Market Revenues & Volume, By Industrial, 2022-2032F |
6.2.6 Qatar Cable Assemblies Market Revenues & Volume, By Military & Aerospace, 2022-2032F |
6.2.7 Qatar Cable Assemblies Market Revenues & Volume, By Medical, 2022-2032F |
7 Qatar Cable Assemblies Market Import-Export Trade Statistics |
7.1 Qatar Cable Assemblies Market Export to Major Countries |
7.2 Qatar Cable Assemblies Market Imports from Major Countries |
8 Qatar Cable Assemblies Market Key Performance Indicators |
9 Qatar Cable Assemblies Market - Opportunity Assessment |
9.1 Qatar Cable Assemblies Market Opportunity Assessment, By Product, 2022 & 2032F |
9.2 Qatar Cable Assemblies Market Opportunity Assessment, By Application, 2022 & 2032F |
10 Qatar Cable Assemblies Market - Competitive Landscape |
10.1 Qatar Cable Assemblies Market Revenue Share, By Companies, 2025 |
10.2 Qatar Cable Assemblies Market Competitive Benchmarking, By Operating and Technical Parameters |
11 Company Profiles |
12 Recommendations |
13 Disclaimer |
Global Go To Market Strategy - 2030
Export potential enables firms to identify high-growth global markets with greater confidence by combining advanced trade intelligence with a structured quantitative methodology. The framework analyzes emerging demand trends and country-level import patterns while integrating macroeconomic and trade datasets such as GDP and population forecasts, bilateral import–export flows, tariff structures, elasticity differentials between developed and developing economies, geographic distance, and import demand projections. Using weighted trade values from 2020–2024 as the base period to project country-to-country export potential for 2030, these inputs are operationalized through calculated drivers such as gravity model parameters, tariff impact factors, and projected GDP per-capita growth. Through an analysis of hidden potentials, demand hotspots, and market conditions that are most favorable to success, this method enables firms to focus on target countries, maximize returns, and global expansion with data, backed by accuracy.
By factoring in the projected importer demand gap that is currently unmet and could be potential opportunity, it identifies the potential for the Exporter (Country) among 190 countries, against the general trade analysis, which identifies the biggest importer or exporter.
To discover high-growth global markets and optimize your business strategy:
Click Here
Pricing
- Single User License$ 1,995
- Department License$ 2,400
- Site License$ 3,120
- Global License$ 3,795

Leadership Perspectives from Industry Events
Search
Thought Leadership and Analyst Meet


Our Clients
6WResearch In News
- Doha a strategic location for EV manufacturing hub: IPA Qatar
- Demand for luxury TVs surging in the GCC, says Samsung
- Empowering Growth: The Thriving Journey of Bangladesh’s Cable Industry
- Demand for luxury TVs surging in the GCC, says Samsung
- Video call with a traditional healer? Once unthinkable, it’s now common in South Africa
- Intelligent Buildings To Smooth GCC’s Path To Net Zero
Latest Reports
- Taiwan Airport Wireless Infrastructure Market (2026-2032)
- Vietnam Airport Wireless Infrastructure Market (2026-2032)
- Thailand Airport Wireless Infrastructure Market (2026-2032)
- South Korea Airport Wireless Infrastructure Market (2026-2032)
- Romania Airport Wireless Infrastructure Market (2026-2032)
- Qatar Airport Wireless Infrastructure Market (2026-2032)
- Philippines Airport Wireless Infrastructure Market (2026-2032)
- Japan Airport Wireless Infrastructure Market (2026-2032)
- Taiwan Airport Winter Services Market (2026-2032)
- Vietnam Airport Winter Services Market (2026-2032)
Industry Events and Analyst Meet

HIMTEX 2026

India Refining Summit 2026

India EV Show 2026

EV tech India Expo 2026

Auto Tech Asia 2026
Whitepaper
- Middle East & Africa Commercial Security Market Click here to view more.
- Middle East & Africa Fire Safety Systems & Equipment Market Click here to view more.
- GCC Drone Market Click here to view more.
- Middle East Lighting Fixture Market Click here to view more.
- GCC Physical & Perimeter Security Market Click here to view more.