Qatar Dosing System Market (2026-2032) | Forecast, Growth, Trends, Analysis, Revenue, Outlook, Companies, Industry, Share, Value & Size
Market Forecast By Technology Type (Diaphragm, Plunger/Piston, Cavity, Peristaltic, Others), By Application (Water Treatment, Power Generation, Oil & Gas, Chemical Processes, Food & Beverages, Others) And Competitive Landscape
| Product Code: ETC034621 | Publication Date: Jul 2023 | Updated Date: Jun 2026 | Product Type: Report | |
| Publisher: 6Wresearch | Author: Ravi Bhandari | No. of Pages: 70 | No. of Figures: 35 | No. of Tables: 5 |
Qatar Dosing System Market Summary
The qatar dosing system market was estimated at USD 377 Million in 2025 and is projected to reach USD 513 Million by 2032, growing at a CAGR of 5.0% from 2026 to 2032.
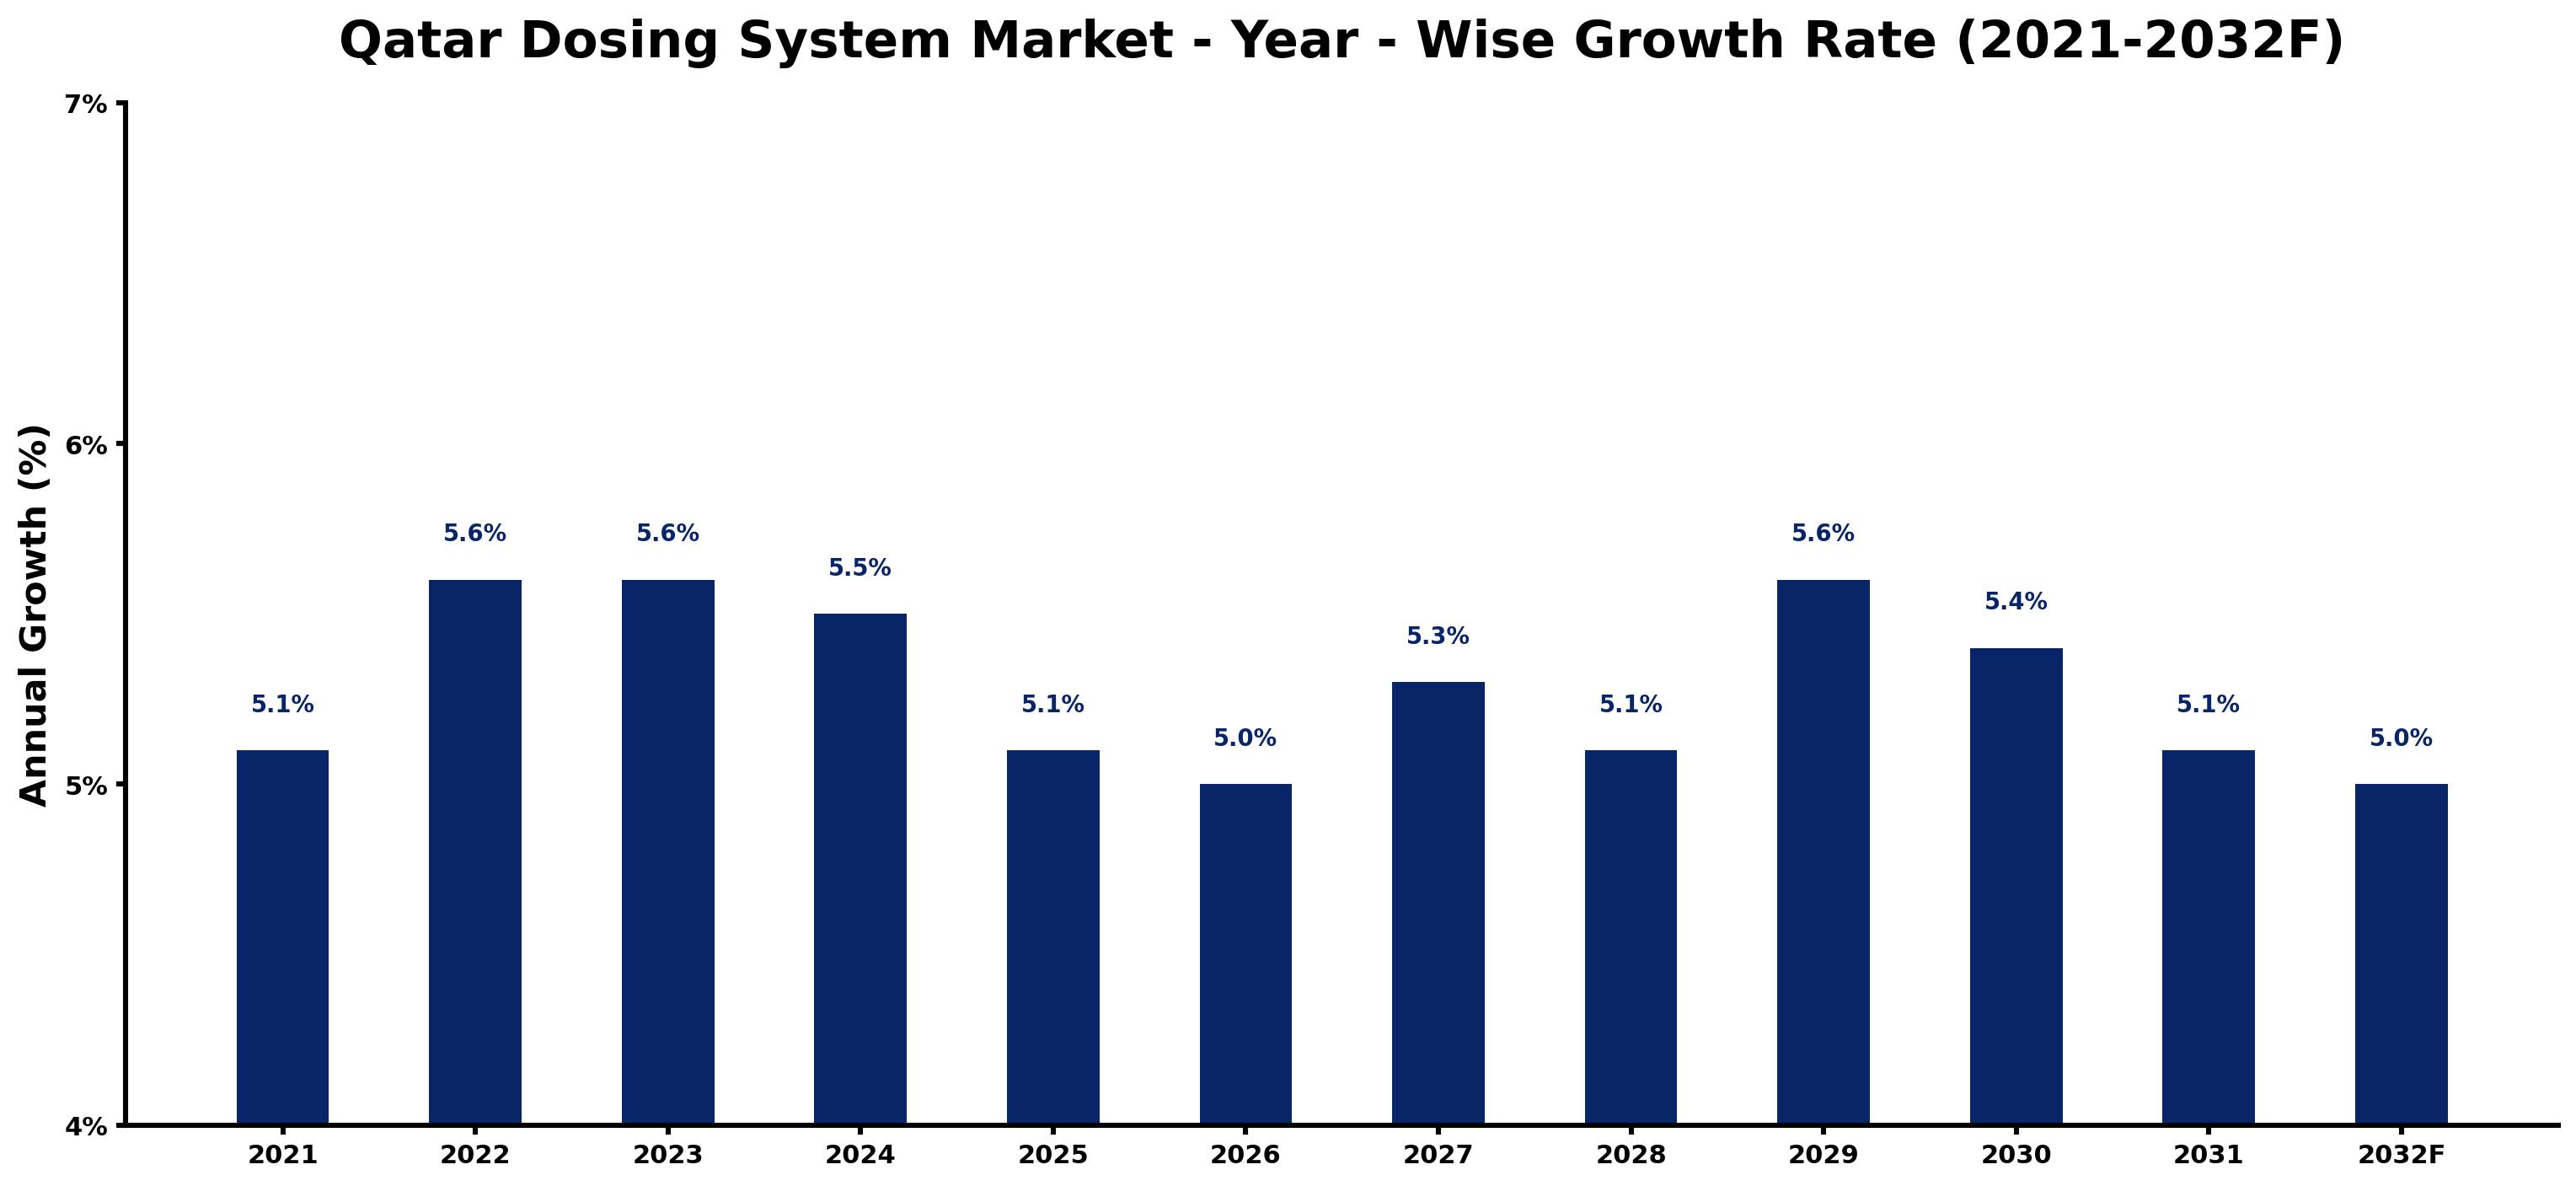
Qatar Dosing System Market Growth Rate Analysis (2021-2032)
The Qatar Dosing System market has exhibited steady growth, with a projected increase of 5.5% in 2024, following 5.6% in both 2022 and 2023, and expected fluctuations tapering to 5.1% by 2031. Key drivers include rising consumer demand for precision in industrial processes and significant investments in infrastructure as part of Qatar's broader economic diversification efforts. The push towards energy transition and digitalization further supports this growth, enhancing operational efficiencies. Although slight declines are anticipated in some years, such as 5.0% in 2025 and 2032, the overall market remains resilient, reflecting stable demand amid evolving technological landscapes and policy support for sustainable practices.
Qatar Dosing System Market Year-wise Growth Rate and Key Drivers
This graph highlights how the Qatar Dosing System Market has steadily grown over the past five years, supported by major growth factors.
The table below presents the year‑wise growth rates along with the key drivers influencing the market
| Year | Growth Rate | Major Drivers |
| 2021 | 5.1% | Post-lockdown retail projects emphasized the need for efficient dosing solutions. |
| 2022 | 5.6% | Legacy systems faced challenges, pushing companies to seek modern alternatives. |
| 2023 | 5.6% | Corporate sustainability goals increasingly highlighted the importance of precise dosing. |
| 2024 | 5.5% | Construction projects surged, creating demand for advanced fluid management technologies. |
| 2025 | 5.1% | Local manufacturers began investing in automation to enhance production capabilities. |
| 2026 | 5.0% | Qatar's hosting of major events accelerated infrastructure upgrades and related dosing needs. |
| 2027 | 5.3% | Rising interest in smart technologies prompted upgrades in existing dosing systems. |
| 2028 | 5.1% | Companies focused on reducing waste, leading to innovations in dosing efficiency. |
| 2029 | 5.6% | Emerging industries in Qatar required specialized dosing solutions for unique applications. |
| 2030 | 5.4% | GCC collaborations fostered knowledge sharing, driving technology advancements in dosing. |
| 2031 | 5.1% | Increased regional competition pushed firms to enhance product offerings and services. |
| 2032 | 5.0% | Investment in research and development solidified Qatar's position in the dosing market. |
Note - Market size estimations and growth projections presented in this report are based on 6Wresearch’s advanced forecasting approach, validated with industry datasets as of June 2026.
Qatar Dosing System Market Synopsis
The Qatar Dosing System Market is projected to reach 5.0% and witness significant growth during the forecast period (2026-2032). This growth is primarily fueled by substantial investments in infrastructure and water treatment projects, leading to an increased demand for advanced dosing system technologies. In addition, the rapid urbanization and industrial expansion across various sectors, including oil & gas, manufacturing, food & beverage, power generation, chemicals, and pharmaceuticals, are further propelling the market.
Qatar Dosing System Market Growth Drivers
Several factors are driving the growth of the Qatar dosing system market. The government's initiatives aimed at efficient resource management and enhanced wastewater treatment systems play a critical role. These initiatives encourage industries to adopt modern dosing solutions, which promote sustainability and operational efficiency.
- One of the primary growth drivers is the increasing emphasis on environmental regulations, which mandates organizations to comply with stringent standards. As a result, many industries are investing in automated dosing systems that offer precise control over chemical usage.
- Technological advancements in dosing systems are enabling improved process efficiencies. These innovations allow for better accuracy in chemical measurement, making them essential in applications like cooling towers and process water purification.
- Infrastructure development, supported by government policies, is significantly contributing to market growth. Major projects in sectors such as water treatment are creating opportunities for new advancements in dosing technology.
- The industrialization in Qatar, particularly in sectors such as oil & gas and power generation, is increasing the demand for effective chemical dosing solutions. This trend underscores the importance of these systems in optimizing operational processes.
- Investment from local players seeking to enhance their operational capabilities by incorporating advanced dosing systems is also bolstering market growth. Their commitment to embracing technology is likely to lead to significant advancements within this market.
Qatar Dosing System Market Challenges and Restraints
Despite the positive growth trajectory, the Qatar dosing system market faces significant challenges. One of the key obstacles is the high cost associated with the installation and setup of dosing systems. This can deter small-scale industries and startups that operate on tight budgets from adopting these essential technologies.
- Small businesses may struggle to justify the initial investment in a sophisticated dosing system due to their limited financial resources. This could hinder growth opportunities within the market.
- There is also the challenge of integrating new dosing technologies into existing systems. Industries may face difficulties in retrofitting or upgrading their processes, which might slow down adoption rates.
- Market volatility, driven by fluctuating commodity prices and economic uncertainties, poses further challenges. Such instability can impact investment decisions and the market's overall growth potential.
- The complexity of regulatory compliance can also deter companies from investing in advanced dosing systems, as they may require exhaustive understanding and adherence to ever-evolving standards.
- Supply chain disruptions, particularly in the aftermath of the COVID-19 pandemic, may hinder the timely availability of necessary components and materials for dosing systems, further complicating market dynamics.
Qatar Dosing System Market Government Investment and Initiatives
The Qatari government has taken significant strides to enhance its infrastructure and environmental management systems, which directly impact the dosing system market. Investments and initiatives are geared toward modernizing water treatment facilities and supporting sustainable industrial practices.
- The government's commitment to enhancing wastewater management is evident through funding allocated for infrastructure improvements, which is expected to drive demand for dosing systems.
- Sustainability initiatives are being prioritized, with policies aimed at reducing water wastage and improving resource management. This regulatory environment is conducive to the adoption of innovative dosing technologies.
- Public spending on environmental projects has increased, which is likely to create a favorable market landscape for advanced dosing systems in the upcoming years.
- The government is actively promoting partnerships between public and private sectors to foster innovation in water treatment technologies, including dosing systems, thereby enhancing the overall market landscape.
- National development plans are focused on diversifying the economy, with a strong emphasis on industrial growth, which contributes to increased demand for dosing systems across multiple sectors.
Qatar Dosing System Market Latest Developments (May 2025 - June 2026)
The period from May 2025 to June 2026 has witnessed significant developments in the Qatar dosing system market as industries adapt to evolving demands. Organizations are increasingly focused on enhancing operational efficiency through modernization of chemical dosing processes.
- Many companies have begun to implement advanced automated dosing systems to improve precision and reliability, aligning with global best practices in chemical management.
- Research and development efforts have increased, allowing for innovations that cater to specific industrial needs and compliance with environmental regulations.
- The impact of global supply chains has continued to be felt, with businesses strategically enhancing their inventories to mitigate risks related to material shortages.
- Additionally, training and workforce development are gaining importance as industries recognize the need for skilled personnel to operate advanced dosing systems efficiently.
- Collaboration between technology providers and end-users has fostered a more integrated approach to addressing challenges in chemical dosing, paving the way for future partnerships and innovations.
Qatar Dosing System Market - Key Attractiveness of the Report
- 10 Years of Market Numbers
- Historical Data Starting from 2022 to 2025
- Base Year: 2025
- Forecast Data until 2032
- Key Performance Indicators Impacting the Market
- Major Upcoming Developments and Projects
Dosing systems are primarily applied in industries such as oil & gas, manufacturing, food & beverage, power generation, chemicals, and pharmaceuticals for precise chemical management in various processes.
Key Highlights of the Report:
- Qatar Dosing System Market Outlook
- Market Size of Qatar Dosing System Market, 2025
- Forecast of Qatar Dosing System Market, 2032
- Historical Data and Forecast of Qatar Dosing System Revenues & Volume for the Period 2022-2032F
- Qatar Dosing System Market Trend Evolution
- Qatar Dosing System Market Drivers and Challenges
- Qatar Dosing System Price Trends
- Qatar Dosing System Porter's Five Forces
- Qatar Dosing System Industry Life Cycle
- Historical Data and Forecast of Qatar Dosing System Market Revenues & Volume By Technology Type for the Period 2022-2032F
- Historical Data and Forecast of Qatar Dosing System Market Revenues & Volume By Diaphragm for the Period 2022-2032F
- Historical Data and Forecast of Qatar Dosing System Market Revenues & Volume By Plunger/Piston for the Period 2022-2032F
- Historical Data and Forecast of Qatar Dosing System Market Revenues & Volume By Cavity for the Period 2022-2032F
- Historical Data and Forecast of Qatar Dosing System Market Revenues & Volume By Peristaltic for the Period 2022-2032F
- Historical Data and Forecast of Qatar Dosing System Market Revenues & Volume By Others for the Period 2022-2032F
- Historical Data and Forecast of Qatar Dosing System Market Revenues & Volume By Application for the Period 2022-2032F
- Historical Data and Forecast of Qatar Dosing System Market Revenues & Volume By Water Treatment for the Period 2022-2032F
- Historical Data and Forecast of Qatar Dosing System Market Revenues & Volume By Power Generation for the Period 2022-2032F
- Historical Data and Forecast of Qatar Dosing System Market Revenues & Volume By Oil & Gas for the Period 2022-2032F
- Historical Data and Forecast of Qatar Dosing System Market Revenues & Volume By Chemical Processes for the Period 2022-2032F
- Historical Data and Forecast of Qatar Dosing System Market Revenues & Volume By Food & Beverages for the Period 2022-2032F
- Historical Data and Forecast of Qatar Dosing System Market Revenues & Volume By Others for the Period 2022-2032F
- Qatar Dosing System Import Export Trade Statistics
- Market Opportunity Assessment By Technology Type
- Market Opportunity Assessment By Application
- Qatar Dosing System Top Companies Market Share
- Qatar Dosing System Competitive Benchmarking By Technical and Operational Parameters
- Qatar Dosing System Company Profiles
- Qatar Dosing System Key Strategic Recommendations
Frequently Asked Questions About the Market Study (FAQs):
Dosing systems are primarily applied in industries such as oil & gas, manufacturing, food & beverage, power generation, chemicals, and pharmaceuticals for precise chemical management in various processes.
The Qatari government supports the dosing system market through investments in infrastructure development and initiatives aimed at improving water management and environmental sustainability.
Small businesses often face challenges related to the high setup costs of dosing systems, which may hinder their ability to adopt advanced technologies due to budget constraints.
The COVID-19 pandemic initially disrupted supply chains and impacted consumption levels across industries; however, the recovery phase is focusing on modernization and efficiency improvements, which is beneficial for the dosing system market.
6Wresearch actively monitors the Qatar Dosing System Market and publishes its comprehensive annual report, highlighting emerging trends, growth drivers, revenue analysis, and forecast outlook. Our insights help businesses to make data-backed strategic decisions with ongoing market dynamics. Our analysts track relevent industries related to the Qatar Dosing System Market, allowing our clients with actionable intelligence and reliable forecasts tailored to emerging regional needs.
Yes, we provide customisation as per your requirements. To learn more, feel free to contact us on sales@6wresearch.com
1 Executive Summary |
2 Introduction |
2.1 Key Highlights of the Report |
2.2 Report Description |
2.3 Market Scope & Segmentation |
2.4 Research Methodology |
2.5 Assumptions |
3 Qatar Dosing System Market Overview |
3.1 Qatar Country Macro Economic Indicators |
3.2 Qatar Dosing System Market Revenues & Volume, 2022 & 2032F |
3.3 Qatar Dosing System Market - Industry Life Cycle |
3.4 Qatar Dosing System Market - Porter's Five Forces |
3.5 Qatar Dosing System Market Revenues & Volume Share, By Technology Type, 2022 & 2032F |
3.6 Qatar Dosing System Market Revenues & Volume Share, By Application, 2022 & 2032F |
4 Qatar Dosing System Market Dynamics |
4.1 Impact Analysis |
4.2 Market Drivers |
4.3 Market Restraints |
5 Qatar Dosing System Market Trends |
6 Qatar Dosing System Market, By Types |
6.1 Qatar Dosing System Market, By Technology Type |
6.1.1 Overview and Analysis |
6.1.2 Qatar Dosing System Market Revenues & Volume, By Technology Type, 2022-2032F |
6.1.3 Qatar Dosing System Market Revenues & Volume, By Diaphragm, 2022-2032F |
6.1.4 Qatar Dosing System Market Revenues & Volume, By Plunger/Piston, 2022-2032F |
6.1.5 Qatar Dosing System Market Revenues & Volume, By Cavity, 2022-2032F |
6.1.6 Qatar Dosing System Market Revenues & Volume, By Peristaltic, 2022-2032F |
6.1.7 Qatar Dosing System Market Revenues & Volume, By Others, 2022-2032F |
6.2 Qatar Dosing System Market, By Application |
6.2.1 Overview and Analysis |
6.2.2 Qatar Dosing System Market Revenues & Volume, By Water Treatment, 2022-2032F |
6.2.3 Qatar Dosing System Market Revenues & Volume, By Power Generation, 2022-2032F |
6.2.4 Qatar Dosing System Market Revenues & Volume, By Oil & Gas, 2022-2032F |
6.2.5 Qatar Dosing System Market Revenues & Volume, By Chemical Processes, 2022-2032F |
6.2.6 Qatar Dosing System Market Revenues & Volume, By Food & Beverages, 2022-2032F |
6.2.7 Qatar Dosing System Market Revenues & Volume, By Others, 2022-2032F |
7 Qatar Dosing System Market Import-Export Trade Statistics |
7.1 Qatar Dosing System Market Export to Major Countries |
7.2 Qatar Dosing System Market Imports from Major Countries |
8 Qatar Dosing System Market Key Performance Indicators |
9 Qatar Dosing System Market - Opportunity Assessment |
9.1 Qatar Dosing System Market Opportunity Assessment, By Technology Type, 2022 & 2032F |
9.2 Qatar Dosing System Market Opportunity Assessment, By Application, 2022 & 2032F |
10 Qatar Dosing System Market - Competitive Landscape |
10.1 Qatar Dosing System Market Revenue Share, By Companies, 2025 |
10.2 Qatar Dosing System Market Competitive Benchmarking, By Operating and Technical Parameters |
11 Company Profiles |
12 Recommendations |
13 Disclaimer |
Global Go To Market Strategy - 2030
Export potential enables firms to identify high-growth global markets with greater confidence by combining advanced trade intelligence with a structured quantitative methodology. The framework analyzes emerging demand trends and country-level import patterns while integrating macroeconomic and trade datasets such as GDP and population forecasts, bilateral import–export flows, tariff structures, elasticity differentials between developed and developing economies, geographic distance, and import demand projections. Using weighted trade values from 2020–2024 as the base period to project country-to-country export potential for 2030, these inputs are operationalized through calculated drivers such as gravity model parameters, tariff impact factors, and projected GDP per-capita growth. Through an analysis of hidden potentials, demand hotspots, and market conditions that are most favorable to success, this method enables firms to focus on target countries, maximize returns, and global expansion with data, backed by accuracy.
By factoring in the projected importer demand gap that is currently unmet and could be potential opportunity, it identifies the potential for the Exporter (Country) among 190 countries, against the general trade analysis, which identifies the biggest importer or exporter.
To discover high-growth global markets and optimize your business strategy:
Click Here
Pricing
- Single User License$ 1,995
- Department License$ 2,400
- Site License$ 3,120
- Global License$ 3,795

Leadership Perspectives from Industry Events
Search
Thought Leadership and Analyst Meet


Our Clients
6WResearch In News
- Doha a strategic location for EV manufacturing hub: IPA Qatar
- Demand for luxury TVs surging in the GCC, says Samsung
- Empowering Growth: The Thriving Journey of Bangladesh’s Cable Industry
- Demand for luxury TVs surging in the GCC, says Samsung
- Video call with a traditional healer? Once unthinkable, it’s now common in South Africa
- Intelligent Buildings To Smooth GCC’s Path To Net Zero
Latest Reports
- Taiwan Airport Wireless Infrastructure Market (2026-2032)
- Vietnam Airport Wireless Infrastructure Market (2026-2032)
- Thailand Airport Wireless Infrastructure Market (2026-2032)
- South Korea Airport Wireless Infrastructure Market (2026-2032)
- Romania Airport Wireless Infrastructure Market (2026-2032)
- Qatar Airport Wireless Infrastructure Market (2026-2032)
- Philippines Airport Wireless Infrastructure Market (2026-2032)
- Japan Airport Wireless Infrastructure Market (2026-2032)
- Taiwan Airport Winter Services Market (2026-2032)
- Vietnam Airport Winter Services Market (2026-2032)
Industry Events and Analyst Meet

HIMTEX 2026

India Refining Summit 2026

India EV Show 2026

EV tech India Expo 2026

Auto Tech Asia 2026
Whitepaper
- Middle East & Africa Commercial Security Market Click here to view more.
- Middle East & Africa Fire Safety Systems & Equipment Market Click here to view more.
- GCC Drone Market Click here to view more.
- Middle East Lighting Fixture Market Click here to view more.
- GCC Physical & Perimeter Security Market Click here to view more.