Brazil Dosing System Market (2026-2032) | Share, Companies, Revenue, Forecast, Size, Analysis, Trends, Growth, Industry, Value & Outlook
Market Forecast By Technology Type (Diaphragm, Plunger/Piston, Cavity, Peristaltic, Others), By Application (Water Treatment, Power Generation, Oil & Gas, Chemical Processes, Food & Beverages, Others) And Competitive Landscape
| Product Code: ETC034582 | Publication Date: Oct 2020 | Updated Date: Jun 2026 | Product Type: Report | |
| Publisher: 6Wresearch | Author: Ravi Bhandari | No. of Pages: 70 | No. of Figures: 35 | No. of Tables: 5 |
Brazil Dosing System Market Summary
The brazil dosing system market was estimated at USD 230 Million in 2025 and is projected to reach USD 273 Million by 2032, growing at a CAGR of 3.1% from 2026 to 2032.
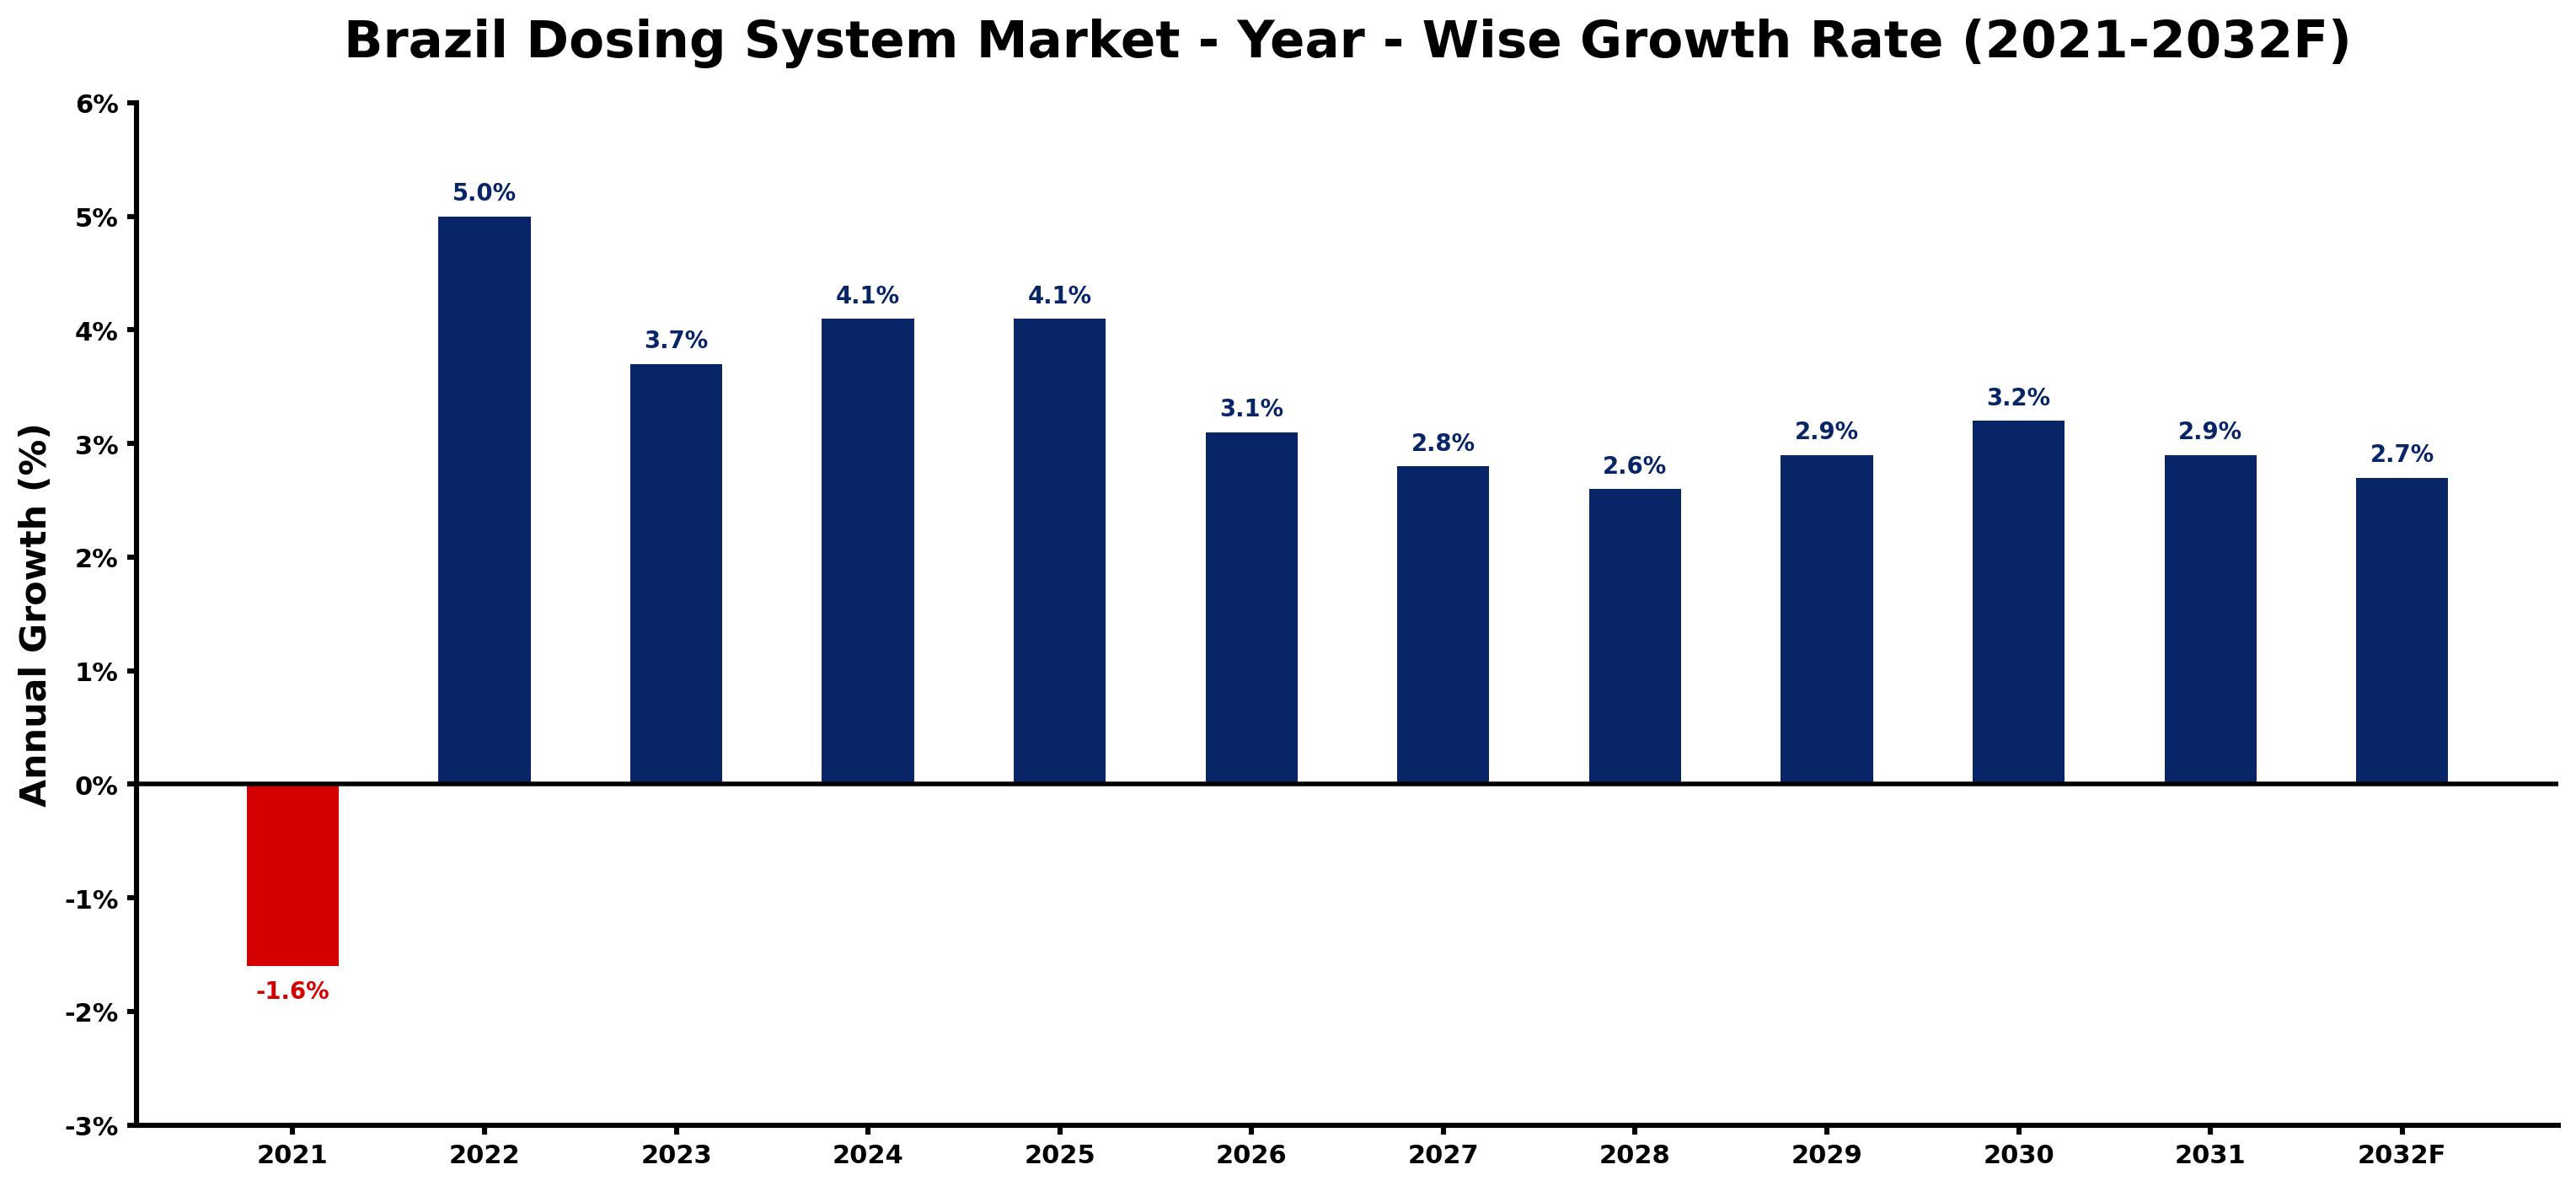
Brazil Dosing System Market Growth Rate Analysis (2021-2032)
The Brazilian dosing system market experienced a downturn of -1.6% in 2021, primarily due to pandemic-related disruptions and reduced industrial activity. However, the sector rebounded strongly in 2022 with a 5.0% growth, fueled by a resurgence in manufacturing and increased investments in automated solutions. Continued demand drove growth of 3.7% in 2023, with advancements in digital technologies and a focus on energy-efficient systems bolstering performance across various segments. As we look toward 2024 and 2025, steady growth rates of 4.1% reflect ongoing infrastructure developments and heightened consumer expectations for precision in dosing applications. Despite a gradual moderation in growth to 2.6% by 2028, the market remains on an upward trend, supported by sustained industrial demand.
Brazil Dosing System Market Year-wise Growth Rate and Key Drivers
This graph highlights how the Brazil Dosing System Market has steadily grown over the past five years, supported by major growth factors.
The table below presents the year wise growth rates along with the key drivers influencing the market
| Year | Growth Rate | Major Drivers |
| 2021 | -1.6% | Supply chain disruptions due to the pandemic limited availability and delayed deployment of dosing systems in various sectors. |
| 2022 | 5.0% | Corporate budgets increasingly favor automation to optimize operational effectiveness. |
| 2023 | 3.7% | Sustainability trends compel producers to adopt precise dosing and resource-efficient technologies. |
| 2024 | 4.1% | Emerging health regulations necessitate improved chemical management in manufacturing sectors. |
| 2025 | 4.1% | Technological innovations in sensors enhance dosing accuracy across various applications. |
| 2026 | 3.1% | Local industries are investing in infrastructure to support advanced dosing systems. |
| 2027 | 2.8% | Consumer preferences shift towards eco-friendly products, influencing dosing system development. |
| 2028 | 2.6% | Integration of IoT technology facilitates real-time monitoring of dosing processes. |
| 2029 | 2.9% | Competitive market dynamics drive continuous improvement in dosing system capabilities. |
| 2030 | 3.2% | Rising industrial output requires scalable dosing solutions for diverse production needs. |
| 2031 | 2.9% | Focus on reducing operational waste sparks interest in precision dosing technologies. |
| 2032 | 2.7% | Collaboration between manufacturers and tech companies leads to innovative dosing solutions. |
Note - Market size estimations and growth projections presented in this report are based on 6Wresearch's advanced forecasting approach, validated with industry datasets as of June 2026.
Brazil Dosing System Market Synopsis
The Brazil Dosing System Market is projected to reach 3.1% and witness significant growth during the forecast period (2026-2032). The increasing need for precise and automated dosing solutions is being driven by various sectors, including water treatment, chemical processing, and pharmaceuticals. Industries are emphasizing operational efficiency and accuracy, which is fueling the demand for advanced dosing systems.
Brazil Dosing System Market Growth Drivers
The growth of the Brazil Dosing System Market can be attributed to several key drivers:
- Stringent regulatory frameworks governing water treatment processes enhance the need for accurate dosing systems across industries, ensuring compliance and safeguarding public health.
- The increasing focus on operational efficiency in manufacturing sectors compels companies to adopt automation, leading to higher demand for sophisticated dosing systems.
- The rise in industrial activities and investments in chemical processing sectors necessitates reliable dosing solutions, contributing positively to market expansion.
- Pharmaceutical advancements and the quest for precision in drug formulation further stimulate demand for dosing systems that offer high accuracy and reliability.
- The growing awareness of environmental sustainability prompts industries to incorporate efficient chemical dosing practices in water and wastewater treatment processes.
Brazil Dosing System Market Challenges and Restraints
Despite the positive growth trajectory, the Brazil Dosing System Market faces specific challenges that could impact its efficiency:
- Rapid technological advancements in automation require continuous investment in research and development, challenging companies to maintain competitiveness and adapt to new methodologies.
- The integration of Industry 4.0 technologies into existing systems demands significant upgrades, which may strain financial resources and operational continuity.
- Ensuring precision and reliability in diverse operational environments is a persistent challenge for dosing systems, particularly as operational variables fluctuate.
- A lack of standardized testing and certification processes for dosing equipment can lead to inconsistencies in quality and performance, affecting the overall market perception.
- The high costs associated with advanced dosing technologies may deter smaller companies from adopting these solutions, impacting market penetration.
Brazil Dosing System Market Government Investment and Initiatives
The Brazilian government is actively promoting the development of the dosing system market through various initiatives and investments. Key areas of focus include:
- Government policies aimed at improving water and wastewater management have stimulated investments in dosing technologies to ensure compliance with environmental regulations.
- Public spending on water treatment infrastructure is increasing, creating further opportunities for the deployment of automated dosing systems across urban and rural regions.
- National development plans are emphasizing the modernization of industrial processes, which includes integrating efficient dosing solutions in manufacturing and processing sectors.
- Incentives for research and development in automation technologies are encouraging businesses to innovate and improve dosing systems.
- Collaborative efforts between the government and private sector are facilitating the sharing of knowledge and technologies, aiding in the advancement of dosing systems' precision and reliability.
Brazil Dosing System Market Latest Developments (May 2025 - June 2026)
The period from May 2025 to June 2026 has seen significant advancements in the Brazil Dosing System Market, characterized by increased momentum in technological integration and industry collaboration. Notable trends during this period include:
- Enhanced focus on sustainability led to the introduction of eco-friendly dosing solutions that minimize chemical waste and promote environmental responsibility.
- Emerging technologies powered by artificial intelligence and machine learning are being integrated into dosing systems, improving accuracy and predictive maintenance capabilities.
- Industry stakeholders are increasingly participating in trade shows and conferences, fostering networking opportunities aimed at knowledge exchange and collaboration in dosing technology advancements.
- There has been a gradual shift towards customized dosing solutions tailored to specific industry requirements, enhancing operational efficiencies across various sectors.
- Market players are expanding their product lines to cater to the diverse requirements of various applications, ensuring adaptability to varying operational conditions.
Brazil Dosing System Market - Key Attractiveness of the Report
- 10 Years of Market Numbers
- Historical Data Starting from 2022 to 2025
- Base Year: 2025
- Forecast Data until 2032
- Key Performance Indicators Impacting the Market
- Major Upcoming Developments and Projects
Key Highlights of the Report:
- Brazil Dosing System Market Outlook
- Market Size of Brazil Dosing System Market, 2025
- Forecast of Brazil Dosing System Market, 2032
- Historical Data and Forecast of Brazil Dosing System Revenues & Volume for the Period 2022-2032F
- Brazil Dosing System Market Trend Evolution
- Brazil Dosing System Market Drivers and Challenges
- Brazil Dosing System Price Trends
- Brazil Dosing System Porter's Five Forces
- Brazil Dosing System Industry Life Cycle
- Historical Data and Forecast of Brazil Dosing System Market Revenues & Volume By Technology Type for the Period 2022-2032F
- Historical Data and Forecast of Brazil Dosing System Market Revenues & Volume By Diaphragm for the Period 2022-2032F
- Historical Data and Forecast of Brazil Dosing System Market Revenues & Volume By Plunger/Piston for the Period 2022-2032F
- Historical Data and Forecast of Brazil Dosing System Market Revenues & Volume By Cavity for the Period 2022-2032F
- Historical Data and Forecast of Brazil Dosing System Market Revenues & Volume By Peristaltic for the Period 2022-2032F
- Historical Data and Forecast of Brazil Dosing System Market Revenues & Volume By Others for the Period 2022-2032F
- Historical Data and Forecast of Brazil Dosing System Market Revenues & Volume By Application for the Period 2022-2032F
- Historical Data and Forecast of Brazil Dosing System Market Revenues & Volume By Water Treatment for the Period 2022-2032F
- Historical Data and Forecast of Brazil Dosing System Market Revenues & Volume By Power Generation for the Period 2022-2032F
- Historical Data and Forecast of Brazil Dosing System Market Revenues & Volume By Oil & Gas for the Period 2022-2032F
- Historical Data and Forecast of Brazil Dosing System Market Revenues & Volume By Chemical Processes for the Period 2022-2032F
- Historical Data and Forecast of Brazil Dosing System Market Revenues & Volume By Food & Beverages for the Period 2022-2032F
- Historical Data and Forecast of Brazil Dosing System Market Revenues & Volume By Others for the Period 2022-2032F
- Brazil Dosing System Import Export Trade Statistics
- Market Opportunity Assessment By Technology Type
- Market Opportunity Assessment By Application
- Brazil Dosing System Top Companies Market Share
- Brazil Dosing System Competitive Benchmarking By Technical and Operational Parameters
- Brazil Dosing System Company Profiles
- Brazil Dosing System Key Strategic Recommendations
Frequently Asked Questions About the Market Study (FAQs):
The market is primarily driven by the water treatment, chemical processing, and pharmaceutical industries, which require precise and automated dosing solutions.
Companies contend with rapid technological advancements, the high costs of upgrading systems, and ensuring precision under varying operational conditions.
The government is investing in water treatment initiatives and providing incentives for modernization and research, thereby fostering market growth.
The integration of AI technologies and the push towards sustainability have marked significant trends in the market, enhancing both precision and environmental responsibility.
6Wresearch actively monitors the Brazil Dosing System Market and publishes its comprehensive annual report, highlighting emerging trends, growth drivers, revenue analysis, and forecast outlook. Our insights help businesses to make data-backed strategic decisions with ongoing market dynamics. Our analysts track relevent industries related to the Brazil Dosing System Market, allowing our clients with actionable intelligence and reliable forecasts tailored to emerging regional needs.
Yes, we provide customisation as per your requirements. To learn more, feel free to contact us on sales@6wresearch.com
1 Executive Summary |
2 Introduction |
2.1 Key Highlights of the Report |
2.2 Report Description |
2.3 Market Scope & Segmentation |
2.4 Research Methodology |
2.5 Assumptions |
3 Brazil Dosing System Market Overview |
3.1 Brazil Country Macro Economic Indicators |
3.2 Brazil Dosing System Market Revenues & Volume, 2022 & 2032F |
3.3 Brazil Dosing System Market - Industry Life Cycle |
3.4 Brazil Dosing System Market - Porter's Five Forces |
3.5 Brazil Dosing System Market Revenues & Volume Share, By Technology Type, 2022 & 2032F |
3.6 Brazil Dosing System Market Revenues & Volume Share, By Application, 2022 & 2032F |
4 Brazil Dosing System Market Dynamics |
4.1 Impact Analysis |
4.2 Market Drivers |
4.2.1 Increasing focus on water and wastewater treatment in Brazil |
4.2.2 Stringent regulations regarding environmental protection and water quality standards |
4.2.3 Growing industrial sector leading to higher demand for dosing systems |
4.3 Market Restraints |
4.3.1 High initial investment cost of dosing systems |
4.3.2 Lack of awareness and technical expertise |
4.3.3 Availability of alternative technologies for chemical dosing |
5 Brazil Dosing System Market Trends |
6 Brazil Dosing System Market, By Types |
6.1 Brazil Dosing System Market, By Technology Type |
6.1.1 Overview and Analysis |
6.1.2 Brazil Dosing System Market Revenues & Volume, By Technology Type, 2022-2032F |
6.1.3 Brazil Dosing System Market Revenues & Volume, By Diaphragm, 2022-2032F |
6.1.4 Brazil Dosing System Market Revenues & Volume, By Plunger/Piston, 2022-2032F |
6.1.5 Brazil Dosing System Market Revenues & Volume, By Cavity, 2022-2032F |
6.1.6 Brazil Dosing System Market Revenues & Volume, By Peristaltic, 2022-2032F |
6.1.7 Brazil Dosing System Market Revenues & Volume, By Others, 2022-2032F |
6.2 Brazil Dosing System Market, By Application |
6.2.1 Overview and Analysis |
6.2.2 Brazil Dosing System Market Revenues & Volume, By Water Treatment, 2022-2032F |
6.2.3 Brazil Dosing System Market Revenues & Volume, By Power Generation, 2022-2032F |
6.2.4 Brazil Dosing System Market Revenues & Volume, By Oil & Gas, 2022-2032F |
6.2.5 Brazil Dosing System Market Revenues & Volume, By Chemical Processes, 2022-2032F |
6.2.6 Brazil Dosing System Market Revenues & Volume, By Food & Beverages, 2022-2032F |
6.2.7 Brazil Dosing System Market Revenues & Volume, By Others, 2022-2032F |
7 Brazil Dosing System Market Import-Export Trade Statistics |
7.1 Brazil Dosing System Market Export to Major Countries |
7.2 Brazil Dosing System Market Imports from Major Countries |
8 Brazil Dosing System Market Key Performance Indicators |
8.1 Percentage increase in adoption of automated dosing systems |
8.2 Number of new partnerships or collaborations in the dosing system market |
8.3 Rate of innovation in dosing system technology |
9 Brazil Dosing System Market - Opportunity Assessment |
9.1 Brazil Dosing System Market Opportunity Assessment, By Technology Type, 2022 & 2032F |
9.2 Brazil Dosing System Market Opportunity Assessment, By Application, 2022 & 2032F |
10 Brazil Dosing System Market - Competitive Landscape |
10.1 Brazil Dosing System Market Revenue Share, By Companies, 2025 |
10.2 Brazil Dosing System Market Competitive Benchmarking, By Operating and Technical Parameters |
11 Company Profiles |
12 Recommendations |
13 Disclaimer |
Global Go To Market Strategy - 2030
Export potential enables firms to identify high-growth global markets with greater confidence by combining advanced trade intelligence with a structured quantitative methodology. The framework analyzes emerging demand trends and country-level import patterns while integrating macroeconomic and trade datasets such as GDP and population forecasts, bilateral import–export flows, tariff structures, elasticity differentials between developed and developing economies, geographic distance, and import demand projections. Using weighted trade values from 2020–2024 as the base period to project country-to-country export potential for 2030, these inputs are operationalized through calculated drivers such as gravity model parameters, tariff impact factors, and projected GDP per-capita growth. Through an analysis of hidden potentials, demand hotspots, and market conditions that are most favorable to success, this method enables firms to focus on target countries, maximize returns, and global expansion with data, backed by accuracy.
By factoring in the projected importer demand gap that is currently unmet and could be potential opportunity, it identifies the potential for the Exporter (Country) among 190 countries, against the general trade analysis, which identifies the biggest importer or exporter.
To discover high-growth global markets and optimize your business strategy:
Click Here
Pricing
- Single User License$ 1,995
- Department License$ 2,400
- Site License$ 3,120
- Global License$ 3,795

Leadership Perspectives from Industry Events
Search
Thought Leadership and Analyst Meet


Our Clients
6WResearch In News
- India Air Conditioner Market Set for Strong Rebound in 2026 After Weather-Led Correction and GST-Driven Recovery: 6Wresearch
- ADAS in India: How Automatic Emergency Braking, Blind Spot Detection & Driver Monitoring are Transforming Road Safety
- Doha a strategic location for EV manufacturing hub: IPA Qatar
- Demand for luxury TVs surging in the GCC, says Samsung
- Empowering Growth: The Thriving Journey of Bangladesh’s Cable Industry
- Demand for luxury TVs surging in the GCC, says Samsung
Latest Reports
- Poland Fire Protection Systems Market (2026-2032)
- Cape Verde Portable Hand-Thrown Extinguisher Market (2026-2032)
- Canada Portable Hand-Thrown Extinguisher Market (2026-2032)
- Cameroon Portable Hand-Thrown Extinguisher Market (2026-2032)
- Burundi Portable Hand-Thrown Extinguisher Market (2026-2032)
- Burkina Faso Portable Hand-Thrown Extinguisher Market (2026-2032)
- Bulgaria Portable Hand-Thrown Extinguisher Market (2026-2032)
- Brunei Portable Hand-Thrown Extinguisher Market (2026-2032)
- Botswana Portable Hand-Thrown Extinguisher Market (2026-2032)
- Bosnia and Herzegovina Portable Hand-Thrown Extinguisher Market (2026-2032)
Industry Events and Analyst Meet

HIMTEX 2026

India Refining Summit 2026

India EV Show 2026

EV tech India Expo 2026

Auto Tech Asia 2026
Whitepaper
- Middle East & Africa Commercial Security Market Click here to view more.
- Middle East & Africa Fire Safety Systems & Equipment Market Click here to view more.
- GCC Drone Market Click here to view more.
- Middle East Lighting Fixture Market Click here to view more.
- GCC Physical & Perimeter Security Market Click here to view more.