Qatar Ferric Sodium Sulphide Market (2026-2032) Outlook | Analysis, Revenue, Growth, Value, Share, Forecast, Size, Trends, Companies & Industry
Market Forecast By Products (Low Ferric Sodium Sulfide, Crystal Sodium Sulfide, Anhydrous Sodium Sulfide), By Grades (Technical Grade, Purified Grade), By Applications (Leather Industry, Textile Industry, Ore Processing, Pulp & Paper, Water Treatment, Chemical Processing, Food Industry, Others) And Competitive Landscape
| Product Code: ETC209093 | Publication Date: May 2022 | Updated Date: Jul 2026 | Product Type: Market Research Report | |
| Publisher: 6Wresearch | Author: Ravi Bhandari | No. of Pages: 60 | No. of Figures: 40 | No. of Tables: 7 |
Qatar Ferric Sodium Sulphide Market Size, Share & Growth Rate
The Qatar Ferric Sodium Sulphide Market was estimated at USD 185 Million in 2025 and is projected to reach USD 244 Million by 2032, growing at a CAGR of 4.0% from 2026 to 2032. The increasing focus on sustainable industrial practices and wastewater management is pivotal to this growth. As Qatar continues to diversify its economy and enhance its industrial capabilities, the demand for ferric sodium sulphide in sectors such as water treatment and textiles is set to rise significantly.
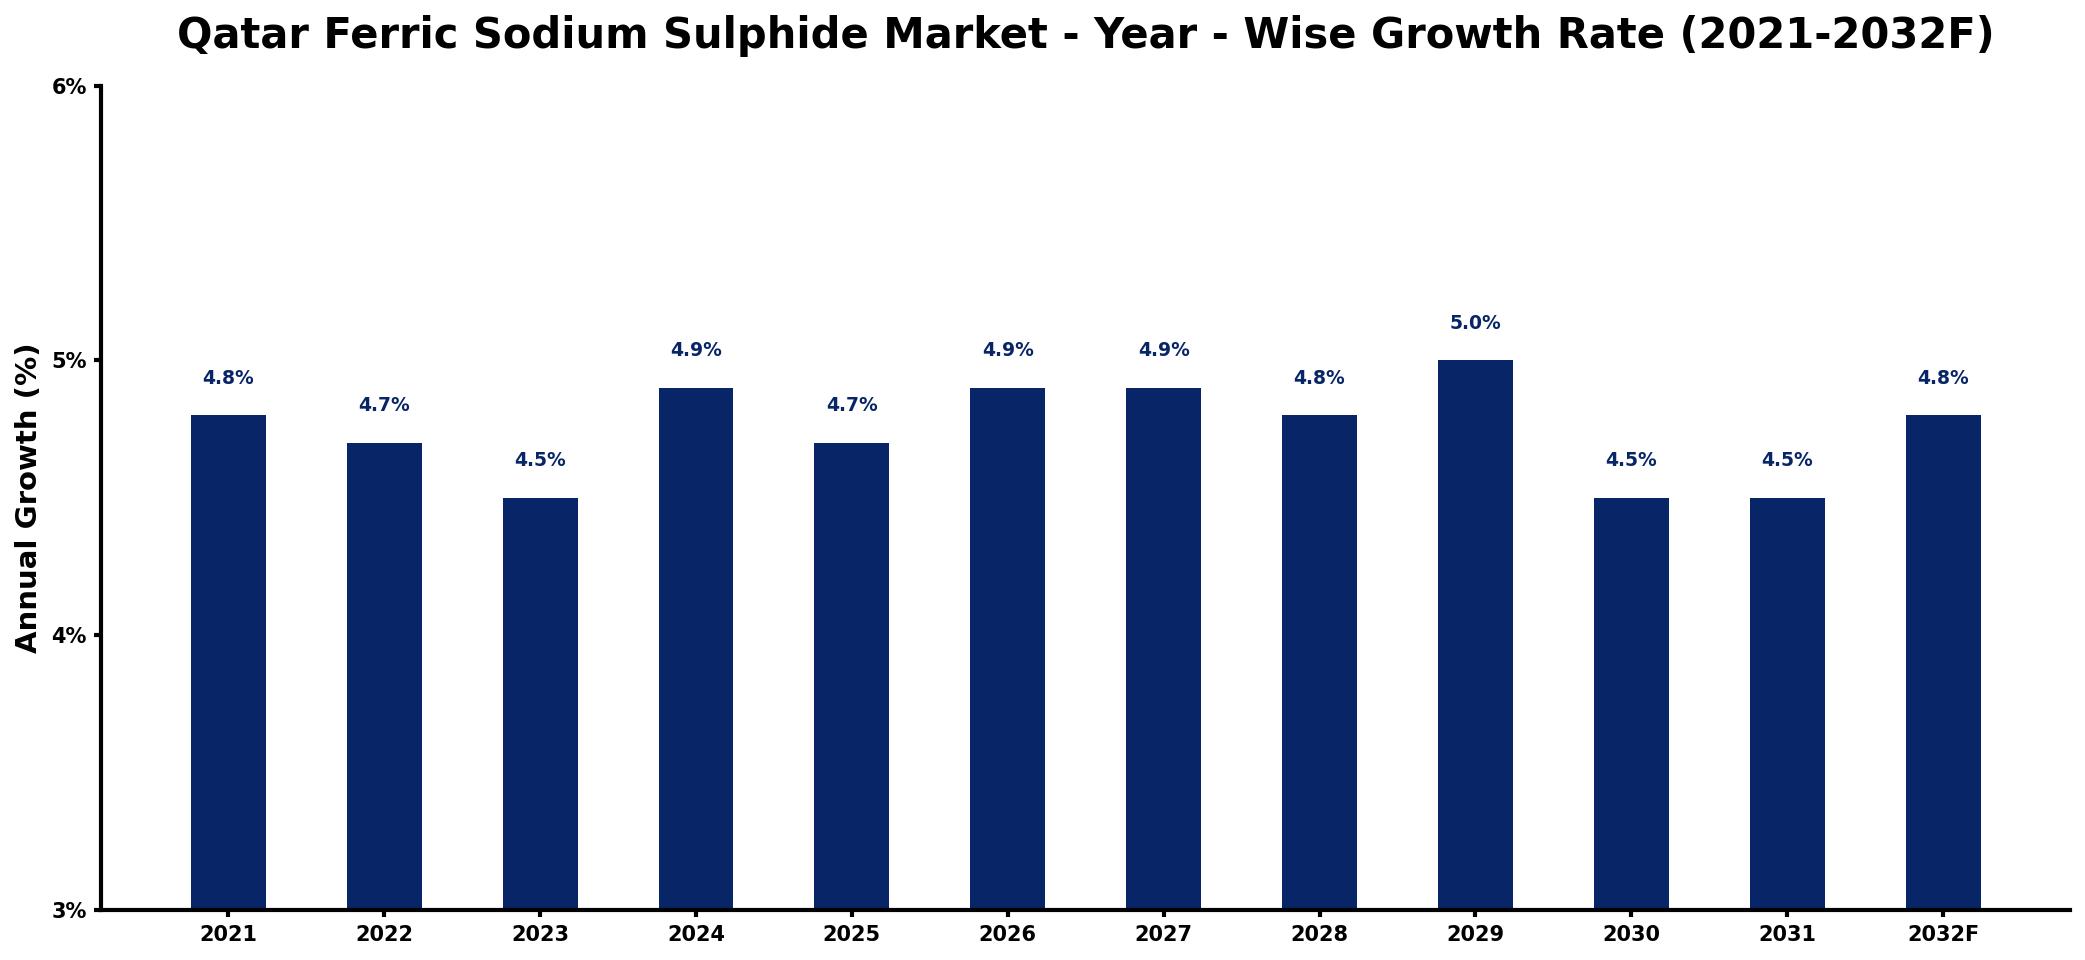
Qatar Ferric Sodium Sulphide Market Growth Rate Analysis (2021-2032)
The Qatar Ferric Sodium Sulphide market has shown stable growth, reflecting a compound annual growth rate of 4.8% in 2021, slightly easing to 4.7% in 2022, before stabilizing around 4.5% in 2023. This modest fluctuation can be attributed to industrial demand shifts and regulatory changes impacting production processes. However, the market is projected to rebound, with growth rates enhancing to 4.9% in 2024 and maintaining the same figure in 2026 and 2027, driven by increased investments in infrastructure and an energy transition towards more sustainable practices. The expansion of consumer demand further supports the market, with a forecasted climb to 5.0% by 2029, underscoring an adaptive response to evolving industrial needs.
Qatar Ferric Sodium Sulphide Market Year-wise Growth Rate and Key Drivers
This graph highlights how the Qatar Ferric Sodium Sulphide Market has steadily grown over the past five years, supported by major growth factors.
The table below presents the year‑wise growth rates along with the key drivers influencing the market
| Year | Growth Rate | Major Drivers |
| 2021 | 4.8% | Increased industrial manufacturing activity |
| 2022 | 4.7% | Growing investment in renewable energy |
| 2023 | 4.5% | Expansion of chemical processing sector |
| 2024 | 4.9% | Rising demand for water treatment |
| 2025 | 4.7% | Increased focus on sustainable practices |
| 2026 | 4.9% | Growth in agricultural applications |
| 2027 | 4.9% | Surge in global export opportunities |
| 2028 | 4.8% | Development of innovative processing technologies |
| 2029 | 5.0% | increased domestic production output |
| 2030 | 4.5% | Increased urbanization and infrastructure projects |
| 2031 | 4.5% | Growing adoption of advanced materials |
| 2032 | 4.8% | strengthening underlying market demand |
Note: Market size estimations and growth projections presented in this report are based on 6Wresearch's proprietary forecasting methodology, utilizing the latest available industry data, government publications, and primary research inputs.
Qatar Ferric Sodium Sulphide Market Synopsis
The strongest force shaping the Qatar Ferric Sodium Sulphide Market currently is the countrys commitment to sustainable practices and environmental stewardship. This has intensified the need for efficient solutions in wastewater treatment, where ferric sodium sulphide plays a critical role in purification processes.
Moreover, Qatars vision to bolster its industrial sector and embrace diversified economic activities is creating new opportunities for the application of ferric sodium sulphide. As industries increasingly seek effective reducing agents and compounds, the relevance of ferric sodium sulphide continues to gain traction.
Qatar Ferric Sodium Sulphide Market Key Takeaways
- The market is being driven by increased industrial diversification and a commitment to sustainability.
- Key applications of ferric sodium sulphide include wastewater treatment, leather processing, and textile manufacturing.
- Odor control and toxicity management are vital considerations for its expanded utilization.
- COVID-19 related disruptions have affected short-term demand, but recovery is on the horizon.
- Qatar Fuel Additives Company (QAFAC) plays a significant role in supply and production within this sector.
Evaluation of Restraints in Qatar Ferric Sodium Sulphide Market
Despite its advantages, the ferric sodium sulphide market faces notable restraints that could hinder its growth. The compounds inherent unpleasant odor and toxicity necessitate stringent handling and safety protocols, limiting its broader acceptance in some sectors. Additionally, the existing environmental regulations pose a challenge, as industries may hesitate to adopt materials that require complex disposal processes. To address these concerns, the development of effective odor neutralization technologies and waste treatment methods will be essential to expand its application base.
Qatar Ferric Sodium Sulphide Market Trends
Current trends in the Qatar Ferric Sodium Sulphide Market indicate a shift towards more sustainable and efficient industrial processes. Innovations in water treatment technologies, which integrate ferric sodium sulphide, are gaining popularity as industries seek to minimize their ecological footprint. Additionally, the textile and leather industries are gradually adopting more environmentally friendly practices, thereby increasing their reliance on ferric sodium sulphide as a reducing agent.
Qatar Ferric Sodium Sulphide Market Opportunities
The evolving landscape of Qatars industrial sector presents significant growth and investment opportunities for ferric sodium sulphide. As the nation invests in advanced wastewater treatment facilities and promotes cleaner production techniques, there will be an escalating demand for this compound. Furthermore, potential collaborations between local industries and technology providers could enhance the efficiency of applications, thereby creating a favorable environment for market expansion.
Government Initiatives in the Qatar Ferric Sodium Sulphide Market
The Qatari government is actively investing in environmental protection initiatives and industrial diversification programs. Various policies aim to promote sustainable industrial practices and improve water management systems throughout the country. These initiatives underscore the importance of ferric sodium sulphide in achieving national objectives related to sustainability and resource management, fostering an environment conducive to market growth.
Future Insights of the Qatar Ferric Sodium Sulphide Market
Looking ahead to 2026-2032, the Qatar Ferric Sodium Sulphide Market is poised for steady growth driven by technological advancements and heightened environmental awareness. As industrial entities adapt to stricter regulations and public expectations for sustainability, the demand for efficient wastewater treatment solutions and reducing agents like ferric sodium sulphide will only increase. This growth trajectory is expected to be supported by continuous investments in industrial capacity and innovation.
Qatar Ferric Sodium Sulphide Market Latest Developments (2025 - 2026)
Recent developments indicate a stronger push towards research and development in ferric sodium sulphide applications, particularly in water treatment technologies. Industry stakeholders are exploring advanced processing techniques that minimize the negative impacts associated with the compound, such as odor and toxicity. Furthermore, partnerships between public entities and private sectors are being fostered to improve supply chain efficiencies and expand the market reach of ferric sodium sulphide.
Qatar Ferric Sodium Sulphide Market - Key Attractiveness of the Report
- 10 Years of Market Numbers
- Historical Data Starting from 2022 to 2025
- Base Year: 2025
- Forecast Data until 2032
- Key Performance Indicators Impacting the Market
- Major Upcoming Developments and Projects
Key Highlights of the Report:
- Qatar Ferric Sodium Sulphide Market Outlook
- Market Size of Qatar Ferric Sodium Sulphide Market, 2025
- Forecast of Qatar Ferric Sodium Sulphide Market, 2032
- Historical Data and Forecast of Qatar Ferric Sodium Sulphide Revenues & Volume for the Period 2022-2032F
- Qatar Ferric Sodium Sulphide Market Trend Evolution
- Qatar Ferric Sodium Sulphide Market Drivers and Challenges
- Qatar Ferric Sodium Sulphide Price Trends
- Qatar Ferric Sodium Sulphide Porter's Five Forces
- Qatar Ferric Sodium Sulphide Industry Life Cycle
- Historical Data and Forecast of Qatar Ferric Sodium Sulphide Market Revenues & Volume By Products for the Period 2022-2032F
- Historical Data and Forecast of Qatar Ferric Sodium Sulphide Market Revenues & Volume By Low Ferric Sodium Sulfide for the Period 2022-2032F
- Historical Data and Forecast of Qatar Ferric Sodium Sulphide Market Revenues & Volume By Crystal Sodium Sulfide for the Period 2022-2032F
- Historical Data and Forecast of Qatar Ferric Sodium Sulphide Market Revenues & Volume By Anhydrous Sodium Sulfide for the Period 2022-2032F
- Historical Data and Forecast of Qatar Ferric Sodium Sulphide Market Revenues & Volume By Grades for the Period 2022-2032F
- Historical Data and Forecast of Qatar Ferric Sodium Sulphide Market Revenues & Volume By Technical Grade for the Period 2022-2032F
- Historical Data and Forecast of Qatar Ferric Sodium Sulphide Market Revenues & Volume By Purified Grade for the Period 2022-2032F
- Historical Data and Forecast of Qatar Ferric Sodium Sulphide Market Revenues & Volume By Applications for the Period 2022-2032F
- Historical Data and Forecast of Qatar Ferric Sodium Sulphide Market Revenues & Volume By Leather Industry for the Period 2022-2032F
- Historical Data and Forecast of Qatar Ferric Sodium Sulphide Market Revenues & Volume By Textile Industry for the Period 2022-2032F
- Historical Data and Forecast of Qatar Ferric Sodium Sulphide Market Revenues & Volume By Ore Processing for the Period 2022-2032F
- Historical Data and Forecast of Qatar Ferric Sodium Sulphide Market Revenues & Volume By Pulp & Paper for the Period 2022-2032F
- Historical Data and Forecast of Qatar Ferric Sodium Sulphide Market Revenues & Volume By Water Treatment for the Period 2022-2032F
- Historical Data and Forecast of Qatar Ferric Sodium Sulphide Market Revenues & Volume By Chemical Processing for the Period 2022-2032F
- Historical Data and Forecast of Qatar Ferric Sodium Sulphide Market Revenues & Volume By Food Industry for the Period 2022-2032F
- Historical Data and Forecast of Qatar Ferric Sodium Sulphide Market Revenues & Volume By Others for the Period 2022-2032F
- Qatar Ferric Sodium Sulphide Import Export Trade Statistics
- Market Opportunity Assessment By Products
- Market Opportunity Assessment By Grades
- Market Opportunity Assessment By Applications
- Qatar Ferric Sodium Sulphide Top Companies Market Share
- Qatar Ferric Sodium Sulphide Competitive Benchmarking By Technical and Operational Parameters
- Qatar Ferric Sodium Sulphide Company Profiles
- Qatar Ferric Sodium Sulphide Key Strategic Recommendations
Frequently Asked Questions About the Market Study (FAQs):
The market is anticipated to grow at a CAGR of 4.0% from 2026 to 2032, reaching USD 244 Million by 2032.
The primary consumers include the wastewater treatment sector, as well as industries such as leather processing and textiles, which utilize the compound for its reducing properties.
Qatar's commitment to sustainability enhances the demand for ferric sodium sulphide, particularly in wastewater treatment initiatives aimed at improving environmental outcomes and resource management.
The compound’s unpleasant odor and toxicity pose challenges in its handling and application across various industries, necessitating effective management strategies.
QAFAC is a key player in the production and supply of ferric sodium sulphide, contributing to its availability across various industrial applications in Qatar.
6Wresearch actively monitors the Qatar Ferric Sodium Sulphide Market and publishes its comprehensive annual report, highlighting emerging trends, growth drivers, revenue analysis, and forecast outlook. Our insights help businesses to make data-backed strategic decisions with ongoing market dynamics. Our analysts track relevent industries related to the Qatar Ferric Sodium Sulphide Market, allowing our clients with actionable intelligence and reliable forecasts tailored to emerging regional needs.
Yes, we provide customisation as per your requirements. To learn more, feel free to contact us on sales@6wresearch.com
1 Executive Summary |
2 Introduction |
2.1 Key Highlights of the Report |
2.2 Report Description |
2.3 Market Scope & Segmentation |
2.4 Research Methodology |
2.5 Assumptions |
3 Qatar Ferric Sodium Sulphide Market Overview |
3.1 Qatar Country Macro Economic Indicators |
3.2 Qatar Ferric Sodium Sulphide Market Revenues & Volume, 2022 & 2032F |
3.3 Qatar Ferric Sodium Sulphide Market - Industry Life Cycle |
3.4 Qatar Ferric Sodium Sulphide Market - Porter's Five Forces |
3.5 Qatar Ferric Sodium Sulphide Market Revenues & Volume Share, By Products, 2022 & 2032F |
3.6 Qatar Ferric Sodium Sulphide Market Revenues & Volume Share, By Grades, 2022 & 2032F |
3.7 Qatar Ferric Sodium Sulphide Market Revenues & Volume Share, By Applications, 2022 & 2032F |
4 Qatar Ferric Sodium Sulphide Market Dynamics |
4.1 Impact Analysis |
4.2 Market Drivers |
4.2.1 Growing demand for water treatment chemicals in Qatar |
4.2.2 Increase in industrial activities and infrastructure development in the region |
4.2.3 Favorable government regulations promoting the use of ferric sodium sulphide in various applications |
4.3 Market Restraints |
4.3.1 Fluctuating prices of raw materials used in the production of ferric sodium sulphide |
4.3.2 Intense competition from alternative water treatment chemicals in the market |
5 Qatar Ferric Sodium Sulphide Market Trends |
6 Qatar Ferric Sodium Sulphide Market, By Types |
6.1 Qatar Ferric Sodium Sulphide Market, By Products |
6.1.1 Overview and Analysis |
6.1.2 Qatar Ferric Sodium Sulphide Market Revenues & Volume, By Products, 2022-2032F |
6.1.3 Qatar Ferric Sodium Sulphide Market Revenues & Volume, By Low Ferric Sodium Sulfide, 2022-2032F |
6.1.4 Qatar Ferric Sodium Sulphide Market Revenues & Volume, By Crystal Sodium Sulfide, 2022-2032F |
6.1.5 Qatar Ferric Sodium Sulphide Market Revenues & Volume, By Anhydrous Sodium Sulfide, 2022-2032F |
6.2 Qatar Ferric Sodium Sulphide Market, By Grades |
6.2.1 Overview and Analysis |
6.2.2 Qatar Ferric Sodium Sulphide Market Revenues & Volume, By Technical Grade, 2022-2032F |
6.2.3 Qatar Ferric Sodium Sulphide Market Revenues & Volume, By Purified Grade, 2022-2032F |
6.3 Qatar Ferric Sodium Sulphide Market, By Applications |
6.3.1 Overview and Analysis |
6.3.2 Qatar Ferric Sodium Sulphide Market Revenues & Volume, By Leather Industry, 2022-2032F |
6.3.3 Qatar Ferric Sodium Sulphide Market Revenues & Volume, By Textile Industry, 2022-2032F |
6.3.4 Qatar Ferric Sodium Sulphide Market Revenues & Volume, By Ore Processing, 2022-2032F |
6.3.5 Qatar Ferric Sodium Sulphide Market Revenues & Volume, By Pulp & Paper, 2022-2032F |
6.3.6 Qatar Ferric Sodium Sulphide Market Revenues & Volume, By Water Treatment, 2022-2032F |
6.3.7 Qatar Ferric Sodium Sulphide Market Revenues & Volume, By Chemical Processing, 2022-2032F |
6.3.8 Qatar Ferric Sodium Sulphide Market Revenues & Volume, By Others, 2022-2032F |
6.3.9 Qatar Ferric Sodium Sulphide Market Revenues & Volume, By Others, 2022-2032F |
7 Qatar Ferric Sodium Sulphide Market Import-Export Trade Statistics |
7.1 Qatar Ferric Sodium Sulphide Market Export to Major Countries |
7.2 Qatar Ferric Sodium Sulphide Market Imports from Major Countries |
8 Qatar Ferric Sodium Sulphide Market Key Performance Indicators |
8.1 Percentage increase in demand for water treatment chemicals in Qatar |
8.2 Number of new industrial projects or infrastructure developments using ferric sodium sulphide |
8.3 Compliance rate with government regulations on the use of ferric sodium sulphide in different applications |
9 Qatar Ferric Sodium Sulphide Market - Opportunity Assessment |
9.1 Qatar Ferric Sodium Sulphide Market Opportunity Assessment, By Products, 2022 & 2032F |
9.2 Qatar Ferric Sodium Sulphide Market Opportunity Assessment, By Grades, 2022 & 2032F |
9.3 Qatar Ferric Sodium Sulphide Market Opportunity Assessment, By Applications, 2022 & 2032F |
10 Qatar Ferric Sodium Sulphide Market - Competitive Landscape |
10.1 Qatar Ferric Sodium Sulphide Market Revenue Share, By Companies, 2025 |
10.2 Qatar Ferric Sodium Sulphide Market Competitive Benchmarking, By Operating and Technical Parameters |
11 Company Profiles |
12 Recommendations |
13 Disclaimer |
Global Go To Market Strategy - 2030
Export potential enables firms to identify high-growth global markets with greater confidence by combining advanced trade intelligence with a structured quantitative methodology. The framework analyzes emerging demand trends and country-level import patterns while integrating macroeconomic and trade datasets such as GDP and population forecasts, bilateral import–export flows, tariff structures, elasticity differentials between developed and developing economies, geographic distance, and import demand projections. Using weighted trade values from 2020–2024 as the base period to project country-to-country export potential for 2030, these inputs are operationalized through calculated drivers such as gravity model parameters, tariff impact factors, and projected GDP per-capita growth. Through an analysis of hidden potentials, demand hotspots, and market conditions that are most favorable to success, this method enables firms to focus on target countries, maximize returns, and global expansion with data, backed by accuracy.
By factoring in the projected importer demand gap that is currently unmet and could be potential opportunity, it identifies the potential for the Exporter (Country) among 190 countries, against the general trade analysis, which identifies the biggest importer or exporter.
To discover high-growth global markets and optimize your business strategy:
Click Here
Pricing
- Single User License$ 1,995
- Department License$ 2,400
- Site License$ 3,120
- Global License$ 3,795

Leadership Perspectives from Industry Events
Search
Thought Leadership and Analyst Meet


Our Clients
6WResearch In News
- India Air Conditioner Market Set for Strong Rebound in 2026 After Weather-Led Correction and GST-Driven Recovery: 6Wresearch
- ADAS in India: How Automatic Emergency Braking, Blind Spot Detection & Driver Monitoring are Transforming Road Safety
- Doha a strategic location for EV manufacturing hub: IPA Qatar
- Demand for luxury TVs surging in the GCC, says Samsung
- Empowering Growth: The Thriving Journey of Bangladesh’s Cable Industry
- Demand for luxury TVs surging in the GCC, says Samsung
Latest Reports
- Nicaragua RPG Gaming Market (2026-2032)
- New Zealand RPG Gaming Market (2026-2032)
- Netherlands RPG Gaming Market (2026-2032)
- Nauru RPG Gaming Market (2026-2032)
- Namibia RPG Gaming Market (2026-2032)
- Mozambique RPG Gaming Market (2026-2032)
- Montenegro RPG Gaming Market (2026-2032)
- Mongolia RPG Gaming Market (2026-2032)
- Monaco RPG Gaming Market (2026-2032)
- Micronesia RPG Gaming Market (2026-2032)
Industry Events and Analyst Meet

HIMTEX 2026

India Refining Summit 2026

India EV Show 2026

EV tech India Expo 2026

Auto Tech Asia 2026
Whitepaper
- Middle East & Africa Commercial Security Market Click here to view more.
- Middle East & Africa Fire Safety Systems & Equipment Market Click here to view more.
- GCC Drone Market Click here to view more.
- Middle East Lighting Fixture Market Click here to view more.
- GCC Physical & Perimeter Security Market Click here to view more.