Qatar Fin Fish Market (2026-2032) | Industry, Forecast, Value, Growth, Outlook, Revenue, Analysis, Size, Trends, Share & Companies
Market Forecast By Environment (Freshwater, Marine Water, Brackish Water), By Fish Type (Pompano, Snappers, Groupers, Salmon, Milkfish, Tuna, Catfish, Others) And Competitive Landscape
| Product Code: ETC038842 | Publication Date: Jul 2023 | Updated Date: Jun 2026 | Product Type: Report | |
| Publisher: 6Wresearch | Author: Ravi Bhandari | No. of Pages: 70 | No. of Figures: 35 | No. of Tables: 5 |
Qatar Fin Fish Market Summary
The qatar fin fish market was estimated at USD 1388 Million in 2025 and is projected to reach USD 1976 Million by 2032, growing at a CAGR of 6.2% from 2026 to 2032.
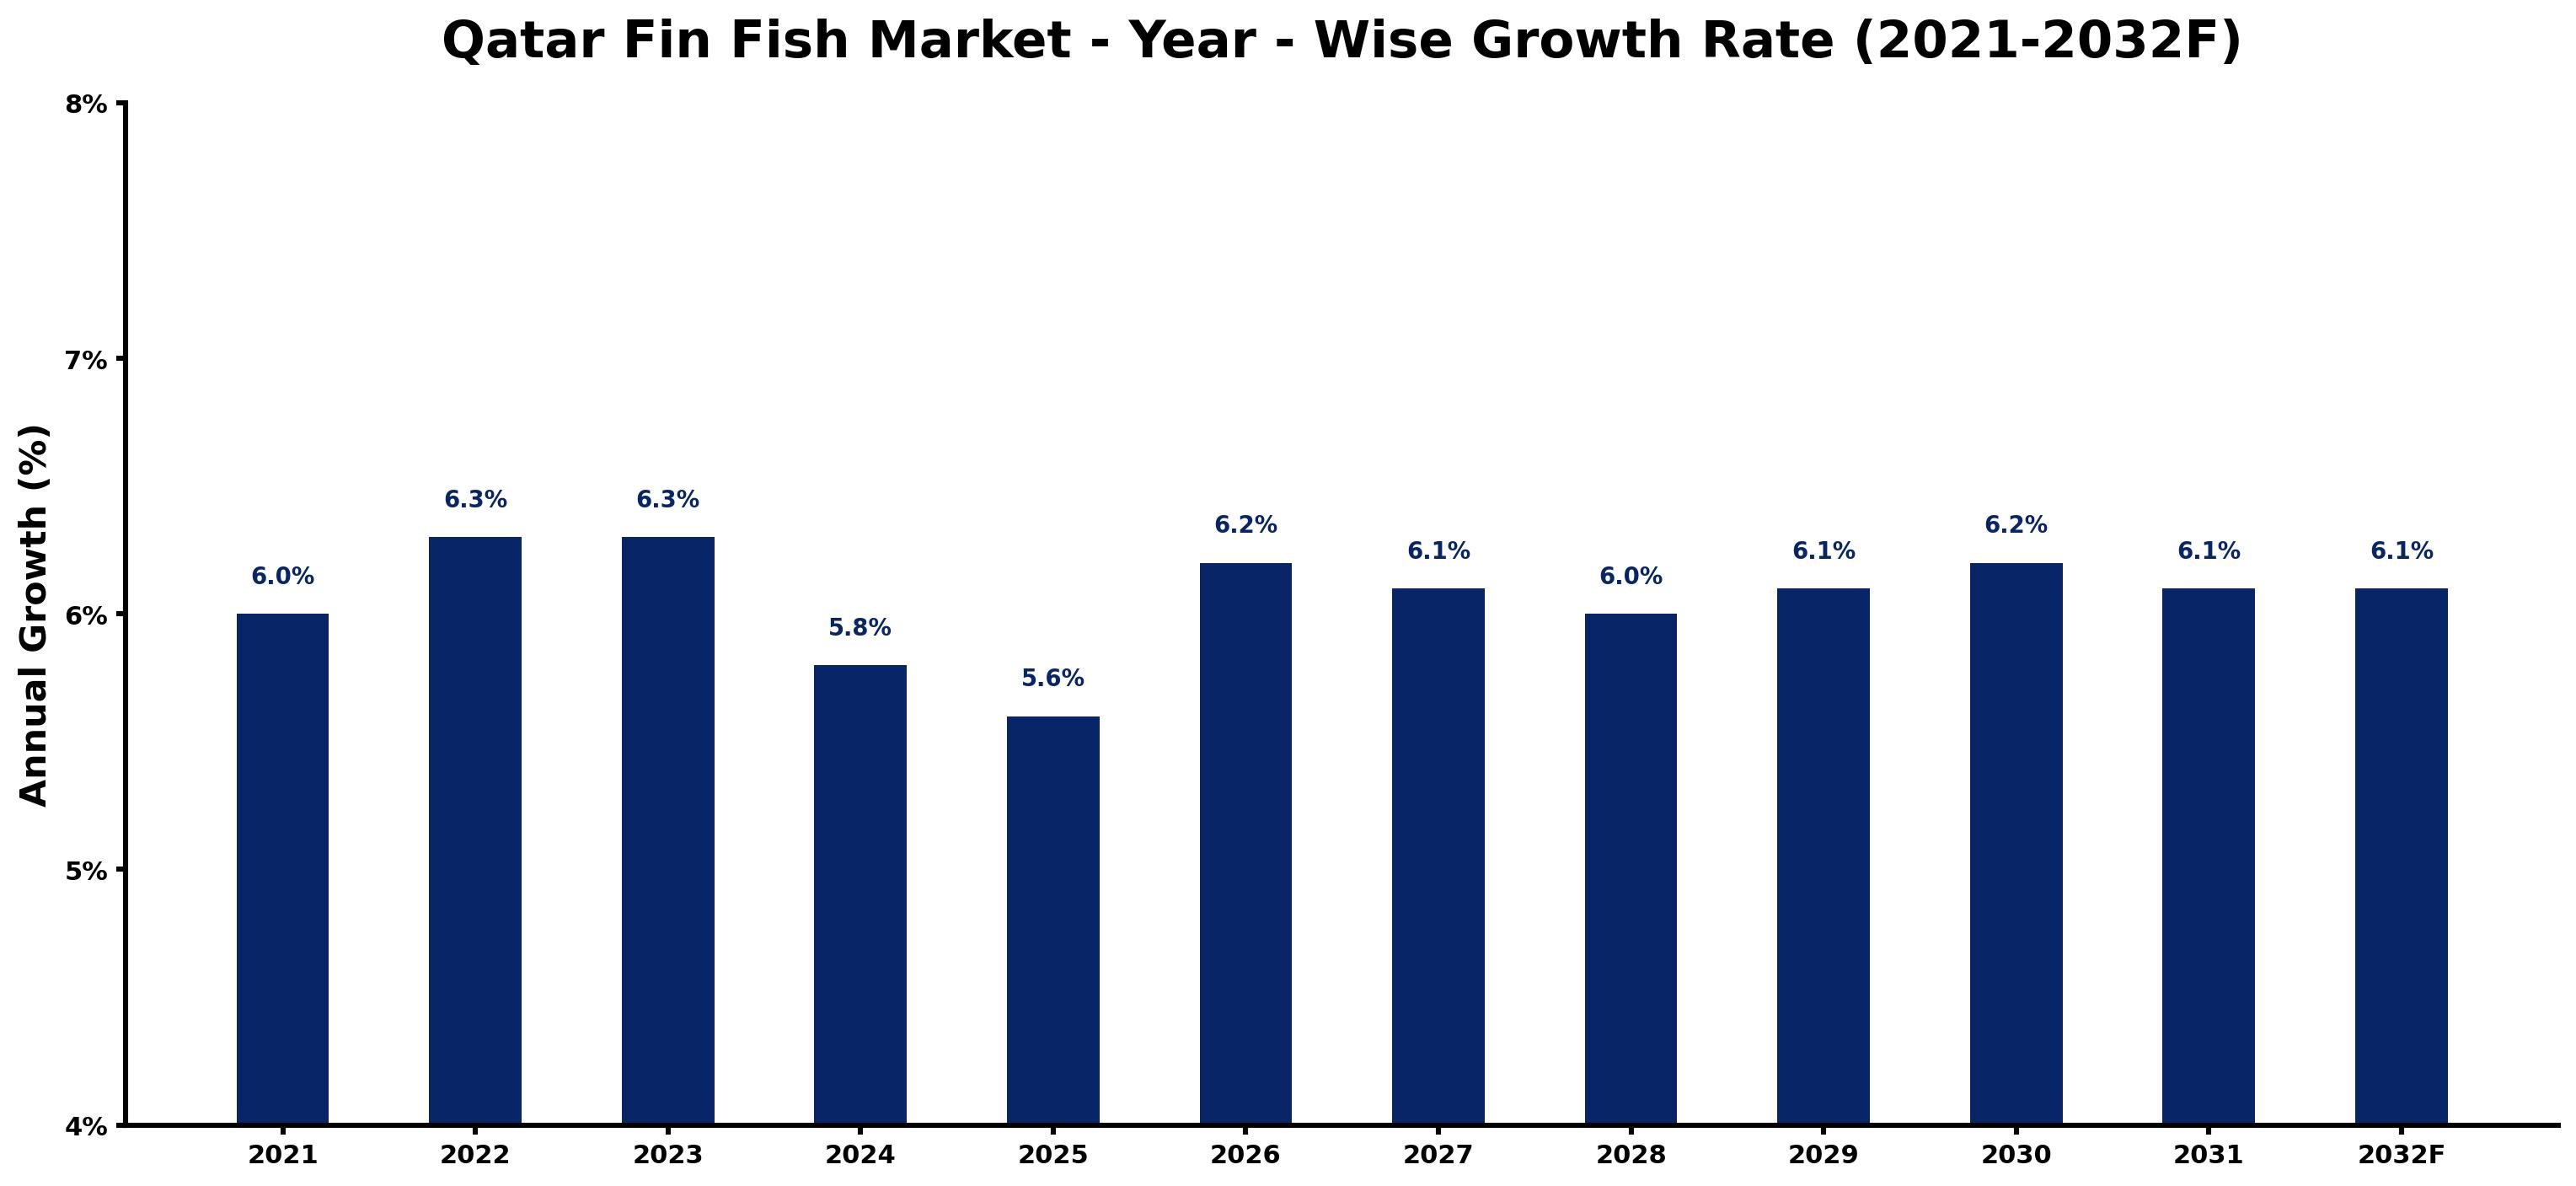
Qatar Fin Fish Market Growth Rate Analysis (2021-2032)
The Qatar Fin Fish market has shown stable growth, with yearly increases ranging from 5.6% to 6.3% from 2021 to 2023. Factors such as rising consumer demand for sustainable seafood, coupled with significant investments in aquaculture infrastructure, have driven this expansion. While growth is projected to soften slightly to 5.8% in 2024 and 5.6% in 2025 due to potential demand saturation and inflationary pressures, the market is expected to rebound to around 6.1% through 2032 as technological advancements in fish farming and government policies favoring local production stimulate renewed interest. Overall, this market is positioned for sustained development benefiting from Qatar's strategic focus on food security and environmental sustainability.
Qatar Fin Fish Market Year-wise Growth Rate and Key Drivers
This graph highlights how the Qatar Fin Fish Market has steadily grown over the past five years, supported by major growth factors.
The table below presents the year‑wise growth rates along with the key drivers influencing the market
| Year | Growth Rate | Major Drivers |
| 2021 | 6.0% | Post-COVID recovery in the hospitality sector positively impacts fish consumption patterns. |
| 2022 | 6.3% | Local culinary events highlight regional fish dishes, boosting consumer interest and sales. |
| 2023 | 6.3% | Investment in sustainable fishing practices enhances both supply chain and market reputation. |
| 2024 | 5.8% | Emergence of premium seafood brands caters to affluent consumers' evolving tastes. |
| 2025 | 5.6% | Increased air conditioning demand emphasizes the need for fresh fish in local diets. |
| 2026 | 6.2% | Partnerships with international seafood suppliers improve product variety in local markets. |
| 2027 | 6.1% | Expansion of urban fisheries generates fresh supply to densely populated districts. |
| 2028 | 6.0% | Technological advancements in aquaculture improve yield efficiency and reduce costs significantly. |
| 2029 | 6.1% | Growing awareness of health benefits associated with fish consumption drives new marketing campaigns. |
| 2030 | 6.2% | Regional trade agreements facilitate easier importation of diverse fish species, enriching the market. |
| 2031 | 6.1% | Community-supported fisheries foster local engagement, benefiting both producers and consumers. |
| 2032 | 6.1% | Sustainability certifications become crucial, influencing consumer purchasing decisions in the market. |
Note - Market size estimations and growth projections presented in this report are based on 6Wresearch’s advanced forecasting approach, validated with industry datasets as of June 2026.
Qatar Fin Fish Market Synopsis
The Qatar Fin Fish Market is projected to reach 6.1% and witness significant growth during the forecast period (2026-2032). The market encapsulates a comprehensive ecosystem involving the production, distribution, and consumption of various fin fish species, sourced from local fisheries and international imports. Fin fish are integral to the Qatari diet, serving as a primary source of protein available in multiple forms, including fresh, frozen, and processed products.
Qatar Fin Fish Market Growth Drivers
Several key factors are driving the growth of the Qatar Fin Fish Market. Firstly, Qatar's coastal geography provides an abundant supply of seafood, meeting the cultural preference for fish among its population. Additionally, the steadily increasing population in Qatar has led to heightened demand for seafood products, placing further stress on the available supply of fin fish.
- The ongoing tourism boom in Qatar significantly stimulates demand for fin fish in the hospitality sector, particularly within hotels and restaurants catering to both locals and international visitors.
- Health consciousness among consumers has bolstered the appeal of fin fish, recognized for their rich nutrient profile, including Omega-3 fatty acids that are essential for overall health.
- Innovations in fishing technology and processing methods have improved the supply chain efficiency, making fresh and high-quality fin fish more accessible to consumers.
- Government initiatives focused on promoting local fishing activities and sustainable practices further enhance the market's potential for growth.
- The global trend towards healthier eating habits reinforces the consumption of fin fish, especially as the market caters to a discerning clientele seeking nutritious food options.
Qatar Fin Fish Market Challenges and Restraints
Despite the promising outlook, the Qatar Fin Fish Market faces several challenges. Environmental concerns, particularly overfishing, pose a significant threat to the sustainability of various fish species, compelling a shift towards more responsible fishing practices.
- Overreliance on seafood imports to meet local demand presents risks, particularly in the face of global supply chain disruptions that could impact availability and prices.
- Maintaining food safety standards for imported fish products is critical, as consumers increasingly prioritize quality and safety in their food choices.
- The effects of the Covid-19 pandemic are still being felt in the market, influencing consumer behavior and fishery activities during times of restricted movement and closures.
- Market volatility can be exacerbated by climatic changes that impact fishing conditions and fish populations, requiring adaptive strategies within the sector.
- The need for ongoing consumer education regarding sustainable fishing practices and the benefits of consuming locally sourced fish remains a necessary focus for market growth.
Qatar Fin Fish Market Government Investment and Initiatives
The Qatari government has demonstrated a commitment to enhancing the fin fish market through various initiatives and investments. Policies aimed at promoting sustainable fishing practices are being implemented to ensure the long-term viability of local fisheries. These include regulations on catch limits and protected marine areas. Additionally, public spending on infrastructure improvements is essential for enhancing the supply chain, including cold storage and transportation facilities for seafood.
- Investment in research and development initiatives aims to enhance aquaculture practices, thus reducing the dependency on wild catches and stabilizing supply.
- The government encourages partnerships between local fishers and private sector enterprises to build a more resilient market structure.
- Supportive measures such as subsidies for local fishermen aim to boost domestic production and improve profitability.
- Community outreach and educational programs focus on promoting the importance of seafood in the diet, thereby increasing consumer demand for locally sourced fin fish.
- Regulatory frameworks are being developed to ensure compliance with international food safety standards, thereby enhancing consumer confidence in local seafood products.
Qatar Fin Fish Market Latest Developments (May 2025 - June 2026)
Recent developments within the Qatar Fin Fish Market from May 2025 to June 2026 reflect a dynamic industry landscape. The government has intensified efforts to promote local fishing and aquaculture, with a focus on improving sustainability and efficiency. New partnerships between local fisheries and technology firms have emerged, driving innovation in fish farming techniques and processing technologies.
- Demand for frozen seafood products has surged as consumers adapt to cooking at home, leading to a strategic pivot in distribution channels favoring retail over foodservice.
- Regulatory changes have been announced to streamline import processes for seafood, aiming to ensure that quality standards are met while facilitating smoother supply chain operations.
- Awareness campaigns are being launched to educate consumers about the health benefits of consuming fin fish, further driving market demand.
- Local fisheries have begun adopting digital platforms for better customer engagement and transparency in sourcing practices.
- Sustainable fishing practices are being increasingly prioritized to address environmental concerns, with local fisheries implementing new technologies to monitor catch and maintain stock levels.
Qatar Fin Fish Market - Key Attractiveness of the Report
- 10 Years of Market Numbers
- Historical Data Starting from 2022 to 2025
- Base Year: 2025
- Forecast Data until 2032
- Key Performance Indicators Impacting the Market
- Major Upcoming Developments and Projects
Key Highlights of the Report:
- Qatar Fin Fish Market Outlook
- Market Size of Qatar Fin Fish Market, 2025
- Forecast of Qatar Fin Fish Market, 2032
- Historical Data and Forecast of Qatar Fin Fish Revenues & Volume for the Period 2022-2032F
- Qatar Fin Fish Market Trend Evolution
- Qatar Fin Fish Market Drivers and Challenges
- Qatar Fin Fish Price Trends
- Qatar Fin Fish Porter's Five Forces
- Qatar Fin Fish Industry Life Cycle
- Historical Data and Forecast of Qatar Fin Fish Market Revenues & Volume By Environment for the Period 2022-2032F
- Historical Data and Forecast of Qatar Fin Fish Market Revenues & Volume By Freshwater for the Period 2022-2032F
- Historical Data and Forecast of Qatar Fin Fish Market Revenues & Volume By Marine Water for the Period 2022-2032F
- Historical Data and Forecast of Qatar Fin Fish Market Revenues & Volume By Brackish Water for the Period 2022-2032F
- Historical Data and Forecast of Qatar Fin Fish Market Revenues & Volume By Fish Type for the Period 2022-2032F
- Historical Data and Forecast of Qatar Fin Fish Market Revenues & Volume By Pompano for the Period 2022-2032F
- Historical Data and Forecast of Qatar Fin Fish Market Revenues & Volume By Snappers for the Period 2022-2032F
- Historical Data and Forecast of Qatar Fin Fish Market Revenues & Volume By Groupers for the Period 2022-2032F
- Historical Data and Forecast of Qatar Fin Fish Market Revenues & Volume By Salmon for the Period 2022-2032F
- Historical Data and Forecast of Qatar Fin Fish Market Revenues & Volume By Milkfish for the Period 2022-2032F
- Historical Data and Forecast of Qatar Fin Fish Market Revenues & Volume By Tuna for the Period 2022-2032F
- Historical Data and Forecast of Qatar Fin Fish Market Revenues & Volume By Catfish for the Period 2022-2032F
- Historical Data and Forecast of Qatar Fin Fish Market Revenues & Volume By Others for the Period 2022-2032F
- Qatar Fin Fish Import Export Trade Statistics
- Market Opportunity Assessment By Environment
- Market Opportunity Assessment By Fish Type
- Qatar Fin Fish Top Companies Market Share
- Qatar Fin Fish Competitive Benchmarking By Technical and Operational Parameters
- Qatar Fin Fish Company Profiles
- Qatar Fin Fish Key Strategic Recommendations
Frequently Asked Questions About the Market Study (FAQs):
The primary source of fin fish in Qatar is through both local fisheries and imports, with a growing focus on sustainable practices to ensure long-term supply.
The pandemic impacted the market by reducing demand in the foodservice sector while increasing sales of frozen fish products as consumers shifted to home cooking.
Government policies are crucial in promoting sustainable fishing, investing in local aquaculture, and ensuring compliance with food safety standards to enhance consumer trust.
Challenges include environmental concerns related to overfishing, reliance on imports, maintaining food safety standards, and the ongoing impacts of the Covid-19 pandemic.
6Wresearch actively monitors the Qatar Fin Fish Market and publishes its comprehensive annual report, highlighting emerging trends, growth drivers, revenue analysis, and forecast outlook. Our insights help businesses to make data-backed strategic decisions with ongoing market dynamics. Our analysts track relevent industries related to the Qatar Fin Fish Market, allowing our clients with actionable intelligence and reliable forecasts tailored to emerging regional needs.
Yes, we provide customisation as per your requirements. To learn more, feel free to contact us on sales@6wresearch.com
1 Executive Summary |
2 Introduction |
2.1 Key Highlights of the Report |
2.2 Report Description |
2.3 Market Scope & Segmentation |
2.4 Research Methodology |
2.5 Assumptions |
3 Qatar Fin Fish Market Overview |
3.1 Qatar Country Macro Economic Indicators |
3.2 Qatar Fin Fish Market Revenues & Volume, 2022 & 2032F |
3.3 Qatar Fin Fish Market - Industry Life Cycle |
3.4 Qatar Fin Fish Market - Porter's Five Forces |
3.5 Qatar Fin Fish Market Revenues & Volume Share, By Environment, 2022 & 2032F |
3.6 Qatar Fin Fish Market Revenues & Volume Share, By Fish Type, 2022 & 2032F |
4 Qatar Fin Fish Market Dynamics |
4.1 Impact Analysis |
4.2 Market Drivers |
4.3 Market Restraints |
5 Qatar Fin Fish Market Trends |
6 Qatar Fin Fish Market, By Types |
6.1 Qatar Fin Fish Market, By Environment |
6.1.1 Overview and Analysis |
6.1.2 Qatar Fin Fish Market Revenues & Volume, By Environment, 2022-2032F |
6.1.3 Qatar Fin Fish Market Revenues & Volume, By Freshwater, 2022-2032F |
6.1.4 Qatar Fin Fish Market Revenues & Volume, By Marine Water, 2022-2032F |
6.1.5 Qatar Fin Fish Market Revenues & Volume, By Brackish Water, 2022-2032F |
6.2 Qatar Fin Fish Market, By Fish Type |
6.2.1 Overview and Analysis |
6.2.2 Qatar Fin Fish Market Revenues & Volume, By Pompano, 2022-2032F |
6.2.3 Qatar Fin Fish Market Revenues & Volume, By Snappers, 2022-2032F |
6.2.4 Qatar Fin Fish Market Revenues & Volume, By Groupers, 2022-2032F |
6.2.5 Qatar Fin Fish Market Revenues & Volume, By Salmon, 2022-2032F |
6.2.6 Qatar Fin Fish Market Revenues & Volume, By Milkfish, 2022-2032F |
6.2.7 Qatar Fin Fish Market Revenues & Volume, By Tuna, 2022-2032F |
6.2.8 Qatar Fin Fish Market Revenues & Volume, By Others, 2022-2032F |
6.2.9 Qatar Fin Fish Market Revenues & Volume, By Others, 2022-2032F |
7 Qatar Fin Fish Market Import-Export Trade Statistics |
7.1 Qatar Fin Fish Market Export to Major Countries |
7.2 Qatar Fin Fish Market Imports from Major Countries |
8 Qatar Fin Fish Market Key Performance Indicators |
9 Qatar Fin Fish Market - Opportunity Assessment |
9.1 Qatar Fin Fish Market Opportunity Assessment, By Environment, 2022 & 2032F |
9.2 Qatar Fin Fish Market Opportunity Assessment, By Fish Type, 2022 & 2032F |
10 Qatar Fin Fish Market - Competitive Landscape |
10.1 Qatar Fin Fish Market Revenue Share, By Companies, 2025 |
10.2 Qatar Fin Fish Market Competitive Benchmarking, By Operating and Technical Parameters |
11 Company Profiles |
12 Recommendations |
13 Disclaimer |
Global Go To Market Strategy - 2030
Export potential enables firms to identify high-growth global markets with greater confidence by combining advanced trade intelligence with a structured quantitative methodology. The framework analyzes emerging demand trends and country-level import patterns while integrating macroeconomic and trade datasets such as GDP and population forecasts, bilateral import–export flows, tariff structures, elasticity differentials between developed and developing economies, geographic distance, and import demand projections. Using weighted trade values from 2020–2024 as the base period to project country-to-country export potential for 2030, these inputs are operationalized through calculated drivers such as gravity model parameters, tariff impact factors, and projected GDP per-capita growth. Through an analysis of hidden potentials, demand hotspots, and market conditions that are most favorable to success, this method enables firms to focus on target countries, maximize returns, and global expansion with data, backed by accuracy.
By factoring in the projected importer demand gap that is currently unmet and could be potential opportunity, it identifies the potential for the Exporter (Country) among 190 countries, against the general trade analysis, which identifies the biggest importer or exporter.
To discover high-growth global markets and optimize your business strategy:
Click Here
Pricing
- Single User License$ 1,995
- Department License$ 2,400
- Site License$ 3,120
- Global License$ 3,795

Leadership Perspectives from Industry Events
Search
Thought Leadership and Analyst Meet


Our Clients
6WResearch In News
- Doha a strategic location for EV manufacturing hub: IPA Qatar
- Demand for luxury TVs surging in the GCC, says Samsung
- Empowering Growth: The Thriving Journey of Bangladesh’s Cable Industry
- Demand for luxury TVs surging in the GCC, says Samsung
- Video call with a traditional healer? Once unthinkable, it’s now common in South Africa
- Intelligent Buildings To Smooth GCC’s Path To Net Zero
Latest Reports
- Taiwan Airport Wireless Infrastructure Market (2026-2032)
- Vietnam Airport Wireless Infrastructure Market (2026-2032)
- Thailand Airport Wireless Infrastructure Market (2026-2032)
- South Korea Airport Wireless Infrastructure Market (2026-2032)
- Romania Airport Wireless Infrastructure Market (2026-2032)
- Qatar Airport Wireless Infrastructure Market (2026-2032)
- Philippines Airport Wireless Infrastructure Market (2026-2032)
- Japan Airport Wireless Infrastructure Market (2026-2032)
- Taiwan Airport Winter Services Market (2026-2032)
- Vietnam Airport Winter Services Market (2026-2032)
Industry Events and Analyst Meet

HIMTEX 2026

India Refining Summit 2026

India EV Show 2026

EV tech India Expo 2026

Auto Tech Asia 2026
Whitepaper
- Middle East & Africa Commercial Security Market Click here to view more.
- Middle East & Africa Fire Safety Systems & Equipment Market Click here to view more.
- GCC Drone Market Click here to view more.
- Middle East Lighting Fixture Market Click here to view more.
- GCC Physical & Perimeter Security Market Click here to view more.