Qatar Non-Metallic Mineral Deposit Market (2026-2032) | Companies, Forecast, Industry, Growth, Analysis, Revenue, Outlook, Trends, Size, Share & Value
Market Forecast By Form Types (Powder Form, Liquid Form), By Applications (Construction, Jewellery, Iron & Ore) And Competitive Landscape
| Product Code: ETC008821 | Publication Date: Jul 2023 | Updated Date: Jun 2026 | Product Type: Report | |
| Publisher: 6Wresearch | Author: Ravi Bhandari | No. of Pages: 70 | No. of Figures: 35 | No. of Tables: 5 |
Qatar Non-Metallic Mineral Deposit Market Summary
The qatar non-metallic mineral deposit market was estimated at USD 240 Million in 2025 and is projected to reach USD 330 Million by 2032, growing at a CAGR of 5.2% from 2026 to 2032.
Qatar Non-Metallic Mineral Deposit Market Year-wise Growth Rate and Key Drivers
This graph highlights how the Qatar Non-Metallic Mineral Deposit Market has steadily grown over the past five years, supported by major growth factors.
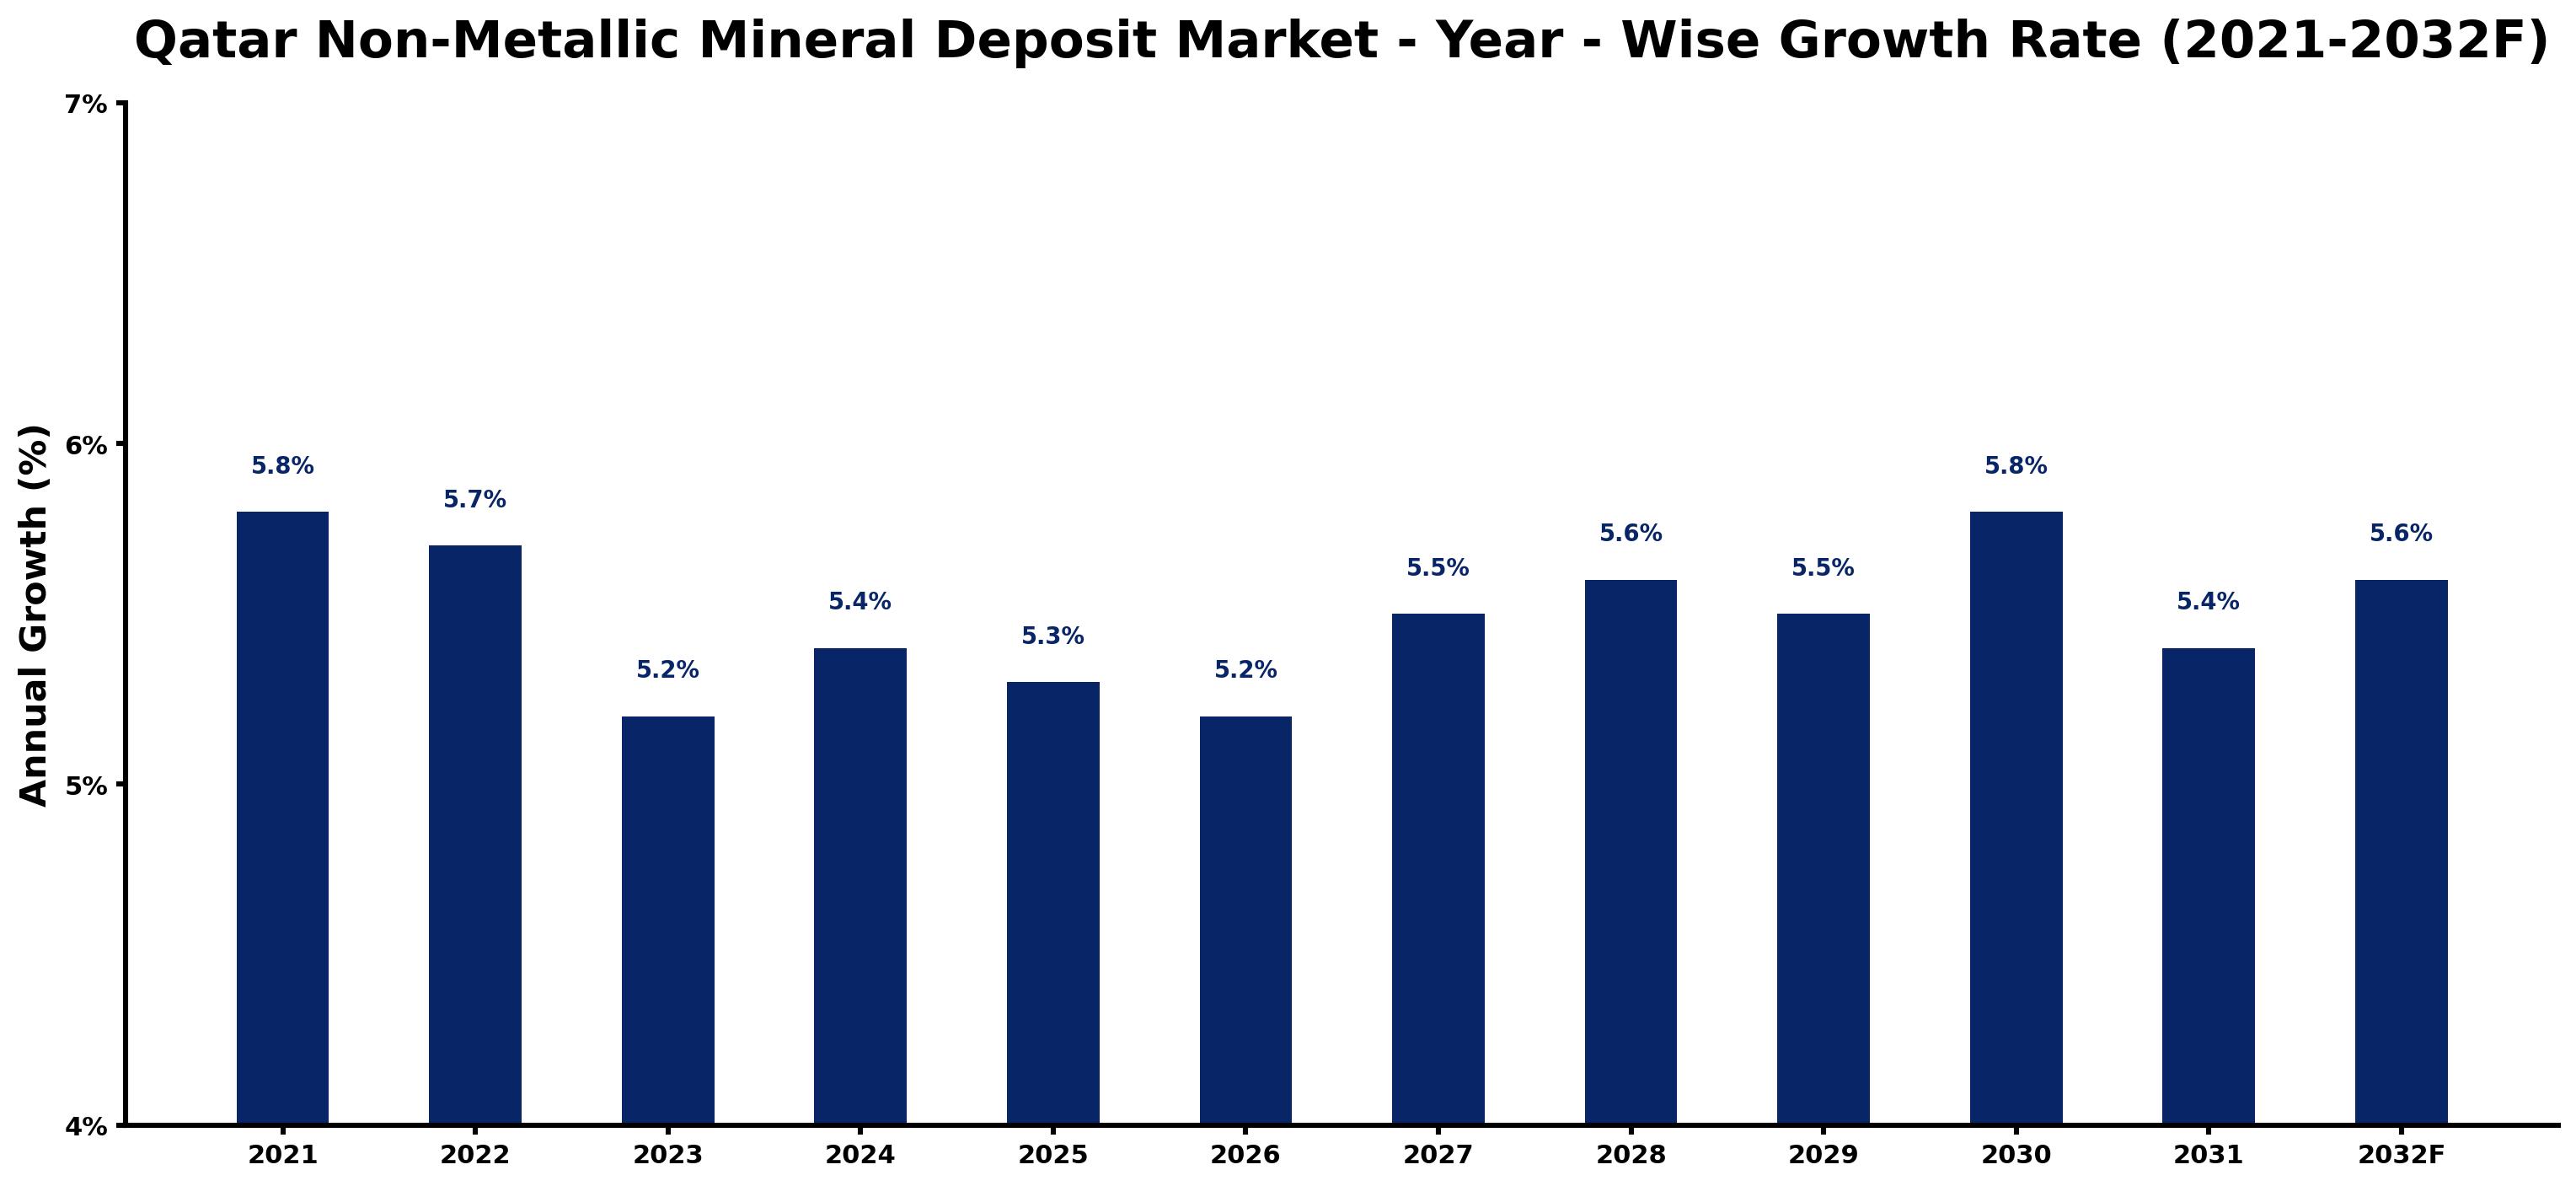
The table below presents the year wise growth rates along with the key drivers influencing the market
| Year | Growth Rate | Major Drivers |
| 2021 | 5.8% | Market conditions stabilized after pandemic disruptions, fostering strategic partnerships among industry players. |
| 2022 | 5.7% | Major infrastructure projects began, creating significant demand for non-metallic mineral resources. |
| 2023 | 5.2% | Local companies expanded operations, focusing on sustainable extraction methods to meet growing needs. |
| 2024 | 5.4% | Investment trends shifted towards renewable energy, influencing materials sourcing and supply chains. |
| 2025 | 5.3% | Technological innovations in extraction improved efficiency, reducing operational costs across the sector. |
| 2026 | 5.2% | Increased urbanization in Qatar spurred construction activities, elevating demand for aggregates and minerals. |
| 2027 | 5.5% | Infrastructure development initiatives aimed at hosting global events further propelled mineral consumption. |
| 2028 | 5.6% | Regional economic diversification strategies encouraged investments in the non-metallic mineral sector. |
| 2029 | 5.5% | Emerging markets in renewable energy created new avenues for non-metallic mineral applications. |
| 2030 | 5.8% | Changes in global supply chains prompted local sourcing of minerals, enhancing market resilience. |
| 2031 | 5.4% | Sustainability practices became essential, with companies adopting eco-friendly extraction technologies. |
| 2032 | 5.6% | Integration of digital technologies streamlined operations, boosting productivity in mineral processing facilities. |
Note - Market size estimations and growth projections presented in this report are based on 6Wresearch's advanced forecasting approach, validated with industry datasets as of June 2026.
Qatar Non-Metallic Mineral Deposit Market Synopsis
The Qatar Non-Metallic Mineral Deposit Market is projected to reach 5.2% and witness significant growth during the forecast period (2026-2032). Despite being a relatively small sector contributing only 4% of the country's GDP in 2017, Qatar's strategic location and rich mineral resources encourage several mining ventures. Upcoming projects are set to amplify growth, leveraging the nation's economic ambitions and positioning within the Arabian Peninsula.
Qatar Non-Metallic Mineral Deposit Market Growth Drivers
The Qatar Non-Metallic Mineral Deposit Market is poised for growth due to a multitude of factors. The primary force driving this market is robust government investment in mining infrastructure and exploration initiatives. Initiatives aimed at bolstering the construction and manufacturing sectors significantly enhance demand for non-metallic minerals, driving production and investment in the mining sector. Furthermore, improvements in logistical capabilities, such as roads and railways, are facilitating easier access to mineral-rich regions, fostering potential projects. Additionally, the strategic implementation of policies supportive of mining activities creates an encouraging environment for both local and foreign investors.
Qatar Non-Metallic Mineral Deposit Market Challenges and Restraints
Despite the promising outlook, the Qatar Non-Metallic Mineral Deposit Market faces several challenges that could impede its trajectory. One significant barrier is the stringent environmental regulations governing mining activities. These regulations necessitate careful adherence, which can delay project timelines and inflate operational costs. Moreover, securing a skilled labor force remains a pressing concern, as availability fluctuates amid competition from other sectors. Additionally, security risks associated with mines located near military installations pose operational hurdles that require strategic mitigation approaches. Addressing these challenges is crucial for unlocking the full potential of Qatar's mineral resources.
Qatar Non-Metallic Mineral Deposit Market Government Investment and Initiatives
The Qatari government has recognized the significance of the non-metallic mineral deposit sector as part of its larger economic diversification strategy. Investments in this sector are part of a broader initiative to reduce dependence on hydrocarbons and foster sustainable local industries. Notably, public spending focuses on enhancing mining infrastructure, such as roads and railroads that facilitate better access to remote mining locations. Additionally, government-backed incentives for exploration activities aim to attract both domestic and foreign investors. Policies conducive to mining operations, including tax breaks and grants for exploration, are being prioritized to stimulate growth in this sector.
Qatar Non-Metallic Mineral Deposit Market Trends and Opportunities
The Qatari non-metallic mineral deposit market is witnessing several emerging trends that present opportunities for stakeholders. The growing emphasis on sustainable mining practices is reshaping operational methodologies, encouraging companies to adopt environmentally friendly technologies and practices. Additionally, the increasing demand for aggregates and construction materials fuels the market, as Qatar continues to invest heavily in infrastructure projects. Partnerships with international firms for knowledge and technology transfer present avenues for innovation and efficiency improvements. Furthermore, as regional construction activities ramp up, the market stands to benefit significantly from increased demand for non-metallic mineral products.
Qatar Non-Metallic Mineral Deposit Market Latest Developments (May 2025 - June 2026)
In the period spanning from May 2025 to June 2026, the Qatar Non-Metallic Mineral Deposit Market has experienced significant progress. The government has initiated several major mining projects, focusing on the extraction of non-metallic minerals vital for infrastructure development. Enhanced exploration activities have been reported, aiming to identify new reserves capable of meeting rising domestic demand. Furthermore, collaboration between local authorities and international mining firms has been fostered to boost technological advancements in extraction and processing methods. These developments are indicative of the government's commitment to advancing the sector and capitalizing on its abundant mineral resources.
Qatar Non-Metallic Mineral Deposit Market - Key Attractiveness of the Report
- 10 Years of Market Numbers
- Historical Data Starting from 2022 to 2025
- Base Year: 2025
- Forecast Data until 2032
- Key Performance Indicators Impacting the Market
- Major Upcoming Developments and Projects
Key Highlights of the Report:
- Qatar Non-Metallic Mineral Deposit Market Outlook
- Market Size of Qatar Non-Metallic Mineral Deposit Market, 2025
- Forecast of Qatar Non-Metallic Mineral Deposit Market, 2032
- Historical Data and Forecast of Qatar Non-Metallic Mineral Deposit Revenues & Volume for the Period 2022-2032F
- Qatar Non-Metallic Mineral Deposit Market Trend Evolution
- Qatar Non-Metallic Mineral Deposit Market Drivers and Challenges
- Qatar Non-Metallic Mineral Deposit Price Trends
- Qatar Non-Metallic Mineral Deposit Porter's Five Forces
- Qatar Non-Metallic Mineral Deposit Industry Life Cycle
- Historical Data and Forecast of Qatar Non-Metallic Mineral Deposit Market Revenues & Volume By Form Types for the Period 2022-2032F
- Historical Data and Forecast of Qatar Non-Metallic Mineral Deposit Market Revenues & Volume By Powder Form for the Period 2022-2032F
- Historical Data and Forecast of Qatar Non-Metallic Mineral Deposit Market Revenues & Volume By Liquid Form for the Period 2022-2032F
- Historical Data and Forecast of Qatar Non-Metallic Mineral Deposit Market Revenues & Volume By Applications for the Period 2022-2032F
- Historical Data and Forecast of Qatar Non-Metallic Mineral Deposit Market Revenues & Volume By Construction for the Period 2022-2032F
- Historical Data and Forecast of Qatar Non-Metallic Mineral Deposit Market Revenues & Volume By Jewellery for the Period 2022-2032F
- Historical Data and Forecast of Qatar Non-Metallic Mineral Deposit Market Revenues & Volume By Iron & Ore for the Period 2022-2032F
- Qatar Non-Metallic Mineral Deposit Import Export Trade Statistics
- Market Opportunity Assessment By Form Types
- Market Opportunity Assessment By Applications
- Qatar Non-Metallic Mineral Deposit Top Companies Market Share
- Qatar Non-Metallic Mineral Deposit Competitive Benchmarking By Technical and Operational Parameters
- Qatar Non-Metallic Mineral Deposit Company Profiles
- Qatar Non-Metallic Mineral Deposit Key Strategic Recommendations
Frequently Asked Questions About the Market Study (FAQs):
The growth is primarily driven by government investment in mining infrastructure, increasing demand from construction and manufacturing sectors, and improvements in logistics for mineral access.
Challenges include stringent environmental regulations, securing sufficient labor, and navigating security issues near military installations.
The government is investing in infrastructure improvements, offering incentives for exploration, and implementing policies to create a conducive environment for mining activities.
Recent developments include the launch of major mining projects, increased exploration activities, and partnerships with international firms aimed at technological enhancement.
6Wresearch actively monitors the Qatar Non-Metallic Mineral Deposit Market and publishes its comprehensive annual report, highlighting emerging trends, growth drivers, revenue analysis, and forecast outlook. Our insights help businesses to make data-backed strategic decisions with ongoing market dynamics. Our analysts track relevent industries related to the Qatar Non-Metallic Mineral Deposit Market, allowing our clients with actionable intelligence and reliable forecasts tailored to emerging regional needs.
Yes, we provide customisation as per your requirements. To learn more, feel free to contact us on sales@6wresearch.com
1 Executive Summary |
2 Introduction |
2.1 Key Highlights of the Report |
2.2 Report Description |
2.3 Market Scope & Segmentation |
2.4 Research Methodology |
2.5 Assumptions |
3 Qatar Non-Metallic Mineral Deposit Market Overview |
3.1 Qatar Country Macro Economic Indicators |
3.2 Qatar Non-Metallic Mineral Deposit Market Revenues & Volume, 2022 & 2032F |
3.3 Qatar Non-Metallic Mineral Deposit Market - Industry Life Cycle |
3.4 Qatar Non-Metallic Mineral Deposit Market - Porter's Five Forces |
3.5 Qatar Non-Metallic Mineral Deposit Market Revenues & Volume Share, By Form Types, 2022 & 2032F |
3.6 Qatar Non-Metallic Mineral Deposit Market Revenues & Volume Share, By Applications, 2022 & 2032F |
4 Qatar Non-Metallic Mineral Deposit Market Dynamics |
4.1 Impact Analysis |
4.2 Market Drivers |
4.2.1 Increasing construction activities in Qatar |
4.2.2 Growing demand for non-metallic minerals in the manufacturing sector |
4.2.3 Government initiatives to promote mining industry in Qatar |
4.3 Market Restraints |
4.3.1 Environmental regulations impacting mining operations |
4.3.2 Fluctuating global prices of non-metallic minerals |
4.3.3 Limited availability of skilled labor in the mining sector in Qatar |
5 Qatar Non-Metallic Mineral Deposit Market Trends |
6 Qatar Non-Metallic Mineral Deposit Market, By Types |
6.1 Qatar Non-Metallic Mineral Deposit Market, By Form Types |
6.1.1 Overview and Analysis |
6.1.2 Qatar Non-Metallic Mineral Deposit Market Revenues & Volume, By Form Types, 2022-2032F |
6.1.3 Qatar Non-Metallic Mineral Deposit Market Revenues & Volume, By Powder Form, 2022-2032F |
6.1.4 Qatar Non-Metallic Mineral Deposit Market Revenues & Volume, By Liquid Form, 2022-2032F |
6.2 Qatar Non-Metallic Mineral Deposit Market, By Applications |
6.2.1 Overview and Analysis |
6.2.2 Qatar Non-Metallic Mineral Deposit Market Revenues & Volume, By Construction, 2022-2032F |
6.2.3 Qatar Non-Metallic Mineral Deposit Market Revenues & Volume, By Jewellery, 2022-2032F |
6.2.4 Qatar Non-Metallic Mineral Deposit Market Revenues & Volume, By Iron & Ore, 2022-2032F |
7 Qatar Non-Metallic Mineral Deposit Market Import-Export Trade Statistics |
7.1 Qatar Non-Metallic Mineral Deposit Market Export to Major Countries |
7.2 Qatar Non-Metallic Mineral Deposit Market Imports from Major Countries |
8 Qatar Non-Metallic Mineral Deposit Market Key Performance Indicators |
8.1 Exploration and extraction efficiency |
8.2 Investment in research and development for new mineral deposits |
8.3 Adoption of sustainable mining practices |
8.4 Utilization rate of existing mining sites |
8.5 Compliance with local and international mining regulations |
9 Qatar Non-Metallic Mineral Deposit Market - Opportunity Assessment |
9.1 Qatar Non-Metallic Mineral Deposit Market Opportunity Assessment, By Form Types, 2022 & 2032F |
9.2 Qatar Non-Metallic Mineral Deposit Market Opportunity Assessment, By Applications, 2022 & 2032F |
10 Qatar Non-Metallic Mineral Deposit Market - Competitive Landscape |
10.1 Qatar Non-Metallic Mineral Deposit Market Revenue Share, By Companies, 2025 |
10.2 Qatar Non-Metallic Mineral Deposit Market Competitive Benchmarking, By Operating and Technical Parameters |
11 Company Profiles |
12 Recommendations |
13 Disclaimer |
Global Go To Market Strategy - 2030
Export potential enables firms to identify high-growth global markets with greater confidence by combining advanced trade intelligence with a structured quantitative methodology. The framework analyzes emerging demand trends and country-level import patterns while integrating macroeconomic and trade datasets such as GDP and population forecasts, bilateral import–export flows, tariff structures, elasticity differentials between developed and developing economies, geographic distance, and import demand projections. Using weighted trade values from 2020–2024 as the base period to project country-to-country export potential for 2030, these inputs are operationalized through calculated drivers such as gravity model parameters, tariff impact factors, and projected GDP per-capita growth. Through an analysis of hidden potentials, demand hotspots, and market conditions that are most favorable to success, this method enables firms to focus on target countries, maximize returns, and global expansion with data, backed by accuracy.
By factoring in the projected importer demand gap that is currently unmet and could be potential opportunity, it identifies the potential for the Exporter (Country) among 190 countries, against the general trade analysis, which identifies the biggest importer or exporter.
To discover high-growth global markets and optimize your business strategy:
Click Here
Pricing
- Single User License$ 1,995
- Department License$ 2,400
- Site License$ 3,120
- Global License$ 3,795

Leadership Perspectives from Industry Events
Search
Thought Leadership and Analyst Meet


Our Clients
6WResearch In News
- India Air Conditioner Market Set for Strong Rebound in 2026 After Weather-Led Correction and GST-Driven Recovery: 6Wresearch
- ADAS in India: How Automatic Emergency Braking, Blind Spot Detection & Driver Monitoring are Transforming Road Safety
- Doha a strategic location for EV manufacturing hub: IPA Qatar
- Demand for luxury TVs surging in the GCC, says Samsung
- Empowering Growth: The Thriving Journey of Bangladesh’s Cable Industry
- Demand for luxury TVs surging in the GCC, says Samsung
Latest Reports
- Nicaragua RPG Gaming Market (2026-2032)
- New Zealand RPG Gaming Market (2026-2032)
- Netherlands RPG Gaming Market (2026-2032)
- Nauru RPG Gaming Market (2026-2032)
- Namibia RPG Gaming Market (2026-2032)
- Mozambique RPG Gaming Market (2026-2032)
- Montenegro RPG Gaming Market (2026-2032)
- Mongolia RPG Gaming Market (2026-2032)
- Monaco RPG Gaming Market (2026-2032)
- Micronesia RPG Gaming Market (2026-2032)
Industry Events and Analyst Meet

EV India Expo 2026

HIMTEX 2026

India Refining Summit 2026

India EV Show 2026

EV tech India Expo 2026
Whitepaper
- Middle East & Africa Commercial Security Market Click here to view more.
- Middle East & Africa Fire Safety Systems & Equipment Market Click here to view more.
- GCC Drone Market Click here to view more.
- Middle East Lighting Fixture Market Click here to view more.
- GCC Physical & Perimeter Security Market Click here to view more.