Qatar Paper & Paperboard Market (2026-2032) | Forecast, Share, Size, Outlook, Trends, Value, Companies, Analysis, Industry, Growth & Revenue
Market Forecast By Types (Flexible Paper Packaging, Boxboard, Corrugated Box, Others), By Grade Types (Coated Unbleached ‘kraft’ Paperboard, White Line Chipboard (WLC), Label Paper, Folding Box Board (FBB), Solid Bleached Sulfate (SBS), Others), By Applications (Food, Beverages, Healthcare, Personal Care, Home Care, Others) And Competitive Landscape
| Product Code: ETC007201 | Publication Date: Jul 2023 | Updated Date: Jun 2026 | Product Type: Report | |
| Publisher: 6Wresearch | Author: Ravi Bhandari | No. of Pages: 70 | No. of Figures: 35 | No. of Tables: 5 |
Qatar Paper & Paperboard Market Summary
The qatar paper & paperboard market was estimated at USD 431 Million in 2025 and is projected to reach USD 622 Million by 2032, growing at a CAGR of 6.2% from 2026 to 2032.
Qatar Paper & Paperboard Market Growth Rate Analysis (2021-2032)
The Qatar Paper & Paperboard Market has demonstrated a stable growth pattern, achieving annual growth rates of 6.3% in 2021 and 2023, with a slight decline to 6.1% in 2022. As we move into 2024, growth is projected to remain steady at 6.3%, increasing marginally to 6.4% in 2025. This growth can be attributed to rising consumer demand fueled by expanding retail and packaging sectors, alongside significant investments in manufacturing infrastructure. Furthermore, the ongoing digitalization of production processes is enhancing efficiency and reducing costs, thereby supporting competitiveness. Although growth rates fluctuate slightly, the overall trend remains positive, reflecting Qatar's commitment to diversifying its economy and boosting local production capabilities.
Qatar Paper & Paperboard Market Year-wise Growth Rate and Key Drivers
This graph highlights how the Qatar Paper & Paperboard Market has steadily grown over the past five years, supported by major growth factors.
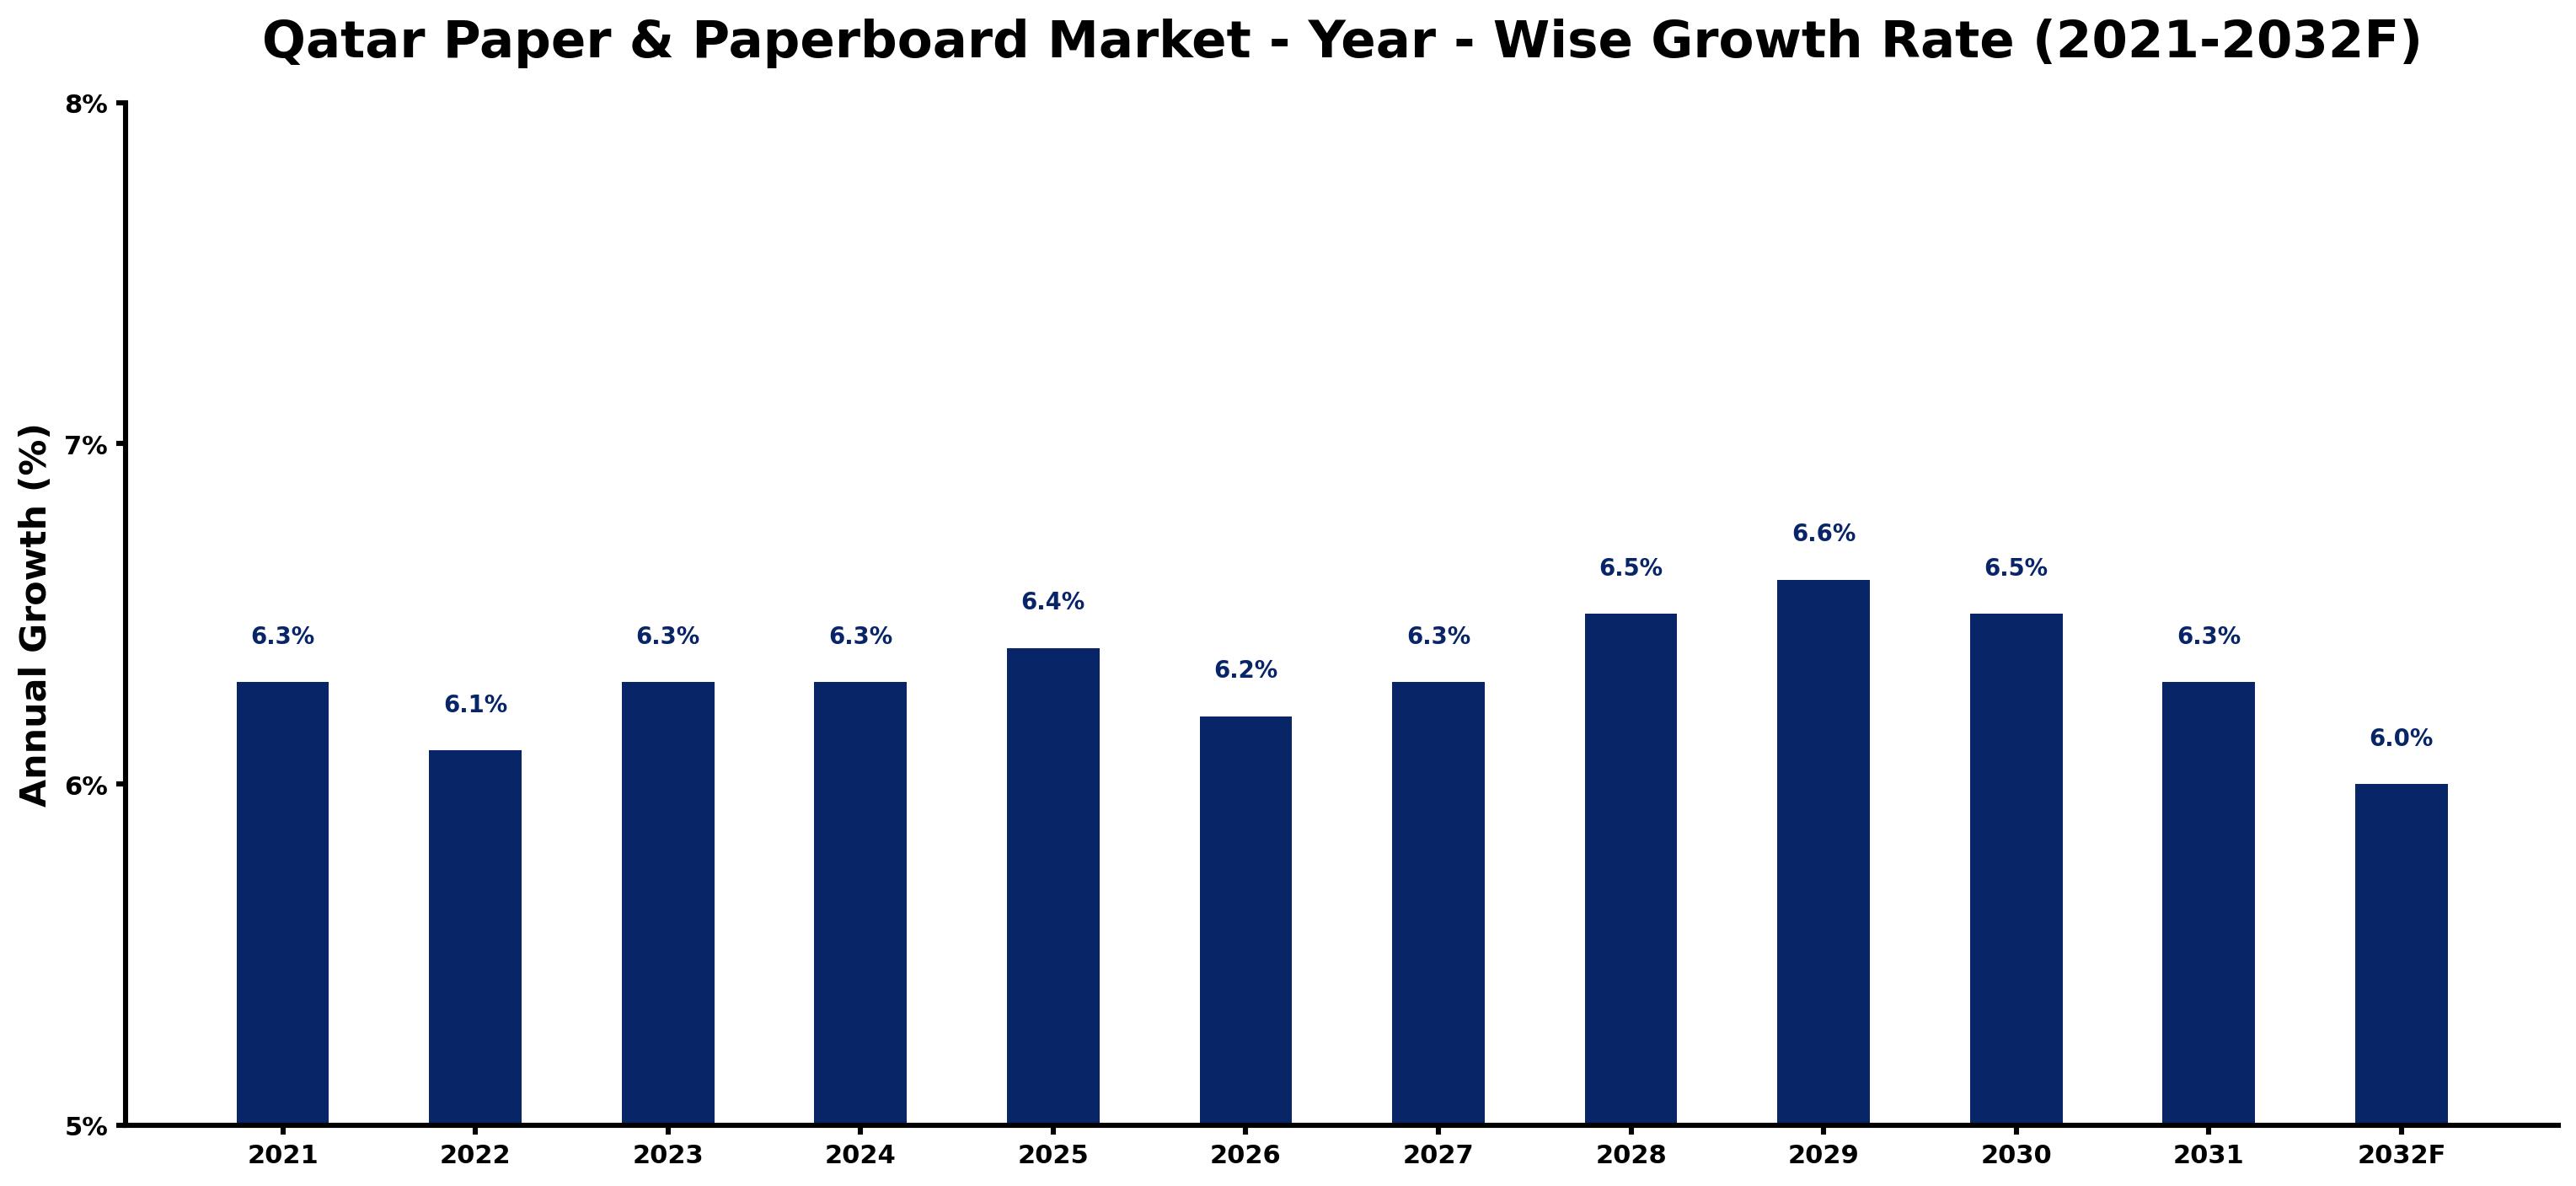
The table below presents the year wise growth rates along with the key drivers influencing the market
| Year | Growth Rate | Major Drivers |
| 2021 | 6.3% | Post-lockdown retail projects have stimulated demand for packaging and services. |
| 2022 | 6.1% | Increased construction activities in Qatar fostered a surge in paperboard utilization. |
| 2023 | 6.3% | Local manufacturing initiatives align with sustainability goals, boosting the paper sector's appeal. |
| 2024 | 6.3% | E-commerce expansion encourages diverse packaging solutions for delivery services. |
| 2025 | 6.4% | Shifts towards environmentally-friendly products attract eco-conscious consumers and businesses alike. |
| 2026 | 6.2% | Local firms prioritize automation, enhancing efficiency in paper production processes. |
| 2027 | 6.3% | Integration of digital technologies supports innovative designs in paper products. |
| 2028 | 6.5% | Regional collaboration within the GCC fosters knowledge-sharing in sustainable practices. |
| 2029 | 6.6% | Consumer preferences increasingly favor recycled materials, impacting production decisions. |
| 2030 | 6.5% | Emerging market trends highlight the importance of brand differentiation through packaging. |
| 2031 | 6.3% | Urban development projects require customized packaging solutions for various industries. |
| 2032 | 6.0% | Investment in R&D focuses on bio-based materials, transforming product offerings significantly. |
Note - Market size estimations and growth projections presented in this report are based on 6Wresearch's advanced forecasting approach, validated with industry datasets as of June 2026.
Qatar Paper & Paperboard Market Synopsis
The Qatar Paper Paperboard Market is projected to reach 6.2% and witness significant growth during the forecast period (2026-2032). This anticipated growth, at a compound annual growth rate (CAGR) of 3.6%, is driven by several factors including the rising consumption of disposable products, increased demand for corrugated packaging solutions, rapid urbanization, and a burgeoning e-commerce sector. Furthermore, the introduction of innovative products within the market enhances this growth trajectory.
Qatar Paper & Paperboard Market Growth Drivers
Various dynamic elements contribute to the expansion of the Qatar Paper & Paperboard Market. Among them are:
- Changing consumer lifestyles are significantly increasing the demand for disposable products. The preference for convenience foods, such as ready meals and packaged snacks, necessitates effective packaging solutions to ensure protection from contamination during transportation and storage.
- Increased demand for corrugated packaging materials is fueled by the booming e-commerce industry, which has seen a notable surge during recent years. This demand is primarily driven by the need for secure and robust packaging to ensure product integrity during transit.
- Urbanization and industrialization are accelerating at an unprecedented pace in Qatar, creating a significant need for packaging materials across various sectors, including food and beverage, healthcare, and consumer goods.
- Technological advancements, leading to the introduction of innovative paper and paperboard products, contribute to customer satisfaction and increased market share for manufacturers.
- Government initiatives focused on infrastructure development and support for the packaging industry further bolster market growth and attract investments.
Qatar Paper & Paperboard Market Challenges and Restraints
Despite the promising outlook for the Qatar Paper & Paperboard Market, several challenges may impede growth:
- The rising competition from digital media and electronic communication has altered consumer preferences and resulted in a decline in the use of traditional paper-based materials, impacting demand negatively.
- Environmental concerns are increasingly becoming a priority for consumers and businesses alike. The heightened awareness regarding climate change necessitates the development of more sustainable and recyclable packaging solutions.
- The pressure to transition towards eco-friendly production practices poses a challenge for manufacturers who must invest in technologies to reduce their environmental footprint.
- Market players may face hurdles in sourcing high-quality raw materials as they transition to more sustainable options, potentially affecting production costs and timelines.
- Regulatory compliance concerning environmental standards can impose additional operational costs, further complicating market dynamics.
Qatar Paper & Paperboard Market Government Investment and Initiatives
The government of Qatar has recognized the importance of a sustainable economy and initiated various policies to enhance the development of the paper and paperboard sector. This includes public spending on infrastructure projects, which directly stimulates market demand for packaging solutions. Key initiatives include:
- Promotion of recycling programs aimed at reducing waste and encouraging the adoption of eco-friendly packaging alternatives in compliance with global environmental standards.
- Investment incentives for companies that align with government sustainability goals, particularly those focusing on innovative recycling processes and the use of renewable resources.
- Support for research and development initiatives that aim to create sustainable and biodegradable packaging solutions, addressing both consumer demand and regulatory requirements.
- Implementation of strict regulations concerning waste management and environmental impact, compelling manufacturers to adapt sustainable practices in their operations.
- Collaboration with industry stakeholders to develop a comprehensive framework that fosters sustainable growth and innovation in the paper and paperboard market.
Qatar Paper & Paperboard Market Latest Developments (May 2025 - June 2026)
Recent developments in the Qatar Paper & Paperboard Market indicate a shift towards sustainability and innovation. During the period from May 2025 to June 2026, the industry observed:
- A notable increase in the adoption of sustainable practices among manufacturers, with a focus on eco-friendly materials and production processes to meet rising consumer expectations.
- Collaborations between governmental bodies and packaging companies aimed at enhancing recycling capabilities and developing biodegradable product lines.
- The introduction of cutting-edge technologies in manufacturing processes, resulting in higher efficiency and reduced environmental impact.
- An ongoing emphasis on product innovation, particularly in the development of advanced corrugated packaging solutions designed to enhance the user experience while minimizing environmental footprints.
- Consistent alignment of industry operations with international sustainability standards, positioning the Qatar Paper & Paperboard Market as a progressive player in the global arena.
Qatar Paper & Paperboard Market - Key Attractiveness of the Report
- 10 Years of Market Numbers
- Historical Data Starting from 2022 to 2025
- Base Year: 2025
- Forecast Data until 2032
- Key Performance Indicators Impacting the Market
- Major Upcoming Developments and Projects
Key Highlights of the Report:
- Qatar Paper & Paperboard Market Outlook
- Market Size of Qatar Paper & Paperboard Market, 2025
- Forecast of Qatar Paper & Paperboard Market, 2032
- Historical Data and Forecast of Qatar Paper & Paperboard Revenues & Volume for the Period 2022-2032F
- Qatar Paper & Paperboard Market Trend Evolution
- Qatar Paper & Paperboard Market Drivers and Challenges
- Qatar Paper & Paperboard Price Trends
- Qatar Paper & Paperboard Porter's Five Forces
- Qatar Paper & Paperboard Industry Life Cycle
- Historical Data and Forecast of Qatar Paper & Paperboard Market Revenues & Volume By Types for the Period 2022-2032F
- Historical Data and Forecast of Qatar Paper & Paperboard Market Revenues & Volume By Flexible Paper Packaging for the Period 2022-2032F
- Historical Data and Forecast of Qatar Paper & Paperboard Market Revenues & Volume By Boxboard for the Period 2022-2032F
- Historical Data and Forecast of Qatar Paper & Paperboard Market Revenues & Volume By Corrugated Box for the Period 2022-2032F
- Historical Data and Forecast of Qatar Paper & Paperboard Market Revenues & Volume By Others for the Period 2022-2032F
- Historical Data and Forecast of Qatar Paper & Paperboard Market Revenues & Volume By Grade Types for the Period 2022-2032F
- Historical Data and Forecast of Qatar Paper & Paperboard Market Revenues & Volume By Coated Unbleached ?kraft? Paperboard for the Period 2022-2032F
- Historical Data and Forecast of Qatar Paper & Paperboard Market Revenues & Volume By White Line Chipboard (WLC) for the Period 2022-2032F
- Historical Data and Forecast of Qatar Paper & Paperboard Market Revenues & Volume By Label Paper for the Period 2022-2032F
- Historical Data and Forecast of Qatar Paper & Paperboard Market Revenues & Volume By Folding Box Board (FBB) for the Period 2022-2032F
- Historical Data and Forecast of Qatar Paper & Paperboard Market Revenues & Volume By Solid Bleached Sulfate (SBS) for the Period 2022-2032F
- Historical Data and Forecast of Qatar Paper & Paperboard Market Revenues & Volume By Others for the Period 2022-2032F
- Historical Data and Forecast of Qatar Paper & Paperboard Market Revenues & Volume By Applications for the Period 2022-2032F
- Historical Data and Forecast of Qatar Paper & Paperboard Market Revenues & Volume By Food for the Period 2022-2032F
- Historical Data and Forecast of Qatar Paper & Paperboard Market Revenues & Volume By Beverages for the Period 2022-2032F
- Historical Data and Forecast of Qatar Paper & Paperboard Market Revenues & Volume By Healthcare for the Period 2022-2032F
- Historical Data and Forecast of Qatar Paper & Paperboard Market Revenues & Volume By Personal Care for the Period 2022-2032F
- Historical Data and Forecast of Qatar Paper & Paperboard Market Revenues & Volume By Home Care for the Period 2022-2032F
- Historical Data and Forecast of Qatar Paper & Paperboard Market Revenues & Volume By Others for the Period 2022-2032F
- Qatar Paper & Paperboard Import Export Trade Statistics
- Market Opportunity Assessment By Types
- Market Opportunity Assessment By Grade Types
- Market Opportunity Assessment By Applications
- Qatar Paper & Paperboard Top Companies Market Share
- Qatar Paper & Paperboard Competitive Benchmarking By Technical and Operational Parameters
- Qatar Paper & Paperboard Company Profiles
- Qatar Paper & Paperboard Key Strategic Recommendations
Frequently Asked Questions About the Market Study (FAQs):
The Qatar Paper & Paperboard Market is expected to grow at a CAGR of 3.6% from 2026 to 2032.
Key drivers of growth include increasing consumption of disposable products, rising demand for corrugated packaging, rapid urbanization, and advancements in product innovation.
The market faces challenges from digital media competition, environmental concerns, and increasing regulatory compliance requirements.
The pandemic shifted demand from writing and printing papers to cardboard packaging due to the surge in online shopping and food delivery services.
6Wresearch actively monitors the Qatar Paper & Paperboard Market and publishes its comprehensive annual report, highlighting emerging trends, growth drivers, revenue analysis, and forecast outlook. Our insights help businesses to make data-backed strategic decisions with ongoing market dynamics. Our analysts track relevent industries related to the Qatar Paper & Paperboard Market, allowing our clients with actionable intelligence and reliable forecasts tailored to emerging regional needs.
Yes, we provide customisation as per your requirements. To learn more, feel free to contact us on sales@6wresearch.com
1 Executive Summary |
2 Introduction |
2.1 Key Highlights of the Report |
2.2 Report Description |
2.3 Market Scope & Segmentation |
2.4 Research Methodology |
2.5 Assumptions |
3 Qatar Paper & Paperboard Market Overview |
3.1 Qatar Country Macro Economic Indicators |
3.2 Qatar Paper & Paperboard Market Revenues & Volume, 2022 & 2032F |
3.3 Qatar Paper & Paperboard Market - Industry Life Cycle |
3.4 Qatar Paper & Paperboard Market - Porter's Five Forces |
3.5 Qatar Paper & Paperboard Market Revenues & Volume Share, By Types, 2022 & 2032F |
3.6 Qatar Paper & Paperboard Market Revenues & Volume Share, By Grade Types, 2022 & 2032F |
3.7 Qatar Paper & Paperboard Market Revenues & Volume Share, By Applications, 2022 & 2032F |
4 Qatar Paper & Paperboard Market Dynamics |
4.1 Impact Analysis |
4.2 Market Drivers |
4.3 Market Restraints |
5 Qatar Paper & Paperboard Market Trends |
6 Qatar Paper & Paperboard Market, By Types |
6.1 Qatar Paper & Paperboard Market, By Types |
6.1.1 Overview and Analysis |
6.1.2 Qatar Paper & Paperboard Market Revenues & Volume, By Types, 2022-2032F |
6.1.3 Qatar Paper & Paperboard Market Revenues & Volume, By Flexible Paper Packaging, 2022-2032F |
6.1.4 Qatar Paper & Paperboard Market Revenues & Volume, By Boxboard, 2022-2032F |
6.1.5 Qatar Paper & Paperboard Market Revenues & Volume, By Corrugated Box, 2022-2032F |
6.1.6 Qatar Paper & Paperboard Market Revenues & Volume, By Others, 2022-2032F |
6.2 Qatar Paper & Paperboard Market, By Grade Types |
6.2.1 Overview and Analysis |
6.2.2 Qatar Paper & Paperboard Market Revenues & Volume, By Coated Unbleached ?kraft? Paperboard, 2022-2032F |
6.2.3 Qatar Paper & Paperboard Market Revenues & Volume, By White Line Chipboard (WLC), 2022-2032F |
6.2.4 Qatar Paper & Paperboard Market Revenues & Volume, By Label Paper, 2022-2032F |
6.2.5 Qatar Paper & Paperboard Market Revenues & Volume, By Folding Box Board (FBB), 2022-2032F |
6.2.6 Qatar Paper & Paperboard Market Revenues & Volume, By Solid Bleached Sulfate (SBS), 2022-2032F |
6.2.7 Qatar Paper & Paperboard Market Revenues & Volume, By Others, 2022-2032F |
6.3 Qatar Paper & Paperboard Market, By Applications |
6.3.1 Overview and Analysis |
6.3.2 Qatar Paper & Paperboard Market Revenues & Volume, By Food, 2022-2032F |
6.3.3 Qatar Paper & Paperboard Market Revenues & Volume, By Beverages, 2022-2032F |
6.3.4 Qatar Paper & Paperboard Market Revenues & Volume, By Healthcare, 2022-2032F |
6.3.5 Qatar Paper & Paperboard Market Revenues & Volume, By Personal Care, 2022-2032F |
6.3.6 Qatar Paper & Paperboard Market Revenues & Volume, By Home Care, 2022-2032F |
6.3.7 Qatar Paper & Paperboard Market Revenues & Volume, By Others, 2022-2032F |
7 Qatar Paper & Paperboard Market Import-Export Trade Statistics |
7.1 Qatar Paper & Paperboard Market Export to Major Countries |
7.2 Qatar Paper & Paperboard Market Imports from Major Countries |
8 Qatar Paper & Paperboard Market Key Performance Indicators |
9 Qatar Paper & Paperboard Market - Opportunity Assessment |
9.1 Qatar Paper & Paperboard Market Opportunity Assessment, By Types, 2022 & 2032F |
9.2 Qatar Paper & Paperboard Market Opportunity Assessment, By Grade Types, 2022 & 2032F |
9.3 Qatar Paper & Paperboard Market Opportunity Assessment, By Applications, 2022 & 2032F |
10 Qatar Paper & Paperboard Market - Competitive Landscape |
10.1 Qatar Paper & Paperboard Market Revenue Share, By Companies, 2025 |
10.2 Qatar Paper & Paperboard Market Competitive Benchmarking, By Operating and Technical Parameters |
11 Company Profiles |
12 Recommendations |
13 Disclaimer |
Global Go To Market Strategy - 2030
Export potential enables firms to identify high-growth global markets with greater confidence by combining advanced trade intelligence with a structured quantitative methodology. The framework analyzes emerging demand trends and country-level import patterns while integrating macroeconomic and trade datasets such as GDP and population forecasts, bilateral import–export flows, tariff structures, elasticity differentials between developed and developing economies, geographic distance, and import demand projections. Using weighted trade values from 2020–2024 as the base period to project country-to-country export potential for 2030, these inputs are operationalized through calculated drivers such as gravity model parameters, tariff impact factors, and projected GDP per-capita growth. Through an analysis of hidden potentials, demand hotspots, and market conditions that are most favorable to success, this method enables firms to focus on target countries, maximize returns, and global expansion with data, backed by accuracy.
By factoring in the projected importer demand gap that is currently unmet and could be potential opportunity, it identifies the potential for the Exporter (Country) among 190 countries, against the general trade analysis, which identifies the biggest importer or exporter.
To discover high-growth global markets and optimize your business strategy:
Click Here
Pricing
- Single User License$ 1,995
- Department License$ 2,400
- Site License$ 3,120
- Global License$ 3,795

Leadership Perspectives from Industry Events
Search
Thought Leadership and Analyst Meet


Our Clients
6WResearch In News
- India Air Conditioner Market Set for Strong Rebound in 2026 After Weather-Led Correction and GST-Driven Recovery: 6Wresearch
- ADAS in India: How Automatic Emergency Braking, Blind Spot Detection & Driver Monitoring are Transforming Road Safety
- Doha a strategic location for EV manufacturing hub: IPA Qatar
- Demand for luxury TVs surging in the GCC, says Samsung
- Empowering Growth: The Thriving Journey of Bangladesh’s Cable Industry
- Demand for luxury TVs surging in the GCC, says Samsung
Latest Reports
- Nicaragua RPG Gaming Market (2026-2032)
- New Zealand RPG Gaming Market (2026-2032)
- Netherlands RPG Gaming Market (2026-2032)
- Nauru RPG Gaming Market (2026-2032)
- Namibia RPG Gaming Market (2026-2032)
- Mozambique RPG Gaming Market (2026-2032)
- Montenegro RPG Gaming Market (2026-2032)
- Mongolia RPG Gaming Market (2026-2032)
- Monaco RPG Gaming Market (2026-2032)
- Micronesia RPG Gaming Market (2026-2032)
Industry Events and Analyst Meet

HIMTEX 2026

India Refining Summit 2026

India EV Show 2026

EV tech India Expo 2026

Auto Tech Asia 2026
Whitepaper
- Middle East & Africa Commercial Security Market Click here to view more.
- Middle East & Africa Fire Safety Systems & Equipment Market Click here to view more.
- GCC Drone Market Click here to view more.
- Middle East Lighting Fixture Market Click here to view more.
- GCC Physical & Perimeter Security Market Click here to view more.