Qatar Potassium Cyanate Market (2026-2032) Outlook | Trends, Industry, Size, Share, Companies, Value, Forecast, Revenue, Growth & Analysis
Market Forecast By Types (Low Purity, High Purity), By Applications (Gold Plating, Electronic Devices, Jewelry and Watches, Fashion items, Others) And Competitive Landscape
| Product Code: ETC204473 | Publication Date: May 2022 | Updated Date: Jul 2026 | Product Type: Market Research Report | |
| Publisher: 6Wresearch | Author: Ravi Bhandari | No. of Pages: 60 | No. of Figures: 40 | No. of Tables: 7 |
Qatar Potassium Cyanate Market Size, Share & Growth Rate
The Qatar Potassium Cyanate Market was estimated at USD 346 Million in 2025 and is projected to reach USD 473 Million by 2032, growing at a CAGR of 4.6% from 2026 to 2032. This steady growth trajectory is fueled by the increasing demand for potassium cyanate in sectors such as textile dyes, water treatment agents, and chemical synthesis. As industrial processes evolve and new applications emerge, the versatility of potassium cyanate is expected to further bolster its consumption across various industries in Qatar.
Qatar Potassium Cyanate Market Growth Rate Analysis (2021-2032)
The Qatar Potassium Cyanate market has demonstrated stable growth, with an annual increase of 5.5% in 2021 and a slight adjustment to 5.2% in 2022. This growth is largely driven by rising consumer demand in sectors such as agriculture and pharmaceuticals, alongside investments in chemical manufacturing infrastructure. The market rebounded to a 5.5% growth rate in 2023, reflecting ongoing efforts in digitalization and efficient production processes. While 2024 showcased a modest dip to 5.4%, subsequent years from 2025 to 2027 indicate fluctuations around 5.1% to 5.2%. The outlook improves again in 2028, aligning with increased industrial activity and government policy support aimed at energy transition, culminating in a strong 5.7% growth by 2029.
Qatar Potassium Cyanate Market Year-wise Growth Rate and Key Drivers
This graph highlights how the Qatar Potassium Cyanate Market has steadily grown over the past five years, supported by major growth factors.
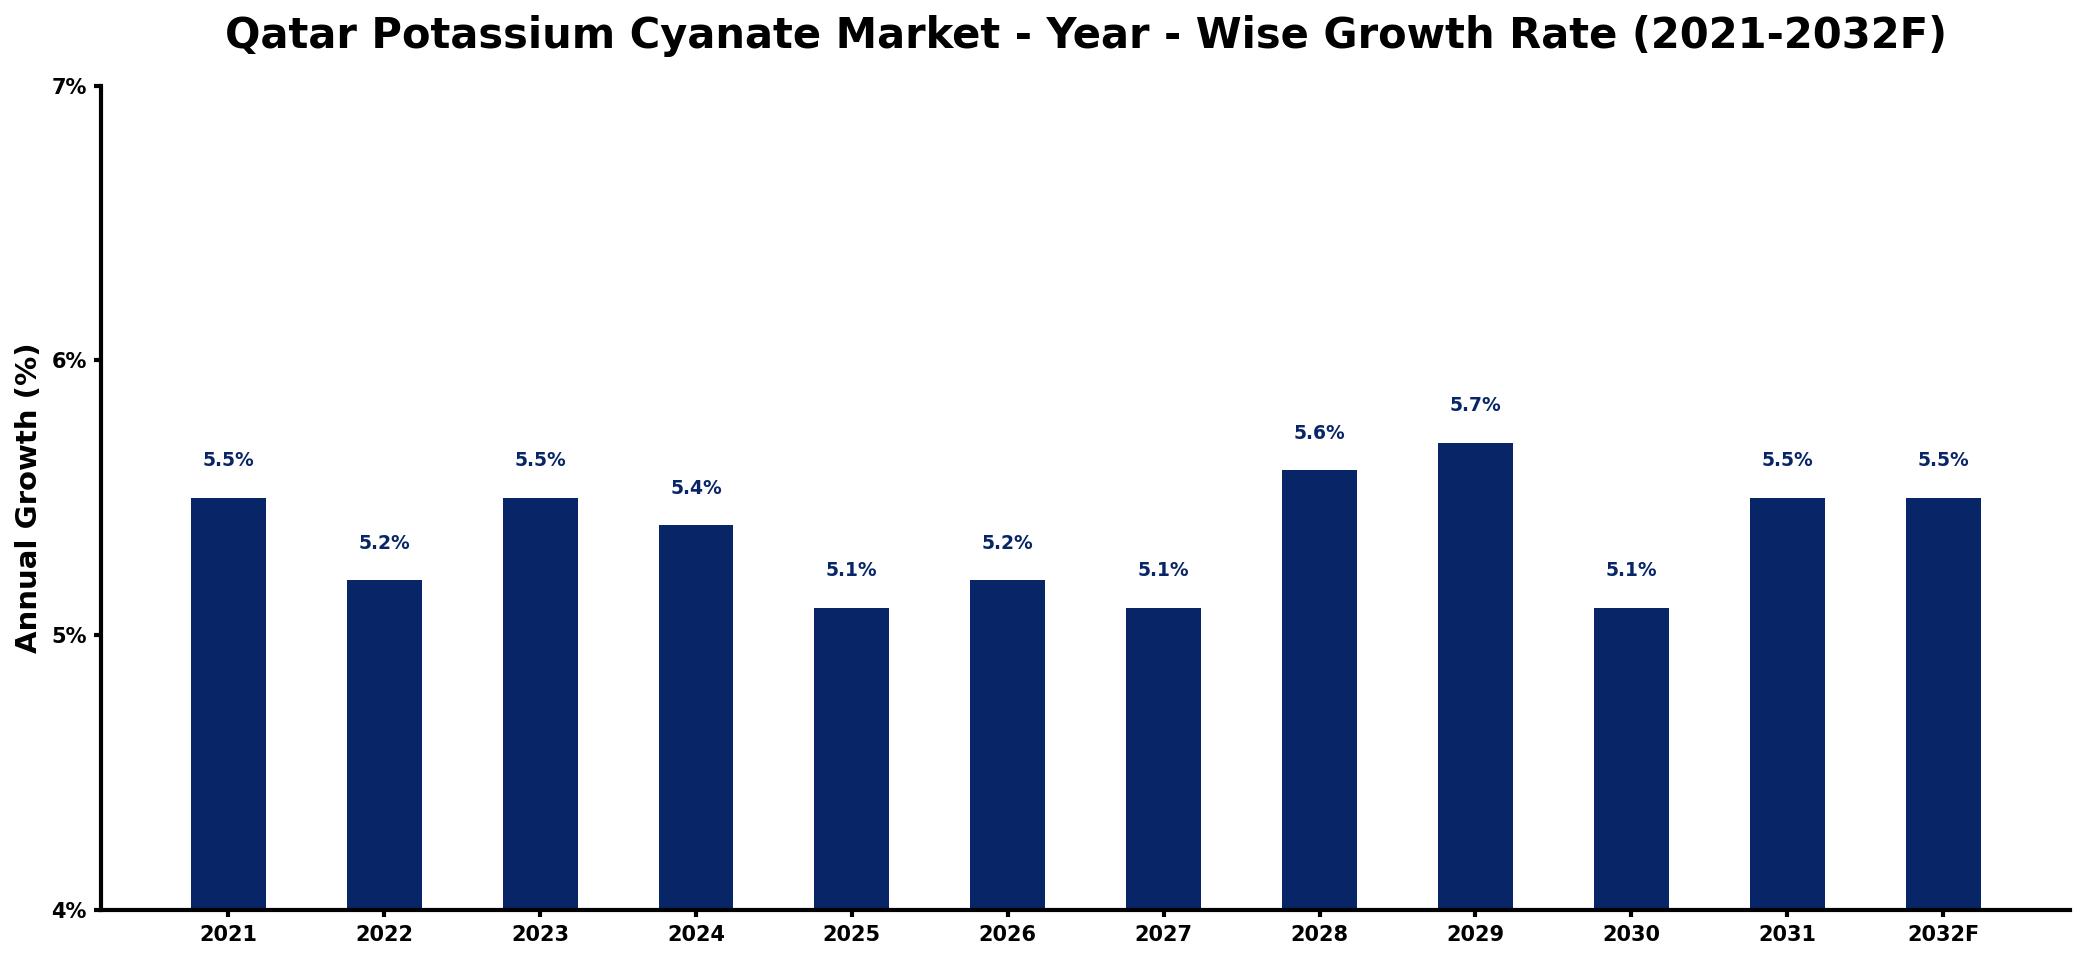
The table below presents the year‑wise growth rates along with the key drivers influencing the market
| Year | Growth Rate | Major Drivers |
| 2021 | 5.5% | increased industrial chemical production |
| 2022 | 5.2% | growing demand from agriculture sector |
| 2023 | 5.5% | expansion of manufacturing facilities |
| 2024 | 5.4% | rising applications in pharmaceuticals |
| 2025 | 5.1% | increased investment in research initiatives |
| 2026 | 5.2% | growing environmental safety regulations |
| 2027 | 5.1% | improvements in production technology |
| 2028 | 5.6% | higher demand from mining industry |
| 2029 | 5.7% | increased production capacity utilization |
| 2030 | 5.1% | increased use in laboratories |
| 2031 | 5.5% | growth in specialty chemical applications |
| 2032 | 5.5% | rising interest in sustainable solutions |
Note: Market size estimations and growth projections presented in this report are based on 6Wresearch's proprietary forecasting methodology, utilizing the latest available industry data, government publications, and primary research inputs.
Qatar Potassium Cyanate Market Synopsis
The primary force shaping the Qatar potassium cyanate market is its critical role as a versatile chemical reagent in numerous industrial applications. Its utilization in agriculture, pharmaceuticals, and chemical synthesis has become increasingly significant as manufacturers seek sustainable and efficient solutions. The market's expansion reflects a growing awareness of potassium cyanate's benefits in various sectors.
Moreover, the production of synthetic resins, essential for plastic manufacturing, is a notable driver of market growth. The increasing focus on eco-friendly processes in industries like paper and textile further enhances potassium cyanate's appeal, promoting its use as a bleaching agent and dye intermediary, while simultaneously reducing environmental impact.
Qatar Potassium Cyanate Market Key Takeaways
- Market projected to grow from USD 346 Million in 2025 to USD 473 Million by 2032.
- Strong demand driven by applications in agriculture, pharmaceuticals, and chemical synthesis.
- Regulatory frameworks emphasize safety and sustainability, influencing market dynamics.
- COVID-19 highlighted the importance of potassium cyanate in the pharmaceutical sector.
- Key industry players are focused on innovation and sustainable practices to remain competitive.
Evaluation of Restraints in Qatar Potassium Cyanate Market
While the Qatar potassium cyanate market is on an upward trajectory, it faces notable restraints, primarily stemming from safety and environmental concerns related to cyanide compounds. Stringent regulations impose limitations on the handling and distribution of potassium cyanate, leading to apprehensions among manufacturers and end-users. This regulatory landscape compels companies to adopt transparent practices, ensuring compliance and addressing public concerns effectively.
Qatar Potassium Cyanate Market Trends
Current trends in the Qatar potassium cyanate market indicate a shift towards greener manufacturing practices. As industries adapt to more sustainable approaches, there is a growing emphasis on using potassium cyanate in eco-friendly processes, particularly in the textile and paper sectors. Innovations in chemical synthesis, coupled with rising R&D activities, are likely to expand the scope of potassium cyanate applications, driving market growth further.
Qatar Potassium Cyanate Market Opportunities
The market offers significant growth and investment opportunities, particularly in emerging sectors such as biopesticides and advanced materials. As the agricultural sector increasingly turns to sustainable herbicides and urea derivatives, potassium cyanate can play a pivotal role. Additionally, its applications in air filtration systems present new avenues for expansion, addressing urban environmental challenges while enhancing public health.
Government Initiatives in the Qatar Potassium Cyanate Market
The Qatari government has implemented policies aimed at promoting sustainability within the chemical sector. Public spending on research and development initiatives encourages innovations that align with environmental regulations. Additionally, incentives for companies adopting green technologies are fostering a more sustainable landscape for the potassium cyanate market, further bolstering its growth potential.
Future Insights of the Qatar Potassium Cyanate Market
Looking ahead to 2026-2032, the Qatar potassium cyanate market is poised for transformative growth. The increasing demand from diverse industries, combined with advancements in chemical synthesis, positions potassium cyanate as a key player in future industrial applications. Moreover, as manufacturers prioritize sustainability and environmental responsibility, the market will likely adapt, incorporating innovative practices that enhance the efficiency and safety of potassium cyanate use.
Qatar Potassium Cyanate Market Latest Developments (2025 - 2026)
Recent developments within the Qatar potassium cyanate market reflect a heightened focus on sustainability and innovation. Initiatives aimed at enhancing the safety protocols in handling potassium cyanate are being rolled out, ensuring compliance with regulatory standards. Moreover, manufacturers are investing in R&D to explore new applications that leverage the compound's versatility, particularly in eco-friendly solutions across various sectors.
Qatar Potassium Cyanate Market - Key Attractiveness of the Report
- 10 Years of Market Numbers
- Historical Data Starting from 2022 to 2025
- Base Year: 2025
- Forecast Data until 2032
- Key Performance Indicators Impacting the Market
- Major Upcoming Developments and Projects
Key Highlights of the Report:
- Qatar Potassium Cyanate Market Outlook
- Market Size of Qatar Potassium Cyanate Market, 2025
- Forecast of Qatar Potassium Cyanate Market, 2032
- Historical Data and Forecast of Qatar Potassium Cyanate Revenues & Volume for the Period 2022-2032F
- Qatar Potassium Cyanate Market Trend Evolution
- Qatar Potassium Cyanate Market Drivers and Challenges
- Qatar Potassium Cyanate Price Trends
- Qatar Potassium Cyanate Porter's Five Forces
- Qatar Potassium Cyanate Industry Life Cycle
- Historical Data and Forecast of Qatar Potassium Cyanate Market Revenues & Volume By Types for the Period 2022-2032F
- Historical Data and Forecast of Qatar Potassium Cyanate Market Revenues & Volume By Low Purity for the Period 2022-2032F
- Historical Data and Forecast of Qatar Potassium Cyanate Market Revenues & Volume By High Purity for the Period 2022-2032F
- Historical Data and Forecast of Qatar Potassium Cyanate Market Revenues & Volume By Applications for the Period 2022-2032F
- Historical Data and Forecast of Qatar Potassium Cyanate Market Revenues & Volume By Gold Plating for the Period 2022-2032F
- Historical Data and Forecast of Qatar Potassium Cyanate Market Revenues & Volume By Electronic Devices for the Period 2022-2032F
- Historical Data and Forecast of Qatar Potassium Cyanate Market Revenues & Volume By Jewelry and Watches for the Period 2022-2032F
- Historical Data and Forecast of Qatar Potassium Cyanate Market Revenues & Volume By Fashion items for the Period 2022-2032F
- Historical Data and Forecast of Qatar Potassium Cyanate Market Revenues & Volume By Others for the Period 2022-2032F
- Qatar Potassium Cyanate Import Export Trade Statistics
- Market Opportunity Assessment By Types
- Market Opportunity Assessment By Applications
- Qatar Potassium Cyanate Top Companies Market Share
- Qatar Potassium Cyanate Competitive Benchmarking By Technical and Operational Parameters
- Qatar Potassium Cyanate Company Profiles
- Qatar Potassium Cyanate Key Strategic Recommendations
Frequently Asked Questions About the Market Study (FAQs):
The market is projected to grow from USD 346 Million in 2025 to USD 473 Million by 2032, at a CAGR of 4.6% between 2026 and 2032, reflecting strong demand across various sectors.
Key applications include chemical synthesis, herbicides, and as an intermediary for organic compounds. The compound's versatility has cemented its role in agricultural and industrial processes.
Yes, concerns related to cyanide compounds may lead to stringent regulations affecting the market. Companies are focusing on safety and transparency to mitigate these issues.
The pandemic caused disruptions in manufacturing and trade, initially reducing demand. However, it also underscored the importance of potassium cyanate in pharmaceuticals and research, allowing the market to adapt.
Trends towards sustainable manufacturing practices and innovations in chemical applications are likely to define the market's future. This includes advancements in eco-friendly solutions within key industries.
6Wresearch actively monitors the Qatar Potassium Cyanate Market and publishes its comprehensive annual report, highlighting emerging trends, growth drivers, revenue analysis, and forecast outlook. Our insights help businesses to make data-backed strategic decisions with ongoing market dynamics. Our analysts track relevent industries related to the Qatar Potassium Cyanate Market, allowing our clients with actionable intelligence and reliable forecasts tailored to emerging regional needs.
Yes, we provide customisation as per your requirements. To learn more, feel free to contact us on sales@6wresearch.com
1 Executive Summary |
2 Introduction |
2.1 Key Highlights of the Report |
2.2 Report Description |
2.3 Market Scope & Segmentation |
2.4 Research Methodology |
2.5 Assumptions |
3 Qatar Potassium Cyanate Market Overview |
3.1 Qatar Country Macro Economic Indicators |
3.2 Qatar Potassium Cyanate Market Revenues & Volume, 2022 & 2032F |
3.3 Qatar Potassium Cyanate Market - Industry Life Cycle |
3.4 Qatar Potassium Cyanate Market - Porter's Five Forces |
3.5 Qatar Potassium Cyanate Market Revenues & Volume Share, By Types, 2022 & 2032F |
3.6 Qatar Potassium Cyanate Market Revenues & Volume Share, By Applications, 2022 & 2032F |
4 Qatar Potassium Cyanate Market Dynamics |
4.1 Impact Analysis |
4.2 Market Drivers |
4.2.1 Growing demand for potassium cyanate in various industries such as agriculture, pharmaceuticals, and chemical manufacturing. |
4.2.2 Increasing investments in research and development for new applications of potassium cyanate. |
4.2.3 Favorable government policies and regulations supporting the growth of the chemical industry in Qatar. |
4.3 Market Restraints |
4.3.1 Volatility in raw material prices impacting the production cost of potassium cyanate. |
4.3.2 Environmental concerns and regulations related to the handling and disposal of potassium cyanate. |
4.3.3 Intense competition from alternative chemicals affecting market share and pricing. |
5 Qatar Potassium Cyanate Market Trends |
6 Qatar Potassium Cyanate Market, By Types |
6.1 Qatar Potassium Cyanate Market, By Types |
6.1.1 Overview and Analysis |
6.1.2 Qatar Potassium Cyanate Market Revenues & Volume, By Types, 2022-2032F |
6.1.3 Qatar Potassium Cyanate Market Revenues & Volume, By Low Purity, 2022-2032F |
6.1.4 Qatar Potassium Cyanate Market Revenues & Volume, By High Purity, 2022-2032F |
6.2 Qatar Potassium Cyanate Market, By Applications |
6.2.1 Overview and Analysis |
6.2.2 Qatar Potassium Cyanate Market Revenues & Volume, By Gold Plating, 2022-2032F |
6.2.3 Qatar Potassium Cyanate Market Revenues & Volume, By Electronic Devices, 2022-2032F |
6.2.4 Qatar Potassium Cyanate Market Revenues & Volume, By Jewelry and Watches, 2022-2032F |
6.2.5 Qatar Potassium Cyanate Market Revenues & Volume, By Fashion items, 2022-2032F |
6.2.6 Qatar Potassium Cyanate Market Revenues & Volume, By Others, 2022-2032F |
7 Qatar Potassium Cyanate Market Import-Export Trade Statistics |
7.1 Qatar Potassium Cyanate Market Export to Major Countries |
7.2 Qatar Potassium Cyanate Market Imports from Major Countries |
8 Qatar Potassium Cyanate Market Key Performance Indicators |
8.1 Average selling price of potassium cyanate in the Qatar market. |
8.2 Number of new applications or industries adopting potassium cyanate. |
8.3 Percentage of market share held by domestic producers in the Qatar potassium cyanate market. |
9 Qatar Potassium Cyanate Market - Opportunity Assessment |
9.1 Qatar Potassium Cyanate Market Opportunity Assessment, By Types, 2022 & 2032F |
9.2 Qatar Potassium Cyanate Market Opportunity Assessment, By Applications, 2022 & 2032F |
10 Qatar Potassium Cyanate Market - Competitive Landscape |
10.1 Qatar Potassium Cyanate Market Revenue Share, By Companies, 2025 |
10.2 Qatar Potassium Cyanate Market Competitive Benchmarking, By Operating and Technical Parameters |
11 Company Profiles |
12 Recommendations |
13 Disclaimer |
Global Go To Market Strategy - 2030
Export potential enables firms to identify high-growth global markets with greater confidence by combining advanced trade intelligence with a structured quantitative methodology. The framework analyzes emerging demand trends and country-level import patterns while integrating macroeconomic and trade datasets such as GDP and population forecasts, bilateral import–export flows, tariff structures, elasticity differentials between developed and developing economies, geographic distance, and import demand projections. Using weighted trade values from 2020–2024 as the base period to project country-to-country export potential for 2030, these inputs are operationalized through calculated drivers such as gravity model parameters, tariff impact factors, and projected GDP per-capita growth. Through an analysis of hidden potentials, demand hotspots, and market conditions that are most favorable to success, this method enables firms to focus on target countries, maximize returns, and global expansion with data, backed by accuracy.
By factoring in the projected importer demand gap that is currently unmet and could be potential opportunity, it identifies the potential for the Exporter (Country) among 190 countries, against the general trade analysis, which identifies the biggest importer or exporter.
To discover high-growth global markets and optimize your business strategy:
Click Here
Pricing
- Single User License$ 1,995
- Department License$ 2,400
- Site License$ 3,120
- Global License$ 3,795

Leadership Perspectives from Industry Events
Search
Thought Leadership and Analyst Meet


Our Clients
6WResearch In News
- India Air Conditioner Market Set for Strong Rebound in 2026 After Weather-Led Correction and GST-Driven Recovery: 6Wresearch
- ADAS in India: How Automatic Emergency Braking, Blind Spot Detection & Driver Monitoring are Transforming Road Safety
- Doha a strategic location for EV manufacturing hub: IPA Qatar
- Demand for luxury TVs surging in the GCC, says Samsung
- Empowering Growth: The Thriving Journey of Bangladesh’s Cable Industry
- Demand for luxury TVs surging in the GCC, says Samsung
Latest Reports
- Nicaragua RPG Gaming Market (2026-2032)
- New Zealand RPG Gaming Market (2026-2032)
- Netherlands RPG Gaming Market (2026-2032)
- Nauru RPG Gaming Market (2026-2032)
- Namibia RPG Gaming Market (2026-2032)
- Mozambique RPG Gaming Market (2026-2032)
- Montenegro RPG Gaming Market (2026-2032)
- Mongolia RPG Gaming Market (2026-2032)
- Monaco RPG Gaming Market (2026-2032)
- Micronesia RPG Gaming Market (2026-2032)
Industry Events and Analyst Meet

HIMTEX 2026

India Refining Summit 2026

India EV Show 2026

EV tech India Expo 2026

Auto Tech Asia 2026
Whitepaper
- Middle East & Africa Commercial Security Market Click here to view more.
- Middle East & Africa Fire Safety Systems & Equipment Market Click here to view more.
- GCC Drone Market Click here to view more.
- Middle East Lighting Fixture Market Click here to view more.
- GCC Physical & Perimeter Security Market Click here to view more.