Qatar Power Supply Market (2026-2032) | Forecast, Value, Share, Industry, Companies, Size, Trends, Growth, Analysis, Revenue & Outlook
Market Forecast By Output Power (Power Supply With Low Output (500 W and Below), Power Supply With Medium Output (500–1,000 W), Power Supply With High Output (More Than 1,000 W)), By Type (AC-DC Power Supply, DC-DC Power Supply), By Vertical (Medical & Healthcare, Military & Aerospace, Telecommunications, Consumer Electronics, Transportation, Lighting, Food & Beverages, Industrial) And Competitive Landscape
| Product Code: ETC014221 | Publication Date: Jul 2023 | Updated Date: Jun 2026 | Product Type: Report | |
| Publisher: 6Wresearch | Author: Ravi Bhandari | No. of Pages: 70 | No. of Figures: 35 | No. of Tables: 5 |
Qatar Power Supply Market Summary
The qatar power supply market was estimated at USD 441 Million in 2025 and is projected to reach USD 577 Million by 2032, growing at a CAGR of 4.9% from 2026 to 2032.
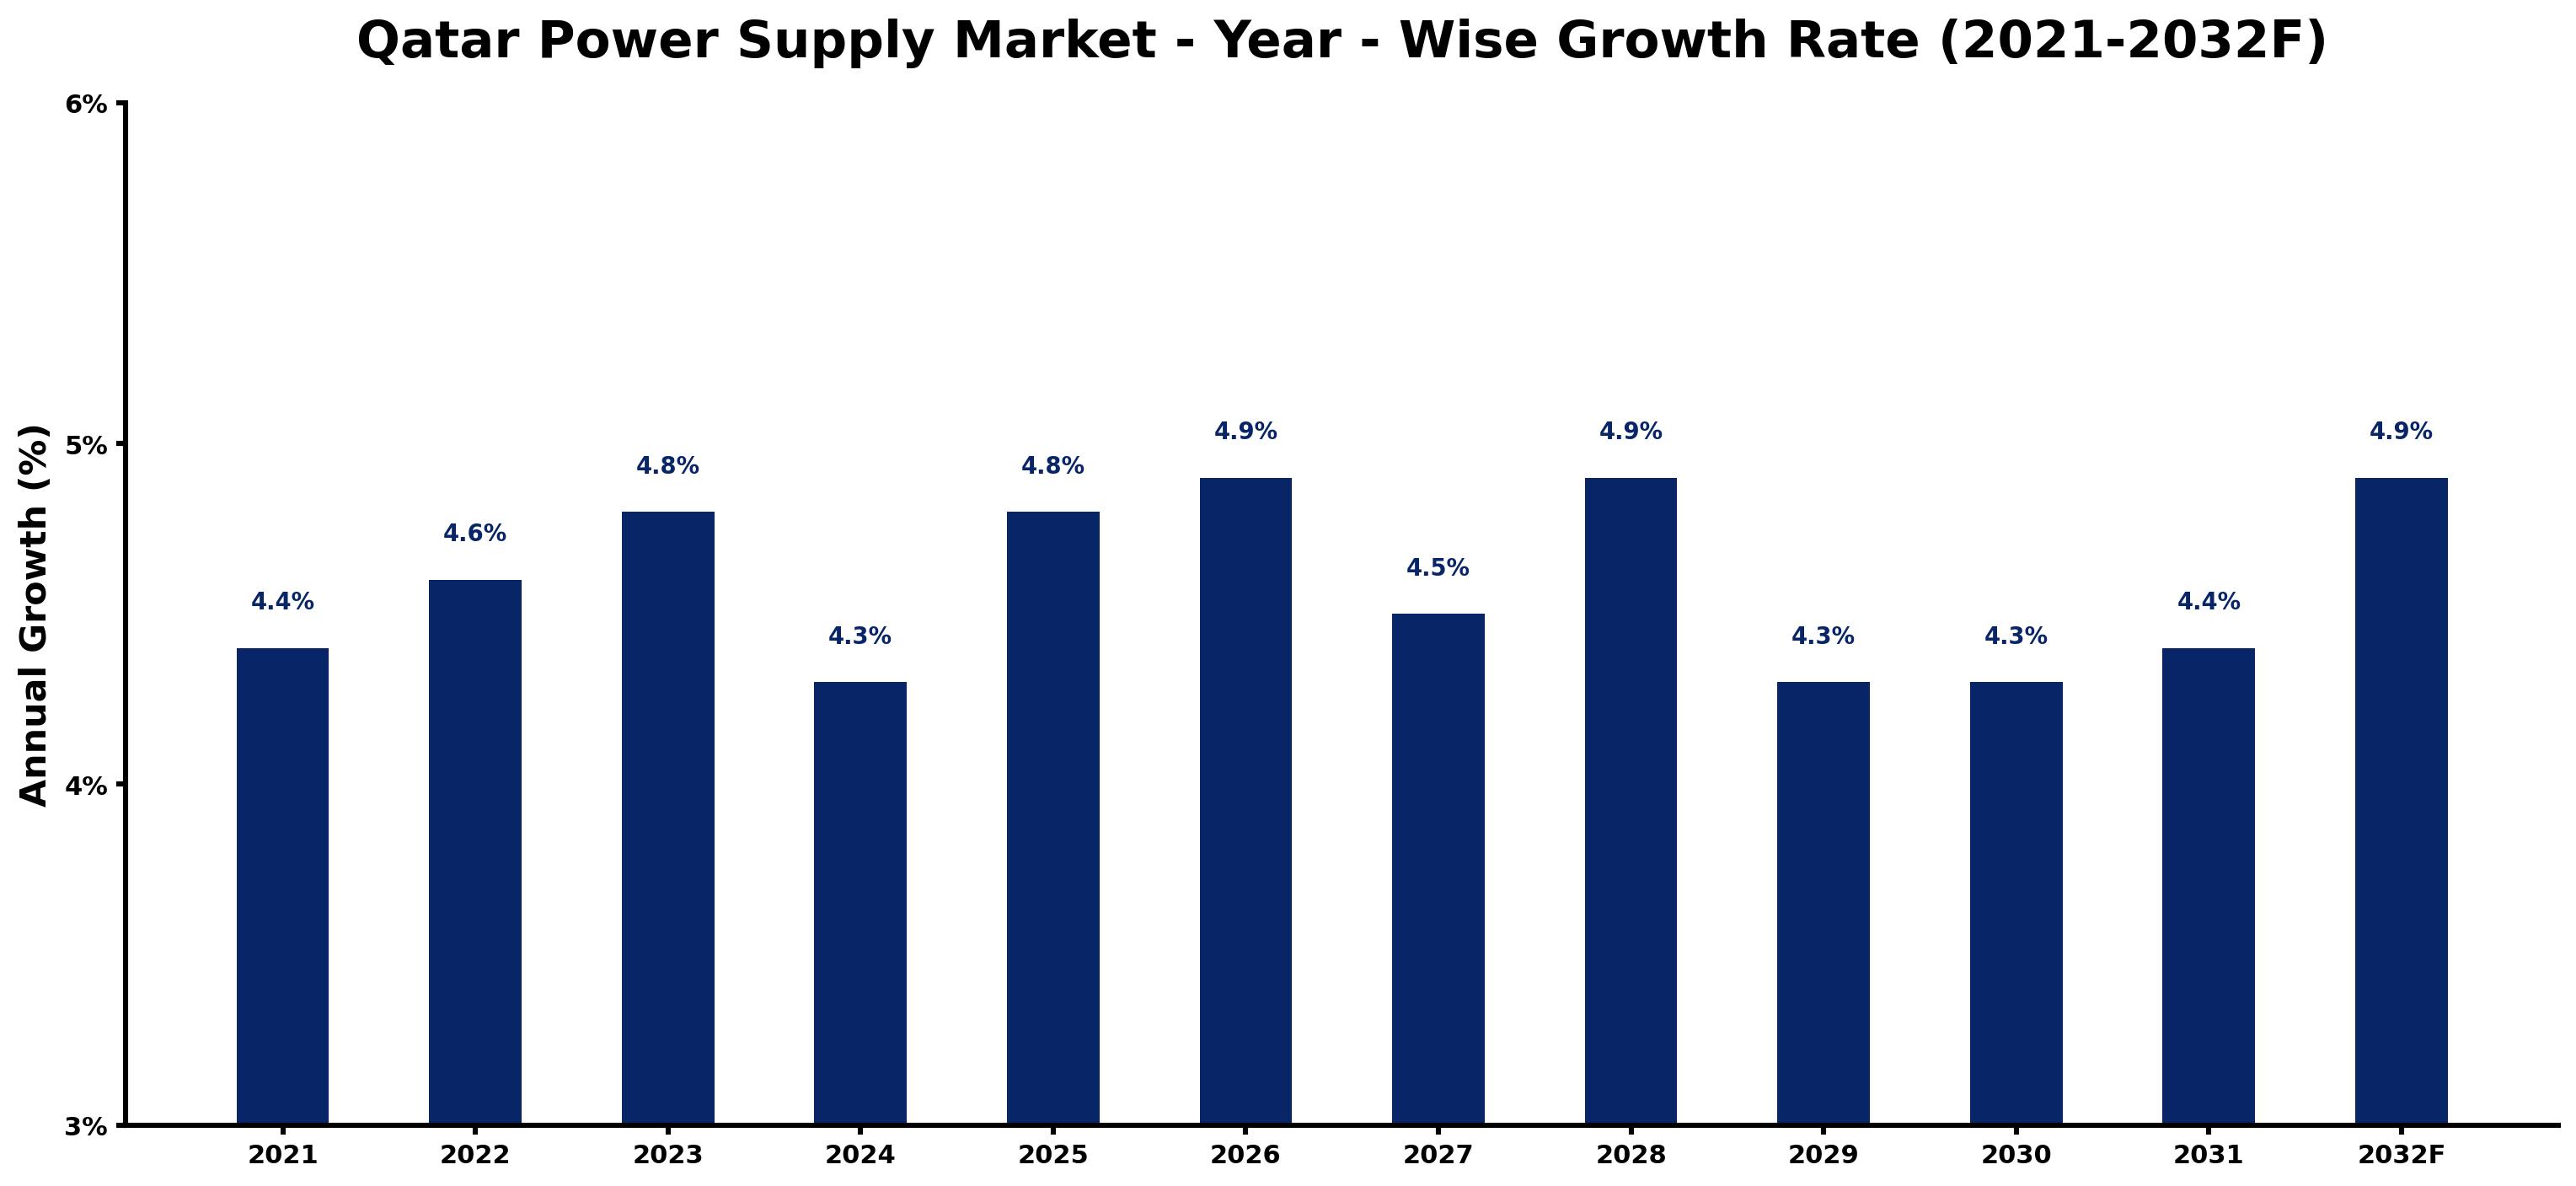
Qatar Power Supply Market Growth Rate Analysis (2021-2032)
The Qatar power supply market exhibits stable growth, with anticipated increases in demand driven by ongoing investments and infrastructure development. Following a growth rate of 4.4% in 2021, the market saw an uptick to 4.6% in 2022, aligning with the country's robust energy transition initiatives. In 2023, growth is projected at 4.8%, reflecting heightened consumer demand and technological advancements in energy efficiency. Despite slight fluctuations, such as the 4.3% dip in 2024, factors such as increased industrial activity and supportive government policies reinvigorated growth, leading to forecasts of 4.9% by 2028. Overall, investments in renewable energy sources will be crucial for maintaining momentum through the coming years.
Qatar Power Supply Market Year-wise Growth Rate and Key Drivers
This graph highlights how the Qatar Power Supply Market has steadily grown over the past five years, supported by major growth factors.
The table below presents the year wise growth rates along with the key drivers influencing the market
| Year | Growth Rate | Major Drivers |
| 2021 | 4.4% | Post-lockdown economic recovery initiatives fueled significant investments in power infrastructure. |
| 2022 | 4.6% | Construction of major projects in Neom and Qatar's 2030 Vision spurred energy demand. |
| 2023 | 4.8% | Legacy infrastructure upgrades addressed reliability issues in power distribution networks. |
| 2024 | 4.3% | Local partnerships formed to enhance renewable energy integration into existing systems. |
| 2025 | 4.8% | Enhanced energy efficiency standards began influencing new residential and commercial buildings. |
| 2026 | 4.9% | Emerging technologies like smart grids gained traction among utility providers and consumers. |
| 2027 | 4.5% | A shift towards decarbonization encouraged investments in solar and wind power projects. |
| 2028 | 4.9% | Increased regional collaboration on energy projects created a more resilient power supply chain. |
| 2029 | 4.3% | The hosting of international events highlighted Qatar's need for a robust energy ecosystem. |
| 2030 | 4.3% | A focus on sustainability began reshaping corporate strategies within the power sector. |
| 2031 | 4.4% | Technological innovations in energy storage offered new solutions for balancing supply and demand. |
| 2032 | 4.9% | Long-term planning and investments positioned Qatar as a regional energy hub for the future. |
Note - Market size estimations and growth projections presented in this report are based on 6Wresearch's advanced forecasting approach, validated with industry datasets as of June 2026.
Qatar Power Supply Market Synopsis
The Qatar Power Supply Market is projected to reach 4.9% and witness significant growth during the forecast period (2026-2032). This growth trajectory is influenced by a confluence of factors including robust government initiatives aimed at modernizing the power infrastructure, an increasing population, and a surge in industrial activities. Coupled with technological advancements in energy management, the demand for reliable power supply solutions is set to escalate across various sectors in Qatar.
Qatar Power Supply Market Growth Drivers
The primary drivers of the Qatar Power Supply Market stem from both government activities and evolving market dynamics. Key drivers include:
- Government investments in infrastructure improvements that aim to bolster the capacity and reliability of the power supply system, ensuring alignment with national economic diversification plans.
- The growing population, which contributes to increased electricity demand, necessitating efficient and scalable power solutions to meet future consumption needs.
- Rapid industrialization efforts in sectors such as oil and gas, tourism, and construction that require stable power sources for operations, thereby elevating the demand for advanced power supply systems.
- Technological innovations like smart grid systems that enhance energy efficiency and grid reliability, catering to changing consumption patterns and improving overall energy management.
- Private sector interest in renewable energy investments, allowing for diversification of energy sources and increasing competition within the market, ultimately leading to enhanced service offerings.
Qatar Power Supply Market Challenges and Restraints
Despite the promising growth, the Qatar Power Supply Market faces several challenges that could impact its development trajectory. These challenges include:
- The high initial capital required for deploying advanced power infrastructure and technologies, which may deter smaller businesses from investing in necessary upgrades.
- Logistical hurdles associated with the procurement and distribution of energy resources, compounded by the complexity of managing decentralized energy production.
- Periodic disruptions in energy supply due to reliance on aging infrastructure, which can lead to significant operational challenges for both businesses and consumers.
- The necessity for regulatory frameworks to support renewable energy projects, which may take time to establish, slowing down the transition to cleaner energy sources.
- Consumer expectations for uninterrupted power supply that must be met, as any outages could undermine business productivity and profitability, leading to a critical need for reliability in supply solutions.
Qatar Power Supply Market Government Investment and Initiatives
The Qatari government has actively invested in several initiatives aimed at enhancing the power supply landscape within the country. Key initiatives include:
- The National Vision 2030 program, which outlines the government's commitment to diversifying the economy and investing in sustainable energy solutions.
- Public-private partnerships (PPP) aimed at fostering investment in renewable energy projects and modernizing existing power infrastructure.
- Implementation of regulations that promote energy efficiency and the adoption of smart technologies within the power supply chain.
- Financial incentives for private sector players investing in renewable energy capacities, promoting a shift towards sustainable energy use.
- Development of comprehensive energy policies that encourage sustainable practices while ensuring reliable energy access to meet growing demand.
Qatar Power Supply Market Latest Developments (May 2025 - June 2026)
Recent developments in the Qatar Power Supply Market reflect ongoing trends and shifts in energy strategy. Some notable trends include:
- Increased focus on integrating renewable energy solutions into the national grid, thereby reducing reliance on conventional fossil fuels.
- Advancements in smart grid technologies that allow for better demand management, increased efficiency, and improved energy distribution across regions.
- Expansion of infrastructure projects aimed at enhancing power generation capacity to accommodate the growing demands from both residential and commercial sectors.
- Government-led initiatives promoting research and development in sustainable energy technologies, aiming to position Qatar as a regional leader in energy innovation.
- Emerging partnerships between local authorities and international firms to explore and implement cutting-edge energy solutions that align with Qatar's long-term sustainability goals.
Qatar Power Supply Market - Key Attractiveness of the Report
- 10 Years of Market Numbers
- Historical Data Starting from 2022 to 2025
- Base Year: 2025
- Forecast Data until 2032
- Key Performance Indicators Impacting the Market
- Major Upcoming Developments and Projects
Key Highlights of the Report:
- Qatar Power Supply Market Outlook
- Market Size of Qatar Power Supply Market, 2025
- Forecast of Qatar Power Supply Market, 2032
- Historical Data and Forecast of Qatar Power Supply Revenues & Volume for the Period 2022-2032F
- Qatar Power Supply Market Trend Evolution
- Qatar Power Supply Market Drivers and Challenges
- Qatar Power Supply Price Trends
- Qatar Power Supply Porter's Five Forces
- Qatar Power Supply Industry Life Cycle
- Historical Data and Forecast of Qatar Power Supply Market Revenues & Volume By Output Power for the Period 2022-2032F
- Historical Data and Forecast of Qatar Power Supply Market Revenues & Volume By Power Supply With Low Output (500 W and Below) for the Period 2022-2032F
- Historical Data and Forecast of Qatar Power Supply Market Revenues & Volume By Power Supply With Medium Output (500?1,000 W) for the Period 2022-2032F
- Historical Data and Forecast of Qatar Power Supply Market Revenues & Volume By Power Supply With High Output (More Than 1,000 W) for the Period 2022-2032F
- Historical Data and Forecast of Qatar Power Supply Market Revenues & Volume By Type for the Period 2022-2032F
- Historical Data and Forecast of Qatar Power Supply Market Revenues & Volume By AC-DC Power Supply for the Period 2022-2032F
- Historical Data and Forecast of Qatar Power Supply Market Revenues & Volume By DC-DC Power Supply for the Period 2022-2032F
- Historical Data and Forecast of Qatar Power Supply Market Revenues & Volume By Vertical for the Period 2022-2032F
- Historical Data and Forecast of Qatar Power Supply Market Revenues & Volume By Medical & Healthcare for the Period 2022-2032F
- Historical Data and Forecast of Qatar Power Supply Market Revenues & Volume By Military & Aerospace for the Period 2022-2032F
- Historical Data and Forecast of Qatar Power Supply Market Revenues & Volume By Telecommunications for the Period 2022-2032F
- Historical Data and Forecast of Qatar Power Supply Market Revenues & Volume By Consumer Electronics for the Period 2022-2032F
- Historical Data and Forecast of Qatar Power Supply Market Revenues & Volume By Transportation for the Period 2022-2032F
- Historical Data and Forecast of Qatar Power Supply Market Revenues & Volume By Lighting for the Period 2022-2032F
- Historical Data and Forecast of Qatar Power Supply Market Revenues & Volume By Food & Beverages for the Period 2022-2032F
- Historical Data and Forecast of Qatar Power Supply Market Revenues & Volume By Industrial for the Period 2022-2032F
- Qatar Power Supply Import Export Trade Statistics
- Market Opportunity Assessment By Output Power
- Market Opportunity Assessment By Type
- Market Opportunity Assessment By Vertical
- Qatar Power Supply Top Companies Market Share
- Qatar Power Supply Competitive Benchmarking By Technical and Operational Parameters
- Qatar Power Supply Company Profiles
- Qatar Power Supply Key Strategic Recommendations
Frequently Asked Questions About the Market Study (FAQs):
The growth is primarily driven by government initiatives to modernize infrastructure, increased electricity demand due to population growth and industrialization, and investments in renewable energy technologies.
Challenges include high initial investment costs for modernized infrastructure, logistical issues in energy distribution, and the need for reliable power supply to meet consumer expectations.
The pandemic led to increased demand for uninterrupted power supply solutions while presenting challenges in logistics and workforce availability, affecting overall market growth.
The government plays a crucial role by investing in infrastructure improvements, implementing regulations to promote renewable energy, and establishing policies for sustainable energy management.
6Wresearch actively monitors the Qatar Power Supply Market and publishes its comprehensive annual report, highlighting emerging trends, growth drivers, revenue analysis, and forecast outlook. Our insights help businesses to make data-backed strategic decisions with ongoing market dynamics. Our analysts track relevent industries related to the Qatar Power Supply Market, allowing our clients with actionable intelligence and reliable forecasts tailored to emerging regional needs.
Yes, we provide customisation as per your requirements. To learn more, feel free to contact us on sales@6wresearch.com
1 Executive Summary |
2 Introduction |
2.1 Key Highlights of the Report |
2.2 Report Description |
2.3 Market Scope & Segmentation |
2.4 Research Methodology |
2.5 Assumptions |
3 Qatar Power Supply Market Overview |
3.1 Qatar Country Macro Economic Indicators |
3.2 Qatar Power Supply Market Revenues & Volume, 2022 & 2032F |
3.3 Qatar Power Supply Market - Industry Life Cycle |
3.4 Qatar Power Supply Market - Porter's Five Forces |
3.5 Qatar Power Supply Market Revenues & Volume Share, By Output Power, 2022 & 2032F |
3.6 Qatar Power Supply Market Revenues & Volume Share, By Type, 2022 & 2032F |
3.7 Qatar Power Supply Market Revenues & Volume Share, By Vertical, 2022 & 2032F |
4 Qatar Power Supply Market Dynamics |
4.1 Impact Analysis |
4.2 Market Drivers |
4.3 Market Restraints |
5 Qatar Power Supply Market Trends |
6 Qatar Power Supply Market, By Types |
6.1 Qatar Power Supply Market, By Output Power |
6.1.1 Overview and Analysis |
6.1.2 Qatar Power Supply Market Revenues & Volume, By Output Power, 2022-2032F |
6.1.3 Qatar Power Supply Market Revenues & Volume, By Power Supply With Low Output (500 W and Below), 2022-2032F |
6.1.4 Qatar Power Supply Market Revenues & Volume, By Power Supply With Medium Output (500?1,000 W), 2022-2032F |
6.1.5 Qatar Power Supply Market Revenues & Volume, By Power Supply With High Output (More Than 1,000 W), 2022-2032F |
6.2 Qatar Power Supply Market, By Type |
6.2.1 Overview and Analysis |
6.2.2 Qatar Power Supply Market Revenues & Volume, By AC-DC Power Supply, 2022-2032F |
6.2.3 Qatar Power Supply Market Revenues & Volume, By DC-DC Power Supply, 2022-2032F |
6.3 Qatar Power Supply Market, By Vertical |
6.3.1 Overview and Analysis |
6.3.2 Qatar Power Supply Market Revenues & Volume, By Medical & Healthcare, 2022-2032F |
6.3.3 Qatar Power Supply Market Revenues & Volume, By Military & Aerospace, 2022-2032F |
6.3.4 Qatar Power Supply Market Revenues & Volume, By Telecommunications, 2022-2032F |
6.3.5 Qatar Power Supply Market Revenues & Volume, By Consumer Electronics, 2022-2032F |
6.3.6 Qatar Power Supply Market Revenues & Volume, By Transportation, 2022-2032F |
6.3.7 Qatar Power Supply Market Revenues & Volume, By Lighting, 2022-2032F |
6.3.8 Qatar Power Supply Market Revenues & Volume, By Industrial, 2022-2032F |
6.3.9 Qatar Power Supply Market Revenues & Volume, By Industrial, 2022-2032F |
7 Qatar Power Supply Market Import-Export Trade Statistics |
7.1 Qatar Power Supply Market Export to Major Countries |
7.2 Qatar Power Supply Market Imports from Major Countries |
8 Qatar Power Supply Market Key Performance Indicators |
9 Qatar Power Supply Market - Opportunity Assessment |
9.1 Qatar Power Supply Market Opportunity Assessment, By Output Power, 2022 & 2032F |
9.2 Qatar Power Supply Market Opportunity Assessment, By Type, 2022 & 2032F |
9.3 Qatar Power Supply Market Opportunity Assessment, By Vertical, 2022 & 2032F |
10 Qatar Power Supply Market - Competitive Landscape |
10.1 Qatar Power Supply Market Revenue Share, By Companies, 2025 |
10.2 Qatar Power Supply Market Competitive Benchmarking, By Operating and Technical Parameters |
11 Company Profiles |
12 Recommendations |
13 Disclaimer |
Global Go To Market Strategy - 2030
Export potential enables firms to identify high-growth global markets with greater confidence by combining advanced trade intelligence with a structured quantitative methodology. The framework analyzes emerging demand trends and country-level import patterns while integrating macroeconomic and trade datasets such as GDP and population forecasts, bilateral import–export flows, tariff structures, elasticity differentials between developed and developing economies, geographic distance, and import demand projections. Using weighted trade values from 2020–2024 as the base period to project country-to-country export potential for 2030, these inputs are operationalized through calculated drivers such as gravity model parameters, tariff impact factors, and projected GDP per-capita growth. Through an analysis of hidden potentials, demand hotspots, and market conditions that are most favorable to success, this method enables firms to focus on target countries, maximize returns, and global expansion with data, backed by accuracy.
By factoring in the projected importer demand gap that is currently unmet and could be potential opportunity, it identifies the potential for the Exporter (Country) among 190 countries, against the general trade analysis, which identifies the biggest importer or exporter.
To discover high-growth global markets and optimize your business strategy:
Click Here
Pricing
- Single User License$ 1,995
- Department License$ 2,400
- Site License$ 3,120
- Global License$ 3,795

Leadership Perspectives from Industry Events
Search
Thought Leadership and Analyst Meet


Our Clients
6WResearch In News
- India Air Conditioner Market Set for Strong Rebound in 2026 After Weather-Led Correction and GST-Driven Recovery: 6Wresearch
- ADAS in India: How Automatic Emergency Braking, Blind Spot Detection & Driver Monitoring are Transforming Road Safety
- Doha a strategic location for EV manufacturing hub: IPA Qatar
- Demand for luxury TVs surging in the GCC, says Samsung
- Empowering Growth: The Thriving Journey of Bangladesh’s Cable Industry
- Demand for luxury TVs surging in the GCC, says Samsung
Latest Reports
- Nicaragua RPG Gaming Market (2026-2032)
- New Zealand RPG Gaming Market (2026-2032)
- Netherlands RPG Gaming Market (2026-2032)
- Nauru RPG Gaming Market (2026-2032)
- Namibia RPG Gaming Market (2026-2032)
- Mozambique RPG Gaming Market (2026-2032)
- Montenegro RPG Gaming Market (2026-2032)
- Mongolia RPG Gaming Market (2026-2032)
- Monaco RPG Gaming Market (2026-2032)
- Micronesia RPG Gaming Market (2026-2032)
Industry Events and Analyst Meet

HIMTEX 2026

India Refining Summit 2026

India EV Show 2026

EV tech India Expo 2026

Auto Tech Asia 2026
Whitepaper
- Middle East & Africa Commercial Security Market Click here to view more.
- Middle East & Africa Fire Safety Systems & Equipment Market Click here to view more.
- GCC Drone Market Click here to view more.
- Middle East Lighting Fixture Market Click here to view more.
- GCC Physical & Perimeter Security Market Click here to view more.