Qatar Rubber Market (2026-2032) | Analysis, Share, Growth, Trends, Outlook, Companies, Revenue, Size, Industry, Forecast & Value
Market Forecast By Product Type (Natural Rubber, Synthetic Rubber), By End-users (Automotive & Transportation, Building & Construction, Industrial Machinery & Equipment, Others) And Competitive Landscape
| Product Code: ETC037822 | Publication Date: Jul 2023 | Updated Date: Jun 2026 | Product Type: Report | |
| Publisher: 6Wresearch | Author: Ravi Bhandari | No. of Pages: 70 | No. of Figures: 35 | No. of Tables: 5 |
Qatar Rubber Market Summary
The qatar rubber market was estimated at USD 398 Million in 2025 and is projected to reach USD 532 Million by 2032, growing at a CAGR of 5.0% from 2026 to 2032.
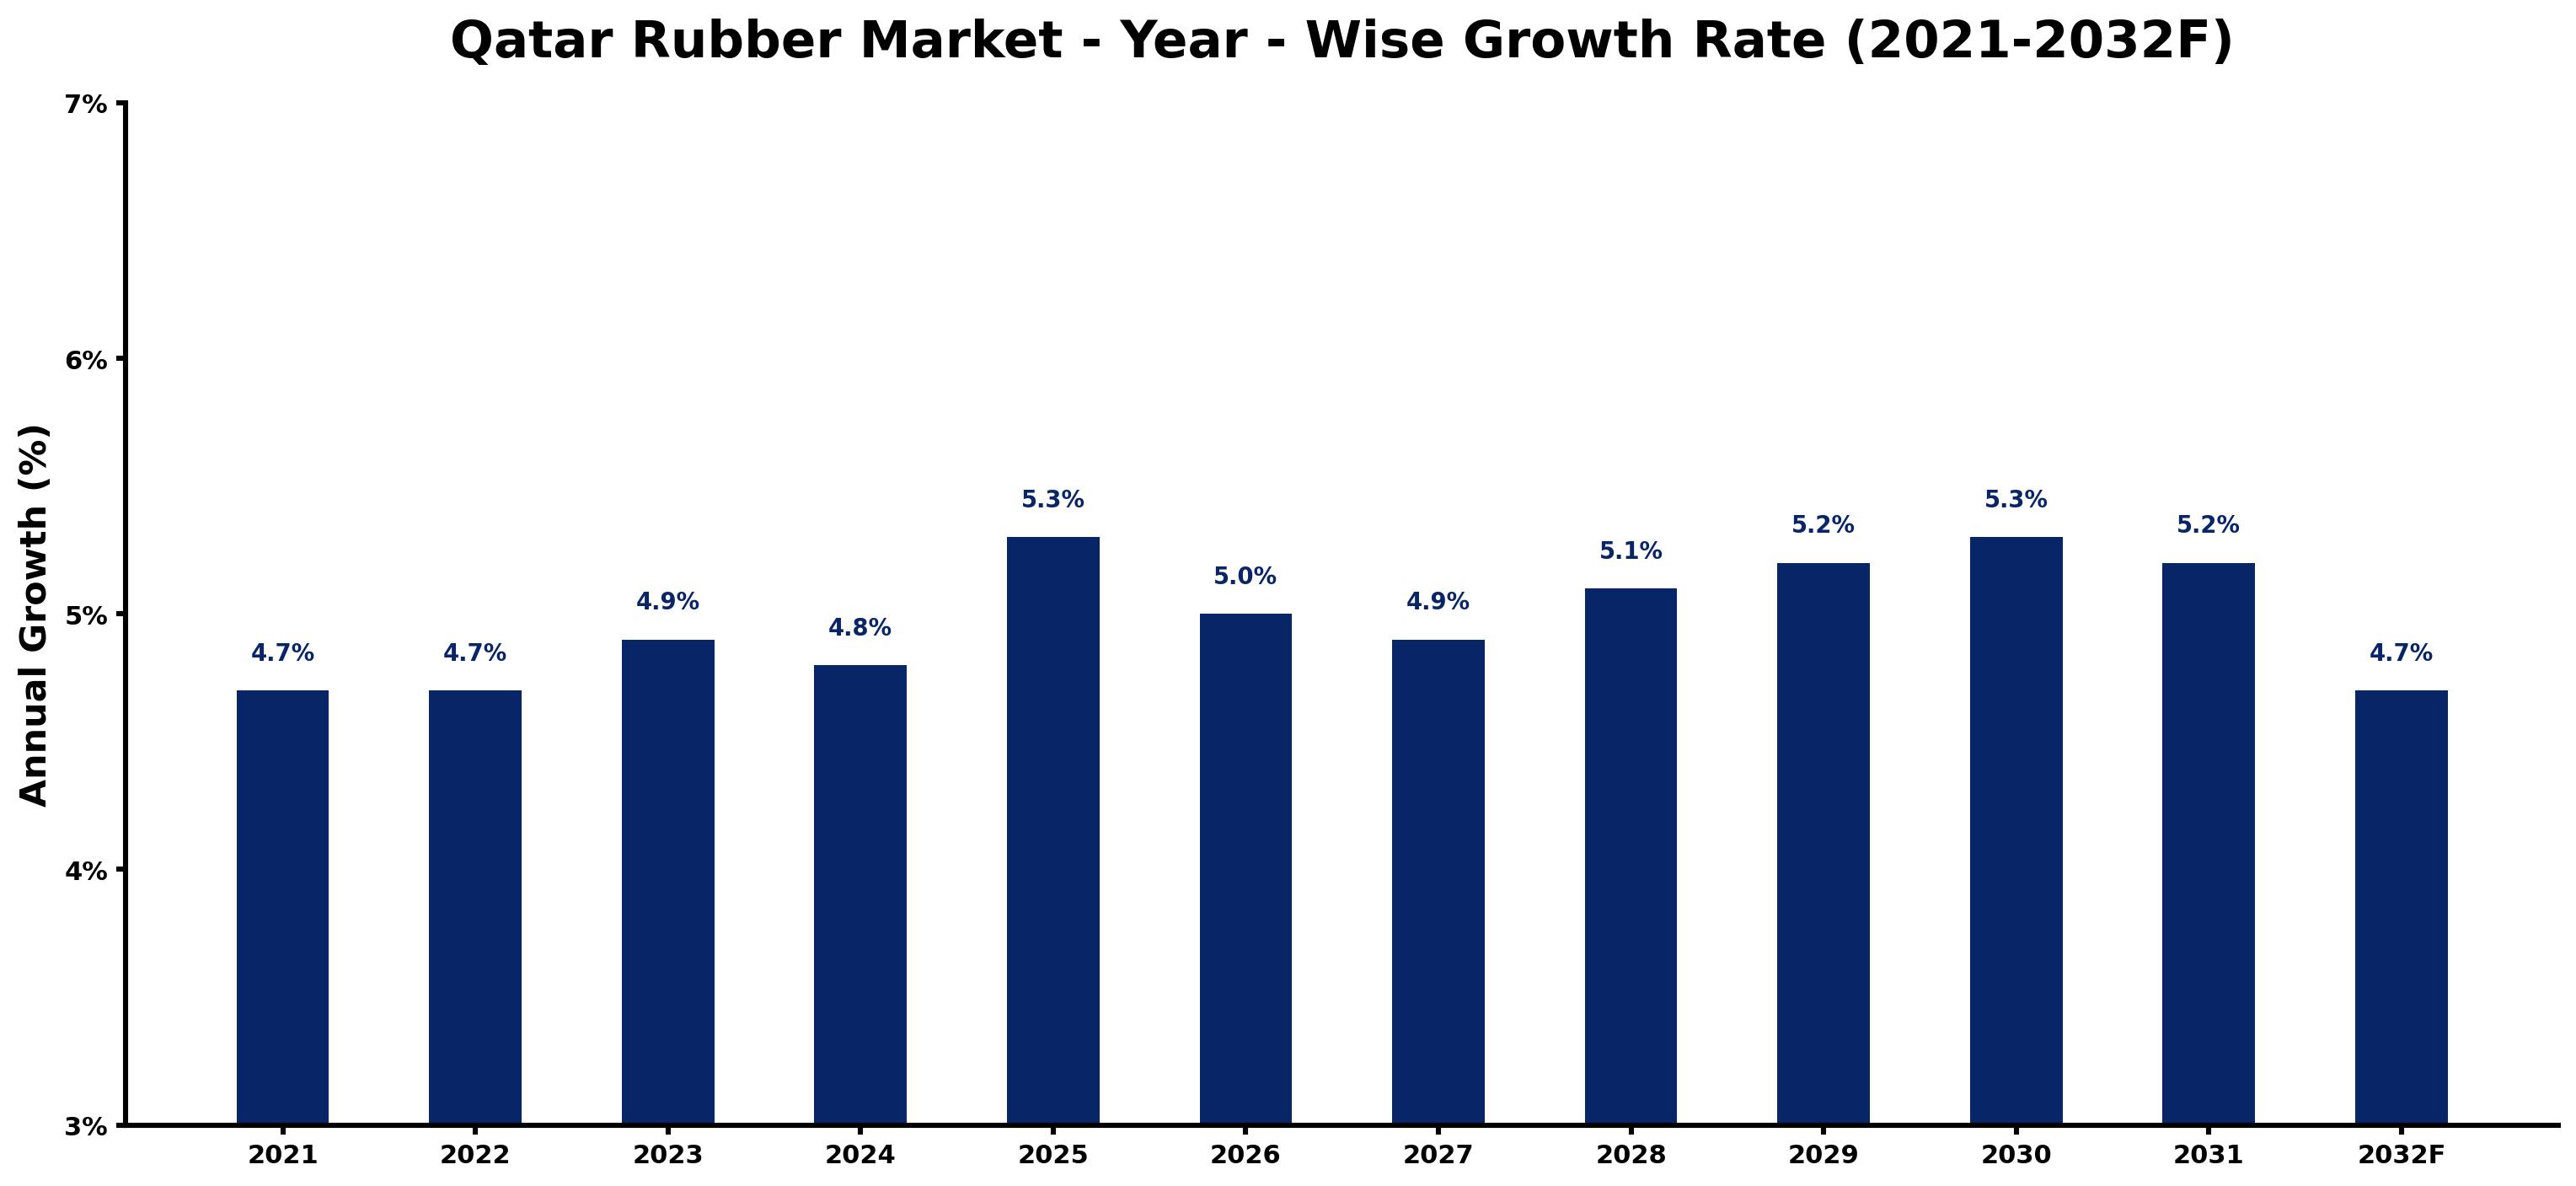
Qatar Rubber Market Growth Rate Analysis (2021-2032)
The Qatar rubber market has experienced stable growth over the past few years, with notable yearly increases of 4.7% in both 2021 and 2022. The trend slightly accelerated to 4.9% in 2023, driven by strong consumer demand and ongoing infrastructure projects that have spurred investment in the automotive and construction sectors. Growth is anticipated to fluctuate slightly, with a peak at 5.3% in 2025, as the country embraces energy transition initiatives and technological advancements in rubber production. However, a slight dip to 4.7% is expected in 2032, reflecting potential market saturation and shifts in consumer preferences. Overall, the outlook remains robust, underpinning Qatar's strategic economic diversification efforts.
Qatar Rubber Market Year-wise Growth Rate and Key Drivers
This graph highlights how the Qatar Rubber Market has steadily grown over the past five years, supported by major growth factors.
The table below presents the year wise growth rates along with the key drivers influencing the market
| Year | Growth Rate | Major Drivers |
| 2021 | 4.7% | Post-lockdown retail projects spurred a modest recovery in construction-related rubber demand. |
| 2022 | 4.7% | Localization efforts in the GCC resulted in increased manufacturing of rubber products in Qatar. |
| 2023 | 4.9% | Major construction pipelines, including World Cup facilities, boosted short-term rubber consumption significantly. |
| 2024 | 4.8% | Sustainable practices drive manufacturers towards eco-friendly rubber sourcing and production methods. |
| 2025 | 5.3% | Emerging automotive sectors in Qatar are creating new opportunities for rubber components. |
| 2026 | 5.0% | Hot climate requirements necessitate innovative rubber solutions for various infrastructural applications. |
| 2027 | 4.9% | Demand for durable materials in sports infrastructure leads to higher rubber market investments. |
| 2028 | 5.1% | Corporate budgets increasingly favor advanced rubber technologies enhancing product performance and durability. |
| 2029 | 5.2% | Cross-border collaborations with neighboring GCC countries enhance access to diverse rubber markets. |
| 2030 | 5.3% | Infrastructure development projects incorporate smart technologies, requiring advanced rubber solutions for longevity. |
| 2031 | 5.2% | Emerging markets in electric vehicles open pathways for specialized rubber applications and materials. |
| 2032 | 4.7% | Sustainability-focused consumer preferences reshape the demand landscape for rubber products in Qatar. |
Note - Market size estimations and growth projections presented in this report are based on 6Wresearch's advanced forecasting approach, validated with industry datasets as of June 2026.
Qatar Rubber Market Synopsis
The Qatar Rubber Market is projected to reach 5.0% and witness significant growth during the forecast period (2026-2032). This market encompasses a variety of rubber products and materials integral to numerous industries, including automotive, construction, manufacturing, and consumer goods. Key products within this market range from rubber sheets and hoses to tires, belts, seals, and various components critical for operational efficiency.
Qatar Rubber Market Growth Drivers
The growth of the Qatar Rubber Market is primarily driven by several interlinked factors that propel demand across multiple sectors:
- The ongoing industrial development and large-scale infrastructure projects in Qatar have significantly increased the demand for rubber products, particularly in construction and manufacturing.
- A robust growth trajectory in the automotive sector is a critical factor, as it generates substantial demand for rubber components, especially tires and automotive rubber parts.
- Consumer goods, including footwear and various rubber items, continue to stimulate market growth as the population's purchasing power increases.
- Efforts to diversify Qatar's economy are enhancing various sectors, including rubber and plastics manufacturing, creating a more conducive environment for market expansion.
- Government initiatives aimed at fostering a sustainable industrial ecosystem will also encourage investment in the rubber sector, further solidifying its growth potential.
Qatar Rubber Market Challenges and Restraints
Despite promising growth prospects, the Qatar Rubber Market faces distinct challenges that could hinder its expansion:
- A significant dependence on imported rubber products can introduce vulnerabilities related to pricing fluctuations and supply chain management, impacting market stability.
- Competition from synthetic materials, including plastics and elastomers, presents challenges as they may offer cost advantages in certain applications, affecting demand for natural rubber.
- Sustainability concerns and growing regulations regarding waste management and recycling practices are pressuring the rubber industry to adapt, necessitating investment in eco-friendly solutions.
- The volatility in raw material prices can adversely affect profit margins, making financial forecasting and planning an ongoing challenge for market participants.
- Market dynamics influenced by global economic conditions, including trade tensions and tariffs, may also create an unpredictable environment for the Qatar rubber sector.
Qatar Rubber Market Government Investment and Initiatives
The Qatari government has been proactive in fostering a robust economic landscape for the rubber market through various investment initiatives and development plans. Significant public spending on infrastructure projects, such as roads, buildings, and transport systems, has catalyzed an increased need for rubber products. Furthermore, the government has introduced incentives aimed at promoting local rubber and plastics manufacturing, thereby enhancing self-sufficiency and reducing reliance on imports.
Moreover, the National Vision 2030 outlines strategic goals that encompass sustainable development, paving the way for advancements in the rubber sector that prioritize environmental responsibility. Collaborative ventures between public and private sectors are encouraged to stimulate innovation and technological adaptation within the industry, creating a more competitive market landscape.
Qatar Rubber Market Latest Developments (May 2025 - June 2026)
Recent developments within the Qatar Rubber Market indicate a shifting focus towards sustainability and innovation. Industry players are increasingly adopting eco-friendly production practices, responding to heightened consumer demand for sustainable products. The sector is witnessing a gradual integration of recycled materials in rubber production, aligning with both market trends and governmental sustainability initiatives.
Additionally, there is a noticeable upsurge in technological advancements aimed at enhancing manufacturing processes, which promise to improve efficiency and reduce waste. The growing emphasis on personal protective equipment due to public health concerns has created new opportunities for rubber products tailored to meet safety standards. Overall, these developments highlight a dynamic shift in the market, pointing towards a more holistic approach that amalgamates growth with sustainability.
Qatar Rubber Market - Key Attractiveness of the Report
- 10 Years of Market Numbers
- Historical Data Starting from 2022 to 2025
- Base Year: 2025
- Forecast Data until 2032
- Key Performance Indicators Impacting the Market
- Major Upcoming Developments and Projects
Key Highlights of the Report:
- Qatar Rubber Market Outlook
- Market Size of Qatar Rubber Market, 2025
- Forecast of Qatar Rubber Market, 2032
- Historical Data and Forecast of Qatar Rubber Revenues & Volume for the Period 2022-2032F
- Qatar Rubber Market Trend Evolution
- Qatar Rubber Market Drivers and Challenges
- Qatar Rubber Price Trends
- Qatar Rubber Porter's Five Forces
- Qatar Rubber Industry Life Cycle
- Historical Data and Forecast of Qatar Rubber Market Revenues & Volume By Product Type for the Period 2022-2032F
- Historical Data and Forecast of Qatar Rubber Market Revenues & Volume By Natural Rubber for the Period 2022-2032F
- Historical Data and Forecast of Qatar Rubber Market Revenues & Volume By Synthetic Rubber for the Period 2022-2032F
- Historical Data and Forecast of Qatar Rubber Market Revenues & Volume By End-users for the Period 2022-2032F
- Historical Data and Forecast of Qatar Rubber Market Revenues & Volume By Automotive & Transportation for the Period 2022-2032F
- Historical Data and Forecast of Qatar Rubber Market Revenues & Volume By Building & Construction for the Period 2022-2032F
- Historical Data and Forecast of Qatar Rubber Market Revenues & Volume By Industrial Machinery & Equipment for the Period 2022-2032F
- Historical Data and Forecast of Qatar Rubber Market Revenues & Volume By Others for the Period 2022-2032F
- Qatar Rubber Import Export Trade Statistics
- Market Opportunity Assessment By Product Type
- Market Opportunity Assessment By End-users
- Qatar Rubber Top Companies Market Share
- Qatar Rubber Competitive Benchmarking By Technical and Operational Parameters
- Qatar Rubber Company Profiles
- Qatar Rubber Key Strategic Recommendations
Frequently Asked Questions About the Market Study (FAQs):
The primary applications of rubber in Qatar include automotive manufacturing, construction materials, and consumer goods like footwear.
Government policies promoting local manufacturing, infrastructure development, and sustainability have a significant positive influence on the rubber market's growth.
The market faces challenges such as dependence on imports, competition from synthetic alternatives, and sustainability regulations impacting production practices.
While the pandemic initially disrupted supply chains and reduced demand, the recovery has fostered increased demand for rubber products, especially in health-related applications.
6Wresearch actively monitors the Qatar Rubber Market and publishes its comprehensive annual report, highlighting emerging trends, growth drivers, revenue analysis, and forecast outlook. Our insights help businesses to make data-backed strategic decisions with ongoing market dynamics. Our analysts track relevent industries related to the Qatar Rubber Market, allowing our clients with actionable intelligence and reliable forecasts tailored to emerging regional needs.
Yes, we provide customisation as per your requirements. To learn more, feel free to contact us on sales@6wresearch.com
1 Executive Summary |
2 Introduction |
2.1 Key Highlights of the Report |
2.2 Report Description |
2.3 Market Scope & Segmentation |
2.4 Research Methodology |
2.5 Assumptions |
3 Qatar Rubber Market Overview |
3.1 Qatar Country Macro Economic Indicators |
3.2 Qatar Rubber Market Revenues & Volume, 2022 & 2032F |
3.3 Qatar Rubber Market - Industry Life Cycle |
3.4 Qatar Rubber Market - Porter's Five Forces |
3.5 Qatar Rubber Market Revenues & Volume Share, By Product Type, 2022 & 2032F |
3.6 Qatar Rubber Market Revenues & Volume Share, By End-users, 2022 & 2032F |
4 Qatar Rubber Market Dynamics |
4.1 Impact Analysis |
4.2 Market Drivers |
4.3 Market Restraints |
5 Qatar Rubber Market Trends |
6 Qatar Rubber Market, By Types |
6.1 Qatar Rubber Market, By Product Type |
6.1.1 Overview and Analysis |
6.1.2 Qatar Rubber Market Revenues & Volume, By Product Type, 2022-2032F |
6.1.3 Qatar Rubber Market Revenues & Volume, By Natural Rubber, 2022-2032F |
6.1.4 Qatar Rubber Market Revenues & Volume, By Synthetic Rubber, 2022-2032F |
6.2 Qatar Rubber Market, By End-users |
6.2.1 Overview and Analysis |
6.2.2 Qatar Rubber Market Revenues & Volume, By Automotive & Transportation, 2022-2032F |
6.2.3 Qatar Rubber Market Revenues & Volume, By Building & Construction, 2022-2032F |
6.2.4 Qatar Rubber Market Revenues & Volume, By Industrial Machinery & Equipment, 2022-2032F |
6.2.5 Qatar Rubber Market Revenues & Volume, By Others, 2022-2032F |
7 Qatar Rubber Market Import-Export Trade Statistics |
7.1 Qatar Rubber Market Export to Major Countries |
7.2 Qatar Rubber Market Imports from Major Countries |
8 Qatar Rubber Market Key Performance Indicators |
9 Qatar Rubber Market - Opportunity Assessment |
9.1 Qatar Rubber Market Opportunity Assessment, By Product Type, 2022 & 2032F |
9.2 Qatar Rubber Market Opportunity Assessment, By End-users, 2022 & 2032F |
10 Qatar Rubber Market - Competitive Landscape |
10.1 Qatar Rubber Market Revenue Share, By Companies, 2025 |
10.2 Qatar Rubber Market Competitive Benchmarking, By Operating and Technical Parameters |
11 Company Profiles |
12 Recommendations |
13 Disclaimer |
Global Go To Market Strategy - 2030
Export potential enables firms to identify high-growth global markets with greater confidence by combining advanced trade intelligence with a structured quantitative methodology. The framework analyzes emerging demand trends and country-level import patterns while integrating macroeconomic and trade datasets such as GDP and population forecasts, bilateral import–export flows, tariff structures, elasticity differentials between developed and developing economies, geographic distance, and import demand projections. Using weighted trade values from 2020–2024 as the base period to project country-to-country export potential for 2030, these inputs are operationalized through calculated drivers such as gravity model parameters, tariff impact factors, and projected GDP per-capita growth. Through an analysis of hidden potentials, demand hotspots, and market conditions that are most favorable to success, this method enables firms to focus on target countries, maximize returns, and global expansion with data, backed by accuracy.
By factoring in the projected importer demand gap that is currently unmet and could be potential opportunity, it identifies the potential for the Exporter (Country) among 190 countries, against the general trade analysis, which identifies the biggest importer or exporter.
To discover high-growth global markets and optimize your business strategy:
Click Here
Pricing
- Single User License$ 1,995
- Department License$ 2,400
- Site License$ 3,120
- Global License$ 3,795

Leadership Perspectives from Industry Events
Search
Thought Leadership and Analyst Meet


Our Clients
6WResearch In News
- India Air Conditioner Market Set for Strong Rebound in 2026 After Weather-Led Correction and GST-Driven Recovery: 6Wresearch
- ADAS in India: How Automatic Emergency Braking, Blind Spot Detection & Driver Monitoring are Transforming Road Safety
- Doha a strategic location for EV manufacturing hub: IPA Qatar
- Demand for luxury TVs surging in the GCC, says Samsung
- Empowering Growth: The Thriving Journey of Bangladesh’s Cable Industry
- Demand for luxury TVs surging in the GCC, says Samsung
Latest Reports
- Poland Fire Protection Systems Market (2026-2032)
- Cape Verde Portable Hand-Thrown Extinguisher Market (2026-2032)
- Canada Portable Hand-Thrown Extinguisher Market (2026-2032)
- Cameroon Portable Hand-Thrown Extinguisher Market (2026-2032)
- Burundi Portable Hand-Thrown Extinguisher Market (2026-2032)
- Burkina Faso Portable Hand-Thrown Extinguisher Market (2026-2032)
- Bulgaria Portable Hand-Thrown Extinguisher Market (2026-2032)
- Brunei Portable Hand-Thrown Extinguisher Market (2026-2032)
- Botswana Portable Hand-Thrown Extinguisher Market (2026-2032)
- Bosnia and Herzegovina Portable Hand-Thrown Extinguisher Market (2026-2032)
Industry Events and Analyst Meet

HIMTEX 2026

India Refining Summit 2026

India EV Show 2026

EV tech India Expo 2026

Auto Tech Asia 2026
Whitepaper
- Middle East & Africa Commercial Security Market Click here to view more.
- Middle East & Africa Fire Safety Systems & Equipment Market Click here to view more.
- GCC Drone Market Click here to view more.
- Middle East Lighting Fixture Market Click here to view more.
- GCC Physical & Perimeter Security Market Click here to view more.