Qatar Rubber Vulcanization Market (2026-2032) Outlook | Industry, Analysis, Value, Trends, Growth, Forecast, Share, Size, Companies & Revenue
Market Forecast By Type (Accelerator, Vulcanizing Agent, Activator, Other), By Application (Automotive, Medical, Industrial, Consumer Goods, Other) And Competitive Landscape
| Product Code: ETC088740 | Publication Date: Jun 2021 | Updated Date: Jun 2026 | Product Type: Report | |
| Publisher: 6Wresearch | Author: Ravi Bhandari | No. of Pages: 70 | No. of Figures: 35 | No. of Tables: 5 |
Qatar Rubber Vulcanization Market Size, Share & Growth Rate
The Qatar Rubber Vulcanization Market was estimated at USD 684 Million in 2025 and is projected to reach USD 973 Million by 2032, growing at a CAGR of 5.2% from 2026 to 2032. This growth trajectory is driven by robust demand from the automotive and construction sectors, both of which are seeing significant investment as Qatar continues its economic diversification. Additionally, the increasing regional exports to countries like Saudi Arabia and the UAE further amplify this demand.
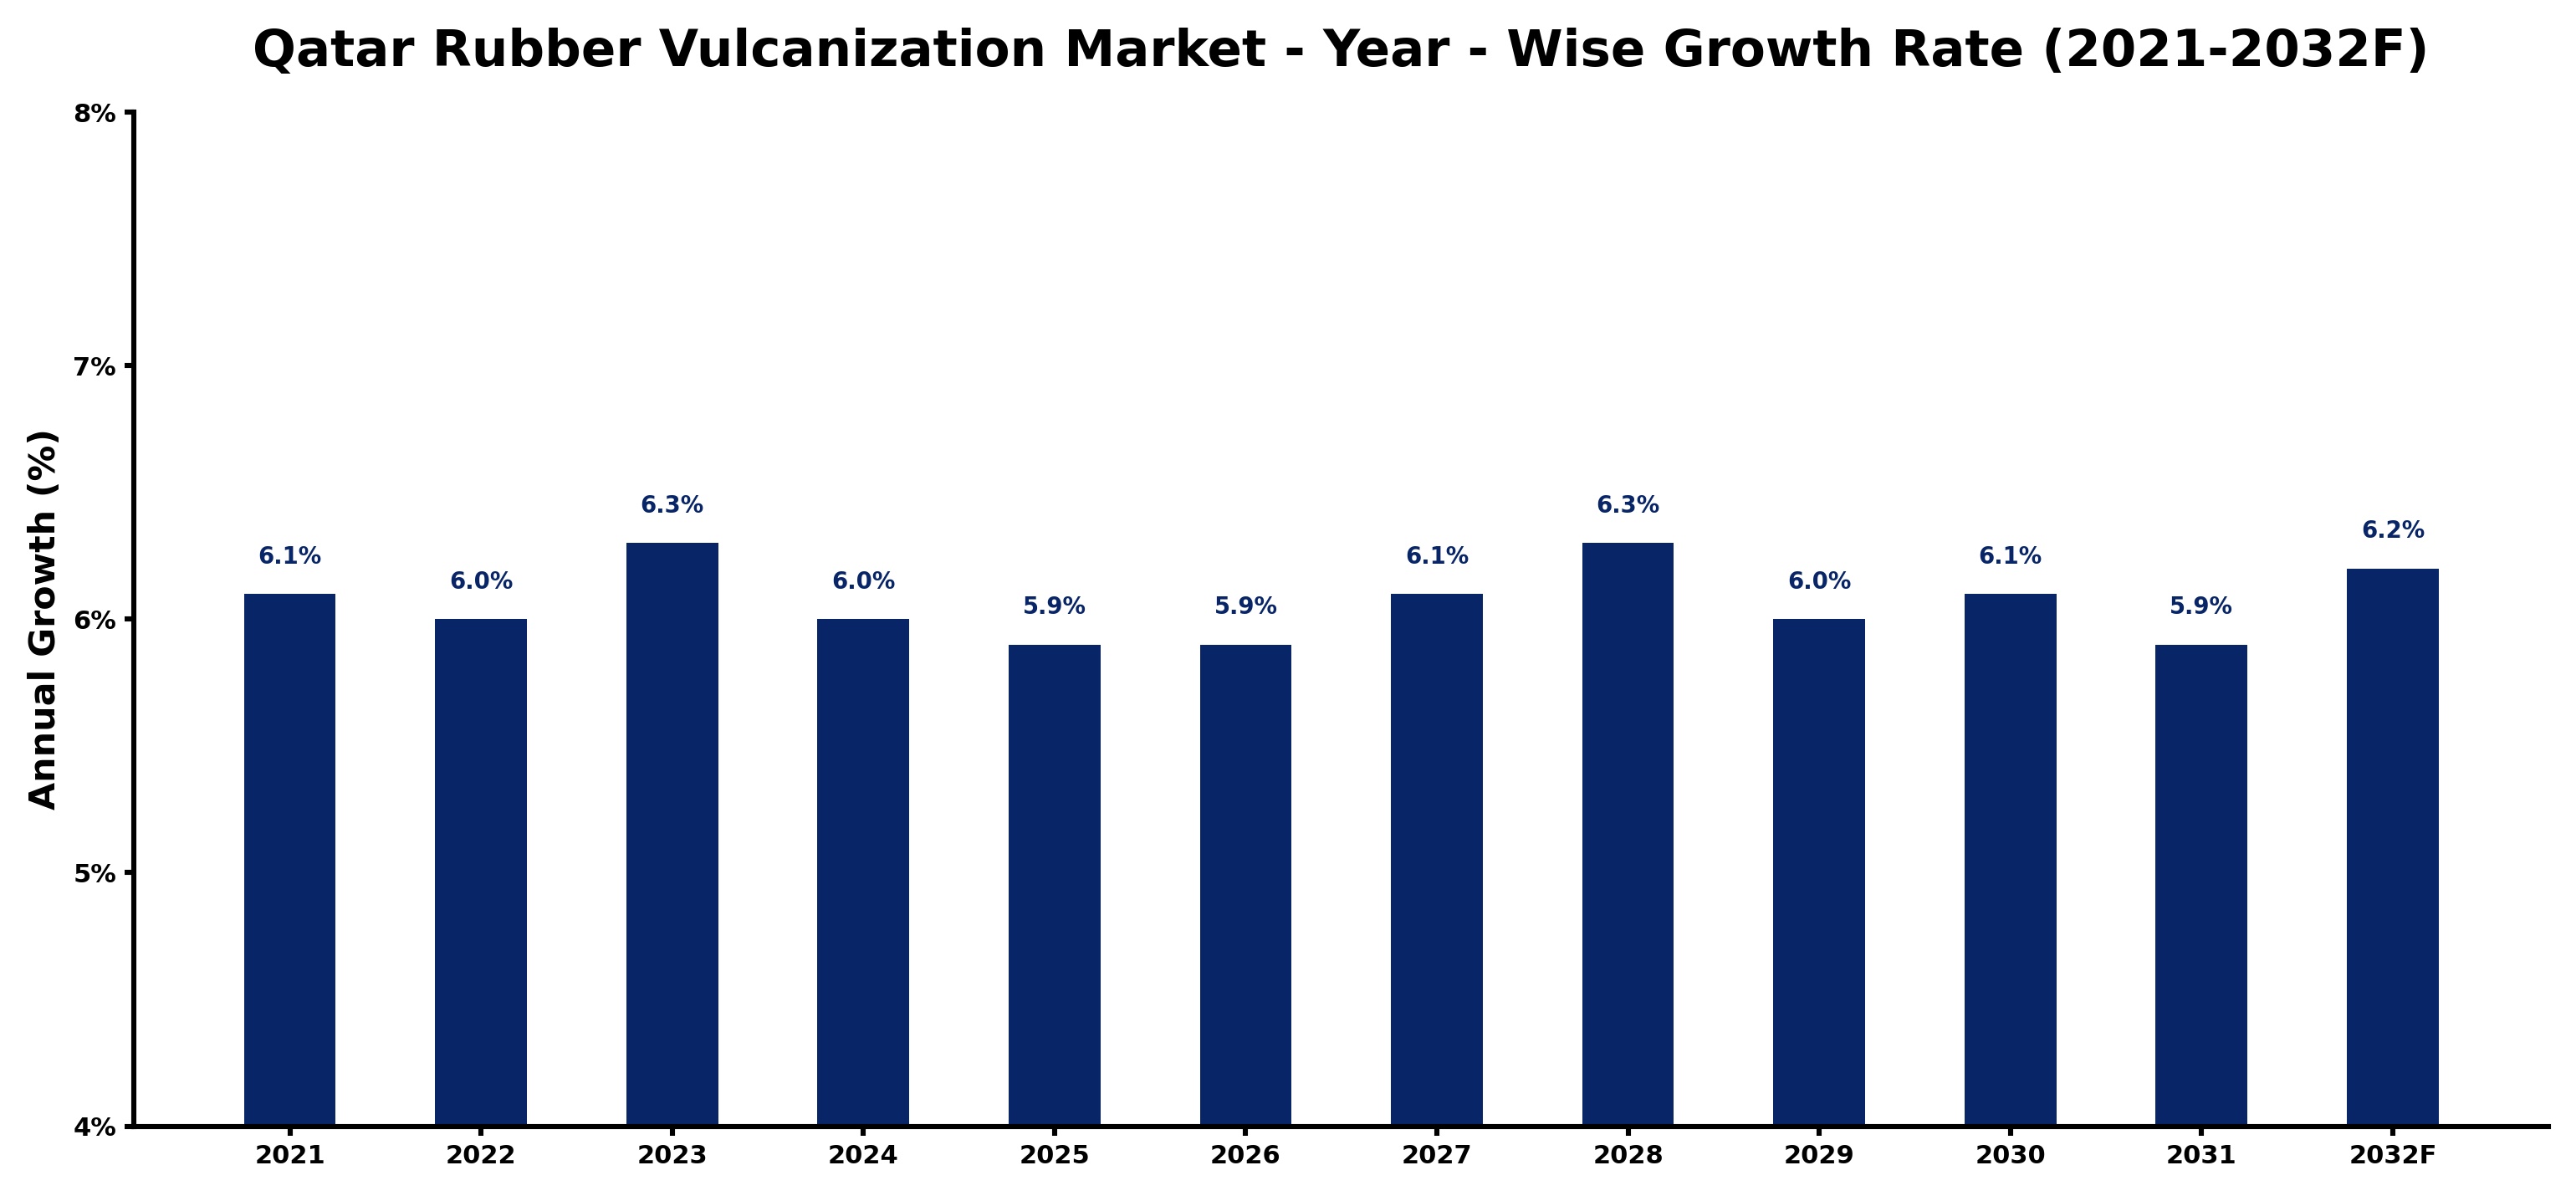
Qatar Rubber Vulcanization Market Growth Rate Analysis (2021-2032)
The Qatar Rubber Vulcanization market displays a stable growth pattern, with a 6.1% increase in 2021, followed by slight fluctuations over the coming years. In 2022, growth moderated to 6.0%, while 2023 saw a resurgence to 6.3%. This growth can be attributed to rising consumer demand driven by expanding industrial applications and investments in the construction and automotive sectors. As the market anticipates 6.0% in 2024 and 5.9% through 2025 and 2026, these figures reflect a mature phase influenced by infrastructure developments and ongoing energy transition efforts. A return to 6.1% in 2027 and a peak of 6.3% in 2028 suggests a recommitment to technological advancements in rubber production, aligning with broader economic goals.
Qatar Rubber Vulcanization Market Year-wise Growth Rate and Key Drivers
This graph highlights how the Qatar Rubber Vulcanization Market has steadily grown over the past five years, supported by major growth factors.
The table below presents the year‑wise growth rates along with the key drivers influencing the market
| Year | Growth Rate | Major Drivers |
| 2021 | 6.1% | Technology integration in construction enhanced rubber product performance and durability |
| 2022 | 6.0% | Improved capacity utilization drove demand for advanced rubber compounds |
| 2023 | 6.3% | Domestic LNG infrastructure projects demand increased rubber component production |
| 2024 | 6.0% | LNG infrastructure development drives demand for high performance rubber products |
| 2025 | 5.9% | Vulcanization investments drive increased rubber production for infrastructure projects |
| 2026 | 5.9% | LNG infrastructure projects drive rubber component manufacturing demand growth |
| 2027 | 6.1% | Technology integration streamlined rubber processing in LNG infrastructure projects |
| 2028 | 6.3% | Vulcanization efficiency improvements enhanced regional rubber product competitiveness |
| 2029 | 6.0% | Export driven infrastructure upgrades boosted rubber product manufacturing demand |
| 2030 | 6.1% | Modernized LNG facilities drive rubber component manufacturing demands |
| 2031 | 5.9% | LNG infrastructure projects demand advanced rubber components for durability |
| 2032 | 6.2% | Higher refinery maintenance frequency boosts rubber component demand across sectors |
Note - Market size estimations and growth projections presented in this report are based on 6Wresearch’s advanced forecasting approach, validated with industry datasets as of June 2026.
Qatar Rubber Vulcanization Market Synopsis
The Qatari rubber vulcanization market has become increasingly competitive as local producers ramp up output to meet both domestic and regional needs. This is particularly evident in the tire and automotive parts sectors, where Qatari manufacturers are positioned to serve neighboring markets efficiently. Demand for high-quality, durable rubber goods is driving innovation and production capacity.
In 2018, the revenue generated from this industry was significant, amounting to QR 9.7 billion (USD 2.10 billion). As Qatar enhances its infrastructure development and manufacturing capabilities, the need for rubber-based products continues to surge. This trend will likely sustain growth in the coming years, underscoring the market's pivotal role in the nation's industrial ecosystem.
Qatar Rubber Vulcanization Market Key Takeaways
- The market is poised for steady growth driven by the automotive and construction sectors.
- Regional exports to neighboring countries are an essential growth engine.
- Qatar's focus on infrastructure development is enhancing the demand for rubber products.
- Technological advancements in rubber processing are improving product quality and production efficiency.
- Supply chain resilience will be crucial for the market’s recovery post-COVID-19.
Evaluation of Restraints in Qatar Rubber Vulcanization Market
The Qatar rubber vulcanization market faces notable restraints that could hinder its growth trajectory. One primary concern is the reliance on sulfur and other vulcanizing agents, which can pose supply chain risks stemming from fluctuations in availability and price volatility. Furthermore, the industry is navigating the aftereffects of the COVID-19 pandemic, which disrupted raw material supply lines and exposed vulnerabilities in production processes. Manufacturers must adapt by exploring alternative feedstocks and optimizing production methods to enhance resilience and maintain market momentum.
Qatar Rubber Vulcanization Market Trends
Current trends indicate a shift towards sustainable practices within the rubber vulcanization industry. As environmental concerns gain prominence, Qatari manufacturers are exploring eco-friendly vulcanizing agents and recycling methods to minimize waste. Furthermore, the increasing adoption of advanced technologies like automation and smart manufacturing is revolutionizing production efficiency, contributing to higher quality outputs. These trends signify an evolution in the market, aligning with global sustainability goals.
Qatar Rubber Vulcanization Market Opportunities
The Qatar rubber vulcanization market presents ample growth and investment opportunities, particularly in the realms of automotive components and construction materials. As infrastructure projects expand, the demand for high-quality rubber products is expected to rise. Companies that innovate through technology and improve their product lines to include sustainable options will likely capture significant market share. Additionally, potential partnerships with regional manufacturers could enhance export capacities, positioning Qatari firms favorably within the Gulf Cooperation Council (GCC) market.
Government Initiatives in the Qatar Rubber Vulcanization Market
The Qatari government has recognized the importance of the rubber industry within its broader economic vision. Initiatives aimed at boosting industrialization and infrastructure development are actively promoting the rubber vulcanization sector. Public spending on construction and transport infrastructure is set to increase, alongside efforts to incentivize local manufacturing through favorable regulations and support programs. These initiatives create an environment conducive to growth in the rubber market, fostering innovation and competitiveness.
Future Insights of the Qatar Rubber Vulcanization Market
Looking ahead to the period between 2026 and 2032, the Qatar rubber vulcanization market is expected to thrive as the country invests heavily in diversifying its economy. Enhanced infrastructure projects and the ongoing expansion of the automotive sector will significantly bolster demand for vulcanized rubber products. With a focus on sustainability, companies that adapt and innovate will be well-positioned to seize emerging opportunities, driving the market towards a prosperous future.
Qatar Rubber Vulcanization Market Latest Developments (May 2025 - June 2026)
Recent developments in the Qatar rubber vulcanization market indicate a growing emphasis on technological integration within manufacturing processes. Companies are increasingly investing in state-of-the-art machinery to improve efficiency and product quality. Moreover, collaborations among industry stakeholders are becoming more common, focused on enhancing supply chain resilience and exploring sustainable practices to mitigate environmental impacts. These directions signal a proactive approach to meeting both local and regional demands.
Qatar Rubber Vulcanization Market - Key Attractiveness of the Report
- 10 Years of Market Numbers
- Historical Data Starting from 2022 to 2025
- Base Year: 2025
- Forecast Data until 2032
- Key Performance Indicators Impacting the Market
- Major Upcoming Developments and Projects
Key Highlights of the Report:
- Qatar Rubber Vulcanization Market Outlook
- Market Size of Qatar Rubber Vulcanization Market, 2025
- Forecast of Qatar Rubber Vulcanization Market, 2032
- Historical Data and Forecast of Qatar Rubber Vulcanization Revenues & Volume for the Period 2022-2032F
- Qatar Rubber Vulcanization Market Trend Evolution
- Qatar Rubber Vulcanization Market Drivers and Challenges
- Qatar Rubber Vulcanization Price Trends
- Qatar Rubber Vulcanization Porter's Five Forces
- Qatar Rubber Vulcanization Industry Life Cycle
- Historical Data and Forecast of Qatar Rubber Vulcanization Market Revenues & Volume By Type for the Period 2022-2032F
- Historical Data and Forecast of Qatar Rubber Vulcanization Market Revenues & Volume By Accelerator for the Period 2022-2032F
- Historical Data and Forecast of Qatar Rubber Vulcanization Market Revenues & Volume By Vulcanizing Agent for the Period 2022-2032F
- Historical Data and Forecast of Qatar Rubber Vulcanization Market Revenues & Volume By Activator for the Period 2022-2032F
- Historical Data and Forecast of Qatar Rubber Vulcanization Market Revenues & Volume By Other for the Period 2022-2032F
- Historical Data and Forecast of Qatar Rubber Vulcanization Market Revenues & Volume By Application for the Period 2022-2032F
- Historical Data and Forecast of Qatar Rubber Vulcanization Market Revenues & Volume By Automotive for the Period 2022-2032F
- Historical Data and Forecast of Qatar Rubber Vulcanization Market Revenues & Volume By Medical for the Period 2022-2032F
- Historical Data and Forecast of Qatar Rubber Vulcanization Market Revenues & Volume By Industrial for the Period 2022-2032F
- Historical Data and Forecast of Qatar Rubber Vulcanization Market Revenues & Volume By Consumer Goods for the Period 2022-2032F
- Historical Data and Forecast of Qatar Rubber Vulcanization Market Revenues & Volume By Other for the Period 2022-2032F
- Qatar Rubber Vulcanization Import Export Trade Statistics
- Market Opportunity Assessment By Type
- Market Opportunity Assessment By Application
- Qatar Rubber Vulcanization Top Companies Market Share
- Qatar Rubber Vulcanization Competitive Benchmarking By Technical and Operational Parameters
- Qatar Rubber Vulcanization Company Profiles
- Qatar Rubber Vulcanization Key Strategic Recommendations
Qatar Rubber Vulcanization Market - Frequently Asked Questions
The Qatar Rubber Vulcanization Market was estimated at USD 684 Million in 2025 and is projected to reach USD 973 Million by 2032, growing at a CAGR of 5.2% from 2026 to 2032.
The automotive and construction sectors are pivotal in driving demand, as both are experiencing significant growth due to increased infrastructure projects and vehicle production.
The pandemic led to supply chain disruptions and manufacturing challenges, impacting the availability of raw materials and altering demand patterns. Recovery strategies are now focusing on enhancing supply chain resilience.
New entrants can capitalize on the growing demand for sustainable and high-quality rubber products, especially in the automotive and construction sectors. Collaborations and innovative technologies are key areas to explore.
The Qatari government is actively promoting industrialization through initiatives that foster local manufacturing, regulatory support, and increased public spending on infrastructure, thereby benefiting the rubber vulcanization sector.
6Wresearch actively monitors the Qatar Rubber Vulcanization Market and publishes its comprehensive annual report, highlighting emerging trends, growth drivers, revenue analysis, and forecast outlook. Our insights help businesses to make data-backed strategic decisions with ongoing market dynamics. Our analysts track relevent industries related to the Qatar Rubber Vulcanization Market, allowing our clients with actionable intelligence and reliable forecasts tailored to emerging regional needs.
Yes, we provide customisation as per your requirements. To learn more, feel free to contact us on sales@6wresearch.com
1 Executive Summary |
2 Introduction |
2.1 Key Highlights of the Report |
2.2 Report Description |
2.3 Market Scope & Segmentation |
2.4 Research Methodology |
2.5 Assumptions |
3 Qatar Rubber Vulcanization Market Overview |
3.1 Qatar Country Macro Economic Indicators |
3.2 Qatar Rubber Vulcanization Market Revenues & Volume, 2022 & 2032F |
3.3 Qatar Rubber Vulcanization Market - Industry Life Cycle |
3.4 Qatar Rubber Vulcanization Market - Porter's Five Forces |
3.5 Qatar Rubber Vulcanization Market Revenues & Volume Share, By Type, 2022 & 2032F |
3.6 Qatar Rubber Vulcanization Market Revenues & Volume Share, By Application, 2022 & 2032F |
4 Qatar Rubber Vulcanization Market Dynamics |
4.1 Impact Analysis |
4.2 Market Drivers |
4.3 Market Restraints |
5 Qatar Rubber Vulcanization Market Trends |
6 Qatar Rubber Vulcanization Market, By Types |
6.1 Qatar Rubber Vulcanization Market, By Type |
6.1.1 Overview and Analysis |
6.1.2 Qatar Rubber Vulcanization Market Revenues & Volume, By Type, 2022-2032F |
6.1.3 Qatar Rubber Vulcanization Market Revenues & Volume, By Accelerator, 2022-2032F |
6.1.4 Qatar Rubber Vulcanization Market Revenues & Volume, By Vulcanizing Agent, 2022-2032F |
6.1.5 Qatar Rubber Vulcanization Market Revenues & Volume, By Activator, 2022-2032F |
6.1.6 Qatar Rubber Vulcanization Market Revenues & Volume, By Other, 2022-2032F |
6.2 Qatar Rubber Vulcanization Market, By Application |
6.2.1 Overview and Analysis |
6.2.2 Qatar Rubber Vulcanization Market Revenues & Volume, By Automotive, 2022-2032F |
6.2.3 Qatar Rubber Vulcanization Market Revenues & Volume, By Medical, 2022-2032F |
6.2.4 Qatar Rubber Vulcanization Market Revenues & Volume, By Industrial, 2022-2032F |
6.2.5 Qatar Rubber Vulcanization Market Revenues & Volume, By Consumer Goods, 2022-2032F |
6.2.6 Qatar Rubber Vulcanization Market Revenues & Volume, By Other, 2022-2032F |
7 Qatar Rubber Vulcanization Market Import-Export Trade Statistics |
7.1 Qatar Rubber Vulcanization Market Export to Major Countries |
7.2 Qatar Rubber Vulcanization Market Imports from Major Countries |
8 Qatar Rubber Vulcanization Market Key Performance Indicators |
9 Qatar Rubber Vulcanization Market - Opportunity Assessment |
9.1 Qatar Rubber Vulcanization Market Opportunity Assessment, By Type, 2022 & 2032F |
9.2 Qatar Rubber Vulcanization Market Opportunity Assessment, By Application, 2022 & 2032F |
10 Qatar Rubber Vulcanization Market - Competitive Landscape |
10.1 Qatar Rubber Vulcanization Market Revenue Share, By Companies, 2025 |
10.2 Qatar Rubber Vulcanization Market Competitive Benchmarking, By Operating and Technical Parameters |
11 Company Profiles |
12 Recommendations |
13 Disclaimer |
Global Go To Market Strategy - 2030
Export potential enables firms to identify high-growth global markets with greater confidence by combining advanced trade intelligence with a structured quantitative methodology. The framework analyzes emerging demand trends and country-level import patterns while integrating macroeconomic and trade datasets such as GDP and population forecasts, bilateral import–export flows, tariff structures, elasticity differentials between developed and developing economies, geographic distance, and import demand projections. Using weighted trade values from 2020–2024 as the base period to project country-to-country export potential for 2030, these inputs are operationalized through calculated drivers such as gravity model parameters, tariff impact factors, and projected GDP per-capita growth. Through an analysis of hidden potentials, demand hotspots, and market conditions that are most favorable to success, this method enables firms to focus on target countries, maximize returns, and global expansion with data, backed by accuracy.
By factoring in the projected importer demand gap that is currently unmet and could be potential opportunity, it identifies the potential for the Exporter (Country) among 190 countries, against the general trade analysis, which identifies the biggest importer or exporter.
To discover high-growth global markets and optimize your business strategy:
Click Here
Pricing
- Single User License$ 1,995
- Department License$ 2,400
- Site License$ 3,120
- Global License$ 3,795

Leadership Perspectives from Industry Events
Search
Thought Leadership and Analyst Meet


Our Clients
6WResearch In News
- India Air Conditioner Market Set for Strong Rebound in 2026 After Weather-Led Correction and GST-Driven Recovery: 6Wresearch
- ADAS in India: How Automatic Emergency Braking, Blind Spot Detection & Driver Monitoring are Transforming Road Safety
- Doha a strategic location for EV manufacturing hub: IPA Qatar
- Demand for luxury TVs surging in the GCC, says Samsung
- Empowering Growth: The Thriving Journey of Bangladesh’s Cable Industry
- Demand for luxury TVs surging in the GCC, says Samsung
Latest Reports
- Poland Fire Protection Systems Market (2026-2032)
- Cape Verde Portable Hand-Thrown Extinguisher Market (2026-2032)
- Canada Portable Hand-Thrown Extinguisher Market (2026-2032)
- Cameroon Portable Hand-Thrown Extinguisher Market (2026-2032)
- Burundi Portable Hand-Thrown Extinguisher Market (2026-2032)
- Burkina Faso Portable Hand-Thrown Extinguisher Market (2026-2032)
- Bulgaria Portable Hand-Thrown Extinguisher Market (2026-2032)
- Brunei Portable Hand-Thrown Extinguisher Market (2026-2032)
- Botswana Portable Hand-Thrown Extinguisher Market (2026-2032)
- Bosnia and Herzegovina Portable Hand-Thrown Extinguisher Market (2026-2032)
Industry Events and Analyst Meet

HIMTEX 2026

India Refining Summit 2026

India EV Show 2026

EV tech India Expo 2026

Auto Tech Asia 2026
Whitepaper
- Middle East & Africa Commercial Security Market Click here to view more.
- Middle East & Africa Fire Safety Systems & Equipment Market Click here to view more.
- GCC Drone Market Click here to view more.
- Middle East Lighting Fixture Market Click here to view more.
- GCC Physical & Perimeter Security Market Click here to view more.