Romania Agronomic Amino Acids Market (2026-2032) | Analysis, Outlook, Companies, Segmentation, Value, Size & Revenue, Growth, Forecast, Industry, Trends, Share, Competitive Landscape
Market Forecast By Type (Lysine, Thymine, Methionine, Glutamic Acid, Alanine, Leucine, Arginine, Others), By Source (Plant-based, Animal-based, Synthetic, Treatment Method, Foliar, Seed, Soil, Others), By Application (Soil Amendment, Chlorophyll Synthesis, Roots Development, Bud Growth and Leaves Development, Crop Resistance, Ripening, Others) And Competitive Landscape
| Product Code: ETC8963883 | Publication Date: Sep 2024 | Updated Date: Apr 2026 | Product Type: Market Research Report | |
| Publisher: 6Wresearch | Author: Summon Dutta | No. of Pages: 75 | No. of Figures: 35 | No. of Tables: 20 |
Romania Agronomic Amino Acids Market Size (2020-2030)
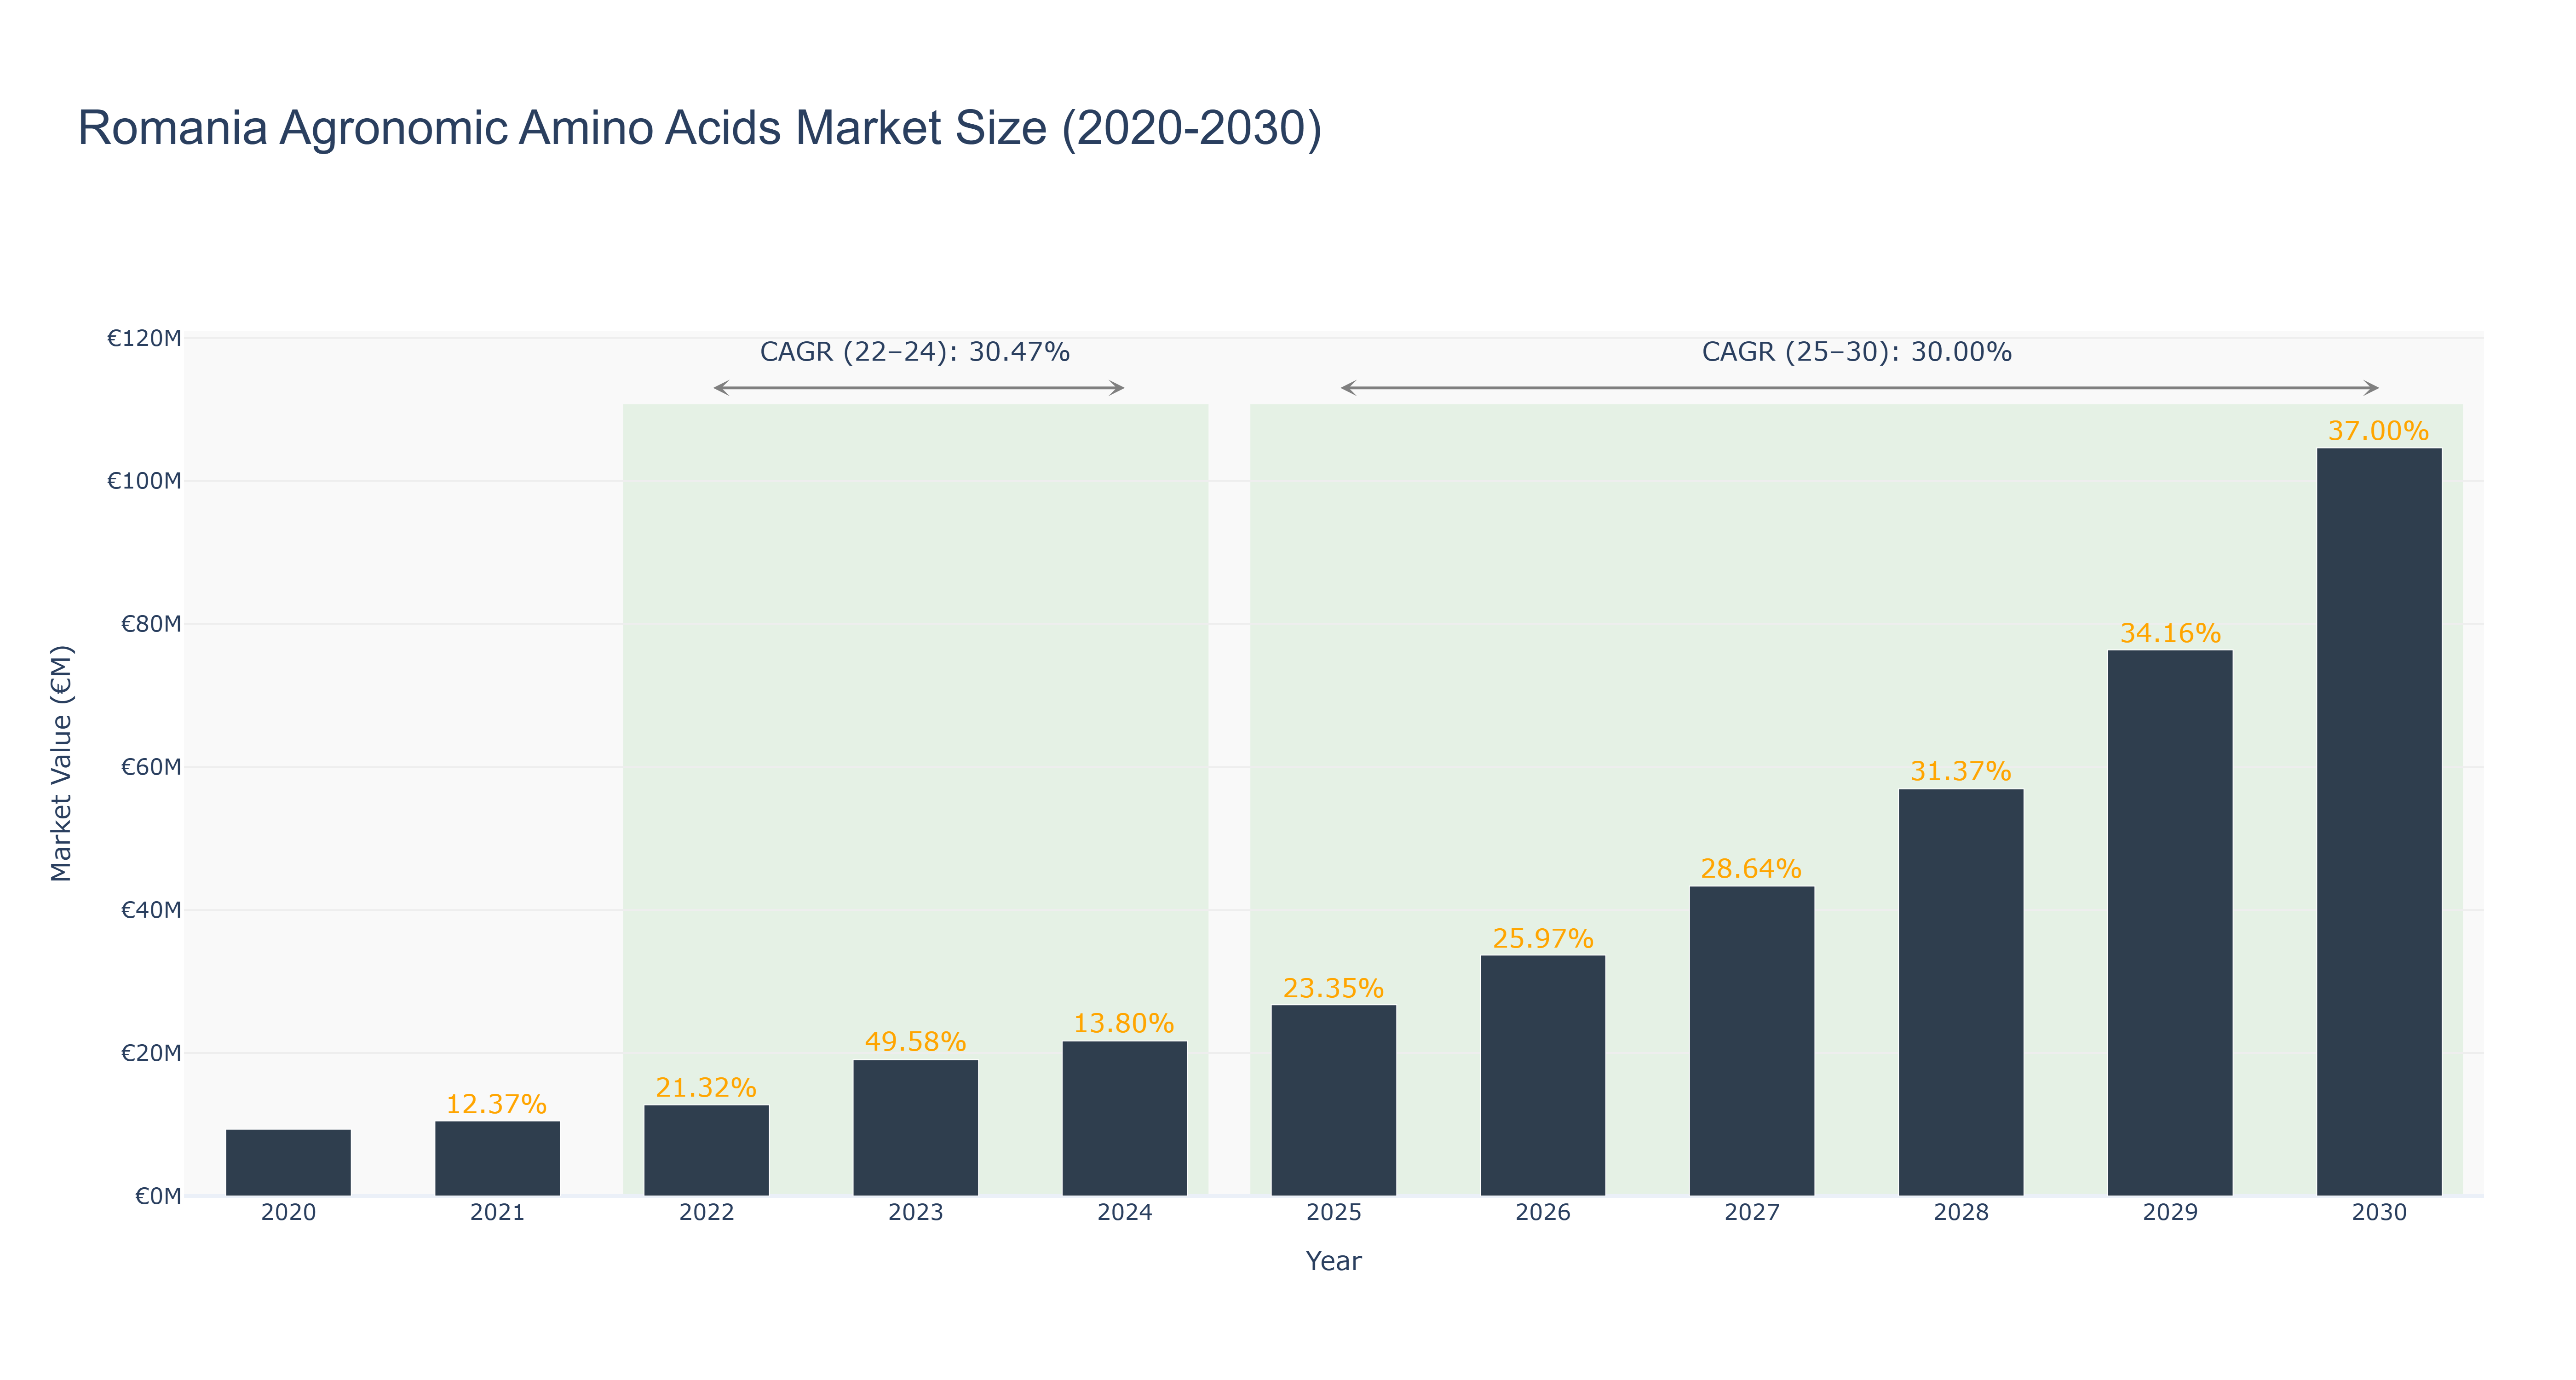
Romania Agronomic Amino Acids Market has shown a promising growth trajectory, with a peak market size of €104.65 million in 2030. The market experienced steady expansion from €9.34 million in 2020 to €21.68 million in 2024, driven by increasing demand for amino acids in agricultural applications. Forecasted growth from 2025 to 2030 is projected to continue at a CAGR of 30.0%, indicating sustained market potential. The CAGR from 2022 to 2024 was notably high at 30.47%, reflecting a period of rapid growth. The market's growth can be attributed to advancements in agricultural technology, the focus on sustainable farming practices, and the increasing awareness of the benefits of amino acids in crop production. Looking ahead, upcoming projects in Romania aim to further enhance the efficiency and effectiveness of amino acid utilization in agriculture, ensuring continued market expansion and innovation.
Romania Agronomic Amino Acids Market: Production & Trade Performance (2019-2025)
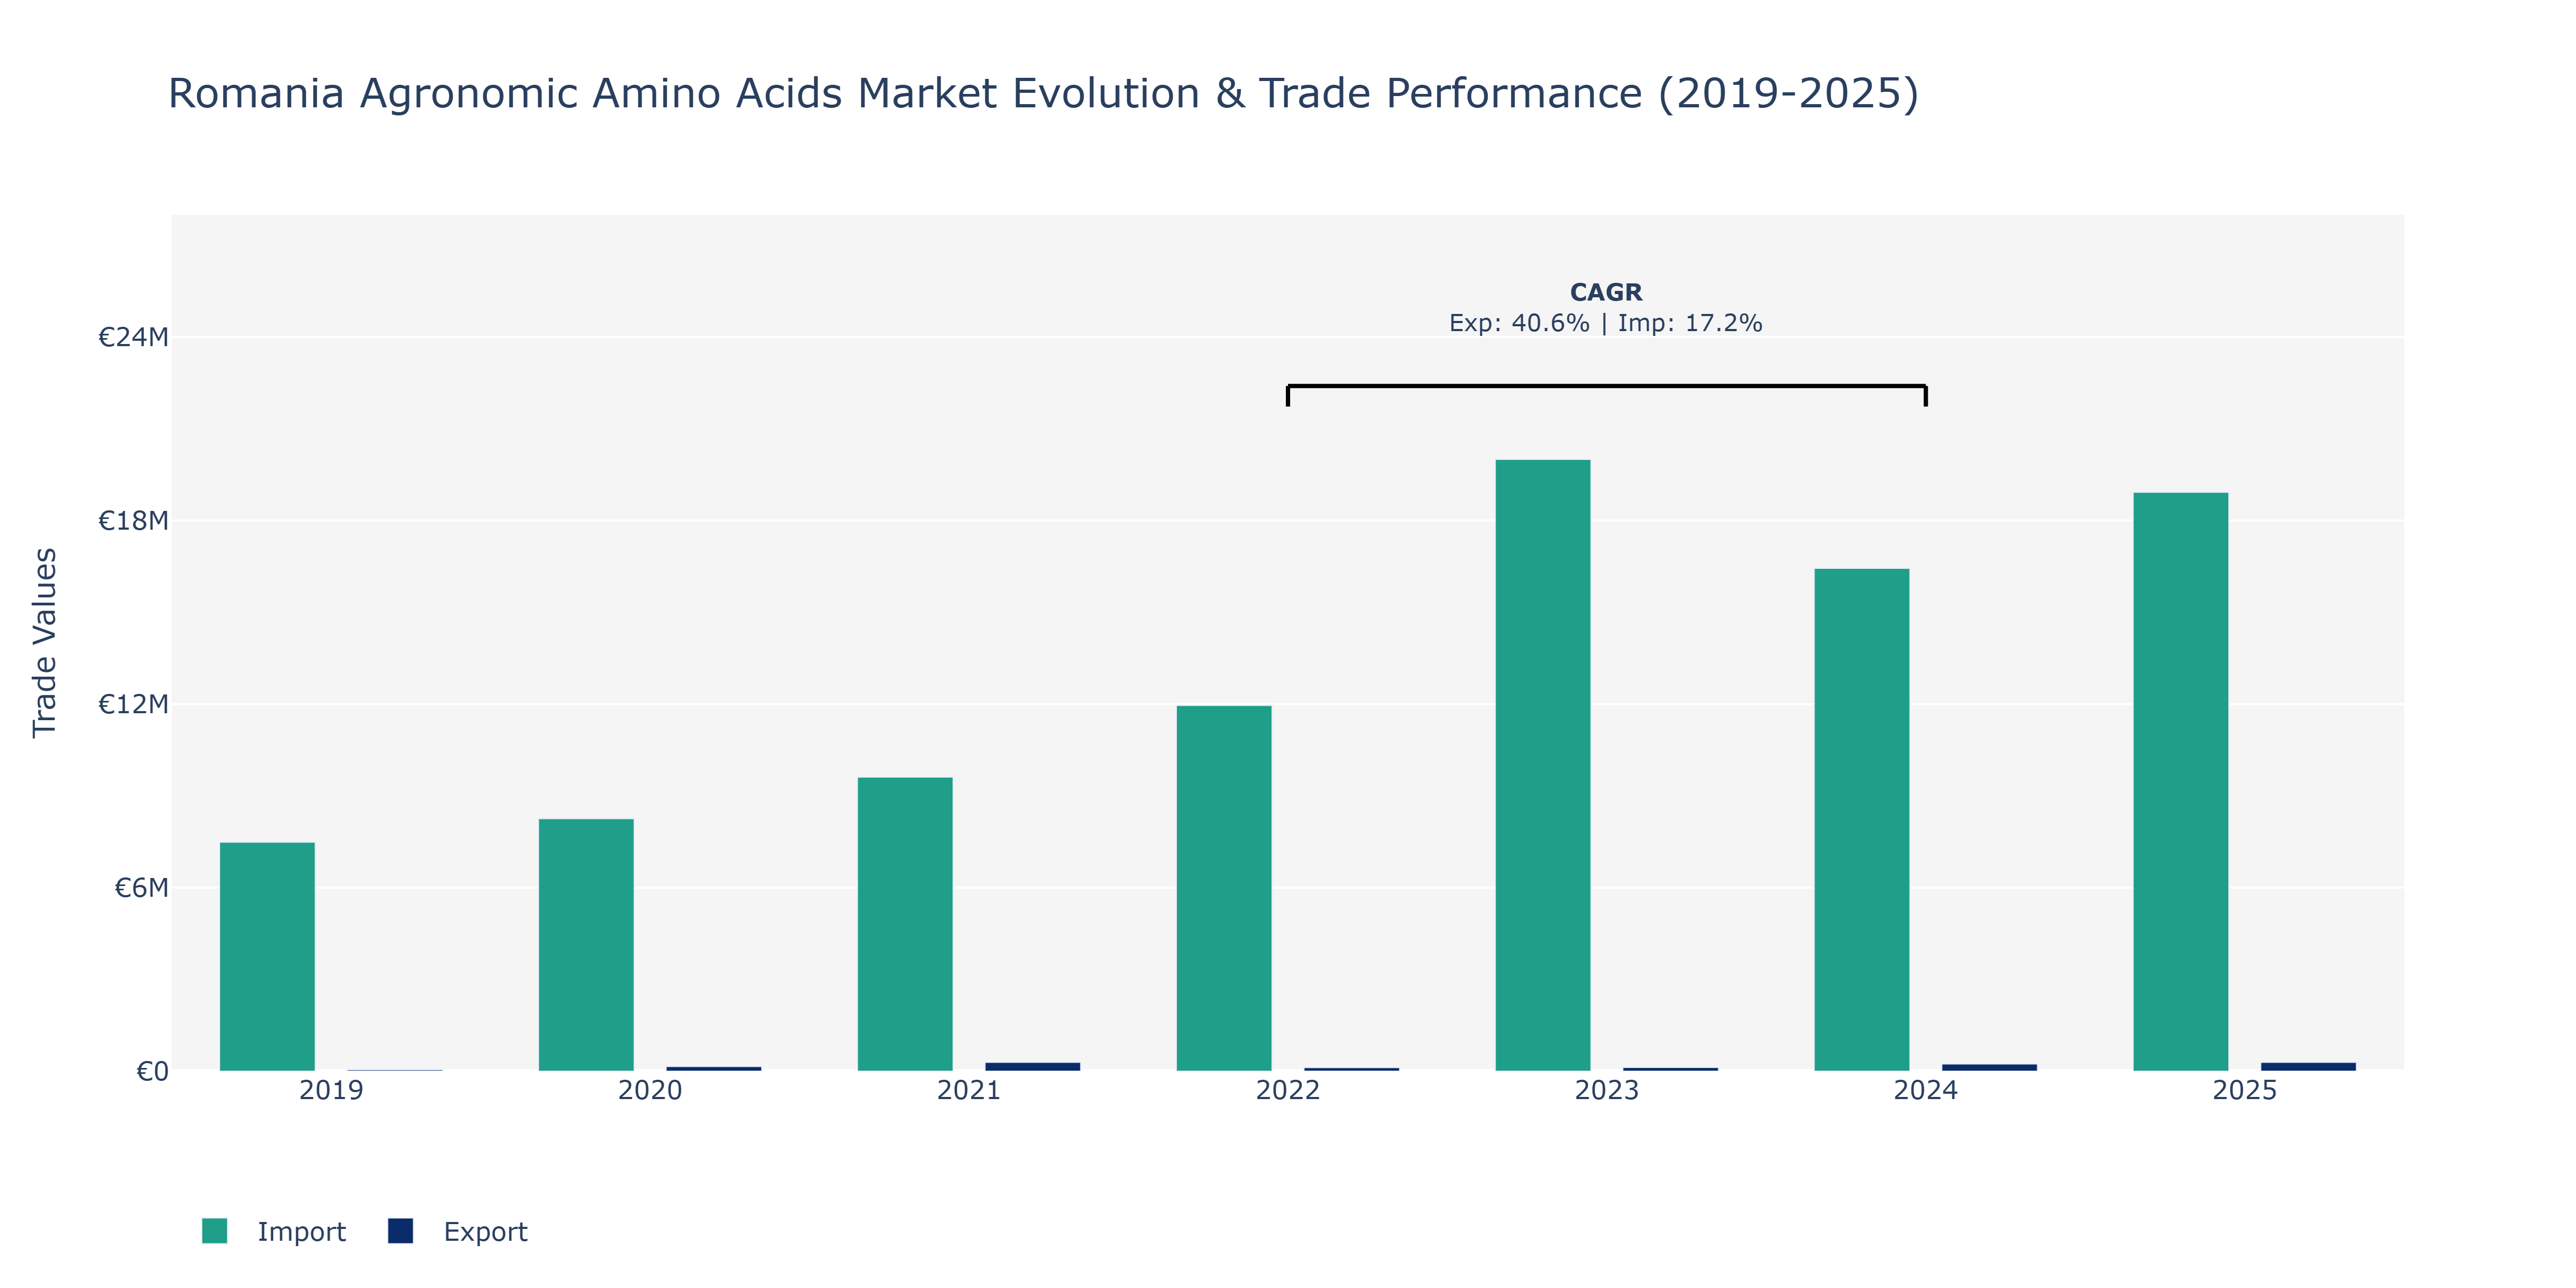
In the Romania Agronomic Amino Acids Market, exports showed a fluctuating trend over the years. Starting at €49.3 thousand in 2019, exports sharply rose to €152.23 thousand in 2020, reflecting a notable increase. However, there was a substantial drop in 2022 to €119.36 thousand before rebounding in 2023 and 2024 to €121.84 thousand and €235.88 thousand, respectively. The peak in 2024 can be attributed to increased demand for amino acids in agriculture, possibly due to innovations in sustainable farming practices in Romania. On the other hand, imports consistently increased from €7.49 million in 2019 to €18.92 million in 2025, showcasing a steady upward trajectory. This growth in imports could be linked to the country's expanding agricultural sector, likely leading to greater demand for amino acids to improve crop yields and soil quality. Such developments align with the global trend of growing interest in organic farming and sustainable agriculture practices, encouraging the use of amino acids in crop production.
Key Highlights of the Report:
- Romania Agronomic Amino Acids Market Outlook
- Market Size of Romania Agronomic Amino Acids Market, 2025
- Forecast of Romania Agronomic Amino Acids Market, 2032
- Historical Data and Forecast of Romania Agronomic Amino Acids Revenues & Volume for the Period 2022-2032F
- Romania Agronomic Amino Acids Market Trend Evolution
- Romania Agronomic Amino Acids Market Drivers and Challenges
- Romania Agronomic Amino Acids Price Trends
- Romania Agronomic Amino Acids Porter's Five Forces
- Romania Agronomic Amino Acids Industry Life Cycle
- Historical Data and Forecast of Romania Agronomic Amino Acids Market Revenues & Volume By Type for the Period 2022-2032F
- Historical Data and Forecast of Romania Agronomic Amino Acids Market Revenues & Volume By Lysine for the Period 2022-2032F
- Historical Data and Forecast of Romania Agronomic Amino Acids Market Revenues & Volume By Thymine for the Period 2022-2032F
- Historical Data and Forecast of Romania Agronomic Amino Acids Market Revenues & Volume By Methionine for the Period 2022-2032F
- Historical Data and Forecast of Romania Agronomic Amino Acids Market Revenues & Volume By Glutamic Acid for the Period 2022-2032F
- Historical Data and Forecast of Romania Agronomic Amino Acids Market Revenues & Volume By Alanine for the Period 2022-2032F
- Historical Data and Forecast of Romania Agronomic Amino Acids Market Revenues & Volume By Leucine for the Period 2022-2032F
- Historical Data and Forecast of Romania Agronomic Amino Acids Market Revenues & Volume By Arginine for the Period 2022-2032F
- Historical Data and Forecast of Romania Lysine Agronomic Amino Acids Market Revenues & Volume By Others for the Period 2022-2032F
- Historical Data and Forecast of Romania Agronomic Amino Acids Market Revenues & Volume By Source for the Period 2022-2032F
- Historical Data and Forecast of Romania Agronomic Amino Acids Market Revenues & Volume By Plant-based for the Period 2022-2032F
- Historical Data and Forecast of Romania Agronomic Amino Acids Market Revenues & Volume By Animal-based for the Period 2022-2032F
- Historical Data and Forecast of Romania Agronomic Amino Acids Market Revenues & Volume By Synthetic for the Period 2022-2032F
- Historical Data and Forecast of Romania Agronomic Amino Acids Market Revenues & Volume By Treatment Method for the Period 2022-2032F
- Historical Data and Forecast of Romania Agronomic Amino Acids Market Revenues & Volume By Foliar for the Period 2022-2032F
- Historical Data and Forecast of Romania Agronomic Amino Acids Market Revenues & Volume By Seed for the Period 2022-2032F
- Historical Data and Forecast of Romania Agronomic Amino Acids Market Revenues & Volume By Soil for the Period 2022-2032F
- Historical Data and Forecast of Romania Agronomic Amino Acids Market Revenues & Volume By Others for the Period 2022-2032F
- Historical Data and Forecast of Romania Agronomic Amino Acids Market Revenues & Volume By Application for the Period 2022-2032F
- Historical Data and Forecast of Romania Agronomic Amino Acids Market Revenues & Volume By Soil Amendment for the Period 2022-2032F
- Historical Data and Forecast of Romania Agronomic Amino Acids Market Revenues & Volume By Chlorophyll Synthesis for the Period 2022-2032F
- Historical Data and Forecast of Romania Agronomic Amino Acids Market Revenues & Volume By Roots Development for the Period 2022-2032F
- Historical Data and Forecast of Romania Agronomic Amino Acids Market Revenues & Volume By Bud Growth and Leaves Development for the Period 2022-2032F
- Historical Data and Forecast of Romania Agronomic Amino Acids Market Revenues & Volume By Crop Resistance for the Period 2022-2032F
- Historical Data and Forecast of Romania Agronomic Amino Acids Market Revenues & Volume By Ripening for the Period 2022-2032F
- Historical Data and Forecast of Romania Agronomic Amino Acids Market Revenues & Volume By Others for the Period 2022-2032F
- Romania Agronomic Amino Acids Import Export Trade Statistics
- Market Opportunity Assessment By Type
- Market Opportunity Assessment By Source
- Market Opportunity Assessment By Application
- Romania Agronomic Amino Acids Top Companies Market Share
- Romania Agronomic Amino Acids Competitive Benchmarking By Technical and Operational Parameters
- Romania Agronomic Amino Acids Company Profiles
- Romania Agronomic Amino Acids Key Strategic Recommendations
Frequently Asked Questions About the Market Study (FAQs):
6Wresearch actively monitors the Romania Agronomic Amino Acids Market and publishes its comprehensive annual report, highlighting emerging trends, growth drivers, revenue analysis, and forecast outlook. Our insights help businesses to make data-backed strategic decisions with ongoing market dynamics. Our analysts track relevent industries related to the Romania Agronomic Amino Acids Market, allowing our clients with actionable intelligence and reliable forecasts tailored to emerging regional needs.
Yes, we provide customisation as per your requirements. To learn more, feel free to contact us on sales@6wresearch.com
1 Executive Summary |
2 Introduction |
2.1 Key Highlights of the Report |
2.2 Report Description |
2.3 Market Scope & Segmentation |
2.4 Research Methodology |
2.5 Assumptions |
3 Romania Agronomic Amino Acids Market Overview |
3.1 Romania Country Macro Economic Indicators |
3.2 Romania Agronomic Amino Acids Market Revenues & Volume, 2022 & 2032F |
3.3 Romania Agronomic Amino Acids Market - Industry Life Cycle |
3.4 Romania Agronomic Amino Acids Market - Porter's Five Forces |
3.5 Romania Agronomic Amino Acids Market Revenues & Volume Share, By Type, 2022 & 2032F |
3.6 Romania Agronomic Amino Acids Market Revenues & Volume Share, By Source, 2022 & 2032F |
3.7 Romania Agronomic Amino Acids Market Revenues & Volume Share, By Application, 2022 & 2032F |
4 Romania Agronomic Amino Acids Market Dynamics |
4.1 Impact Analysis |
4.2 Market Drivers |
4.2.1 Increasing awareness about the benefits of using agronomic amino acids in crop production |
4.2.2 Growing demand for organic farming practices in Romania |
4.2.3 Government initiatives promoting the use of sustainable agricultural inputs |
4.3 Market Restraints |
4.3.1 Limited availability of high-quality agronomic amino acid products in the market |
4.3.2 High initial costs associated with adopting agronomic amino acids in farming practices |
4.3.3 Lack of standardized regulations for the use of amino acids in agriculture |
5 Romania Agronomic Amino Acids Market Trends |
6 Romania Agronomic Amino Acids Market, By Types |
6.1 Romania Agronomic Amino Acids Market, By Type |
6.1.1 Overview and Analysis |
6.1.2 Romania Agronomic Amino Acids Market Revenues & Volume, By Type, 2022-2032F |
6.1.3 Romania Agronomic Amino Acids Market Revenues & Volume, By Lysine, 2022-2032F |
6.1.4 Romania Agronomic Amino Acids Market Revenues & Volume, By Thymine, 2022-2032F |
6.1.5 Romania Agronomic Amino Acids Market Revenues & Volume, By Methionine, 2022-2032F |
6.1.6 Romania Agronomic Amino Acids Market Revenues & Volume, By Glutamic Acid, 2022-2032F |
6.1.7 Romania Agronomic Amino Acids Market Revenues & Volume, By Alanine, 2022-2032F |
6.1.8 Romania Agronomic Amino Acids Market Revenues & Volume, By Leucine, 2022-2032F |
6.1.9 Romania Agronomic Amino Acids Market Revenues & Volume, By Others, 2022-2032F |
6.1.10 Romania Agronomic Amino Acids Market Revenues & Volume, By Others, 2022-2032F |
6.2 Romania Agronomic Amino Acids Market, By Source |
6.2.1 Overview and Analysis |
6.2.2 Romania Agronomic Amino Acids Market Revenues & Volume, By Plant-based, 2022-2032F |
6.2.3 Romania Agronomic Amino Acids Market Revenues & Volume, By Animal-based, 2022-2032F |
6.2.4 Romania Agronomic Amino Acids Market Revenues & Volume, By Synthetic, 2022-2032F |
6.2.5 Romania Agronomic Amino Acids Market Revenues & Volume, By Treatment Method, 2022-2032F |
6.2.6 Romania Agronomic Amino Acids Market Revenues & Volume, By Foliar, 2022-2032F |
6.2.7 Romania Agronomic Amino Acids Market Revenues & Volume, By Seed, 2022-2032F |
6.2.8 Romania Agronomic Amino Acids Market Revenues & Volume, By Others, 2022-2032F |
6.2.9 Romania Agronomic Amino Acids Market Revenues & Volume, By Others, 2022-2032F |
6.3 Romania Agronomic Amino Acids Market, By Application |
6.3.1 Overview and Analysis |
6.3.2 Romania Agronomic Amino Acids Market Revenues & Volume, By Soil Amendment, 2022-2032F |
6.3.3 Romania Agronomic Amino Acids Market Revenues & Volume, By Chlorophyll Synthesis, 2022-2032F |
6.3.4 Romania Agronomic Amino Acids Market Revenues & Volume, By Roots Development, 2022-2032F |
6.3.5 Romania Agronomic Amino Acids Market Revenues & Volume, By Bud Growth and Leaves Development, 2022-2032F |
6.3.6 Romania Agronomic Amino Acids Market Revenues & Volume, By Crop Resistance, 2022-2032F |
6.3.7 Romania Agronomic Amino Acids Market Revenues & Volume, By Ripening, 2022-2032F |
7 Romania Agronomic Amino Acids Market Import-Export Trade Statistics |
7.1 Romania Agronomic Amino Acids Market Export to Major Countries |
7.2 Romania Agronomic Amino Acids Market Imports from Major Countries |
8 Romania Agronomic Amino Acids Market Key Performance Indicators |
8.1 Soil health improvement index |
8.2 Crop yield per hectare |
8.3 Farmer adoption rate of agronomic amino acids |
9 Romania Agronomic Amino Acids Market - Opportunity Assessment |
9.1 Romania Agronomic Amino Acids Market Opportunity Assessment, By Type, 2022 & 2032F |
9.2 Romania Agronomic Amino Acids Market Opportunity Assessment, By Source, 2022 & 2032F |
9.3 Romania Agronomic Amino Acids Market Opportunity Assessment, By Application, 2022 & 2032F |
10 Romania Agronomic Amino Acids Market - Competitive Landscape |
10.1 Romania Agronomic Amino Acids Market Revenue Share, By Companies, 2025 |
10.2 Romania Agronomic Amino Acids Market Competitive Benchmarking, By Operating and Technical Parameters |
11 Company Profiles |
12 Recommendations |
13 Disclaimer |
Export potential assessment - trade Analytics for 2030
Export potential enables firms to identify high-growth global markets with greater confidence by combining advanced trade intelligence with a structured quantitative methodology. The framework analyzes emerging demand trends and country-level import patterns while integrating macroeconomic and trade datasets such as GDP and population forecasts, bilateral import–export flows, tariff structures, elasticity differentials between developed and developing economies, geographic distance, and import demand projections. Using weighted trade values from 2020–2024 as the base period to project country-to-country export potential for 2030, these inputs are operationalized through calculated drivers such as gravity model parameters, tariff impact factors, and projected GDP per-capita growth. Through an analysis of hidden potentials, demand hotspots, and market conditions that are most favorable to success, this method enables firms to focus on target countries, maximize returns, and global expansion with data, backed by accuracy.
By factoring in the projected importer demand gap that is currently unmet and could be potential opportunity, it identifies the potential for the Exporter (Country) among 190 countries, against the general trade analysis, which identifies the biggest importer or exporter.
To discover high-growth global markets and optimize your business strategy:
Click Here
Pricing
- Single User License$ 1,995
- Department License$ 2,400
- Site License$ 3,120
- Global License$ 3,795

Search
Thought Leadership and Analyst Meet


Our Clients
Latest Reports
- Canada Cloud CFD Market (2026-2032) | Size & Revenue, Industry, Growth, Competitive Landscape, Forecast, Segmentation, Value, Outlook, Trends, Share, Analysis, Companies
- Taiwan Food Delivery Platform Market (2026-2032) | Companies, Outlook, Analysis, Trends, Value, Revenue, Segmentation, Share, Forecast, Competitive Landscape, Growth, Size & Forecast
- United Kingdom (UK) Long-term Care Insurance Market (2026-2032) | Growth, Share, Consumer Insights, Drivers, Opportunities, Competition, Pricing Analysis, Segments, Restraints, Companies, Competitive, Value, Outlook, Size, Demand, Analysis, Challenges, Strategic Insights, Investment Trends, Revenue, Trends, Supply, Forecast
- United Kingdom (UK) Long Term Care Market (2026-2032) | Companies, Outlook, Analysis, Trends, Value, Revenue, Segmentation, Share, Forecast, Competitive Landscape, Growth, Size & Forecast
- Iraq Insulation and Waterproofing Market (2026-2032) | Outlook, Drivers, Growth, Size, Share, Industry, Revenue, Trends, Demand, Competitive, Strategic Insights, Opportunities, Segments, Companies, Challenges, Strategy, Consumer Insights, Analysis, Investment Trends, Value, Segmentation, Forecast, Restraints
- India Switchgear Market Outlook (2026-2032) | Size, Share, Trends, Growth, Revenue, Forecast, Analysis, Value, Outlook
- Pakistan Contraceptive Implants Market (2025-2031) | Demand, Growth, Size, Share, Industry, Pricing Analysis, Competitive, Strategic Insights, Strategy, Consumer Insights, Analysis, Investment Trends, Opportunities, Revenue, Segments, Value, Segmentation, Supply, Forecast, Restraints, Outlook, Competition, Drivers, Trends, Companies, Challenges
- Sri Lanka Packaging Market (2026-2032) | Outlook, Competition, Drivers, Trends, Demand, Pricing Analysis, Competitive, Strategic Insights, Companies, Challenges, Strategy, Consumer Insights, Analysis, Investment Trends, Opportunities, Growth, Size, Share, Industry, Revenue, Segments, Value, Segmentation, Supply, Forecast, Restraints
- India Kids Watches Market (2026-2032) | Strategy, Consumer Insights, Analysis, Investment Trends, Opportunities, Growth, Size, Share, Industry, Revenue, Segments, Value, Segmentation, Supply, Forecast, Restraints, Outlook, Competition, Drivers, Trends, Demand, Pricing Analysis, Competitive, Strategic Insights, Companies, Challenges
- Saudi Arabia Core Assurance Service Market (2025-2031) | Strategy, Consumer Insights, Analysis, Investment Trends, Opportunities, Growth, Size, Share, Industry, Revenue, Segments, Value, Segmentation, Supply, Forecast, Restraints, Outlook, Competition, Drivers, Trends, Demand, Pricing Analysis, Competitive, Strategic Insights, Companies, Challenges
Industry Events and Analyst Meet

India EV Show 2026

EV tech India Expo 2026

Auto Tech Asia 2026

Battery Tech India 2026

Smart Production Solutions Guangzhou 2026
Whitepaper
- Middle East & Africa Commercial Security Market Click here to view more.
- Middle East & Africa Fire Safety Systems & Equipment Market Click here to view more.
- GCC Drone Market Click here to view more.
- Middle East Lighting Fixture Market Click here to view more.
- GCC Physical & Perimeter Security Market Click here to view more.
6WResearch In News
- Doha a strategic location for EV manufacturing hub: IPA Qatar
- Demand for luxury TVs surging in the GCC, says Samsung
- Empowering Growth: The Thriving Journey of Bangladesh’s Cable Industry
- Demand for luxury TVs surging in the GCC, says Samsung
- Video call with a traditional healer? Once unthinkable, it’s now common in South Africa
- Intelligent Buildings To Smooth GCC’s Path To Net Zero