Saudi Arabia CNG Dispenser Market (2026-2032) Outlook | Industry, Trends, Growth, Value, Companies, Size, Revenue, Forecast, Analysis & Share
Market Forecast By Type (Fast Fill , Time Fill), By Flow Rate (Up to 15, Up to 50, Up to 100 Kg/Min), By Distribution (Company Owned & Company Run, Company Owned & Dealer Run, Dealer Owned & Dealer Run) And Competitive Landscape
| Product Code: ETC4528780 | Publication Date: Jul 2023 | Updated Date: Mar 2026 | Product Type: Report | |
| Publisher: 6Wresearch | Author: Ravi Bhandari | No. of Pages: 85 | No. of Figures: 45 | No. of Tables: 25 |
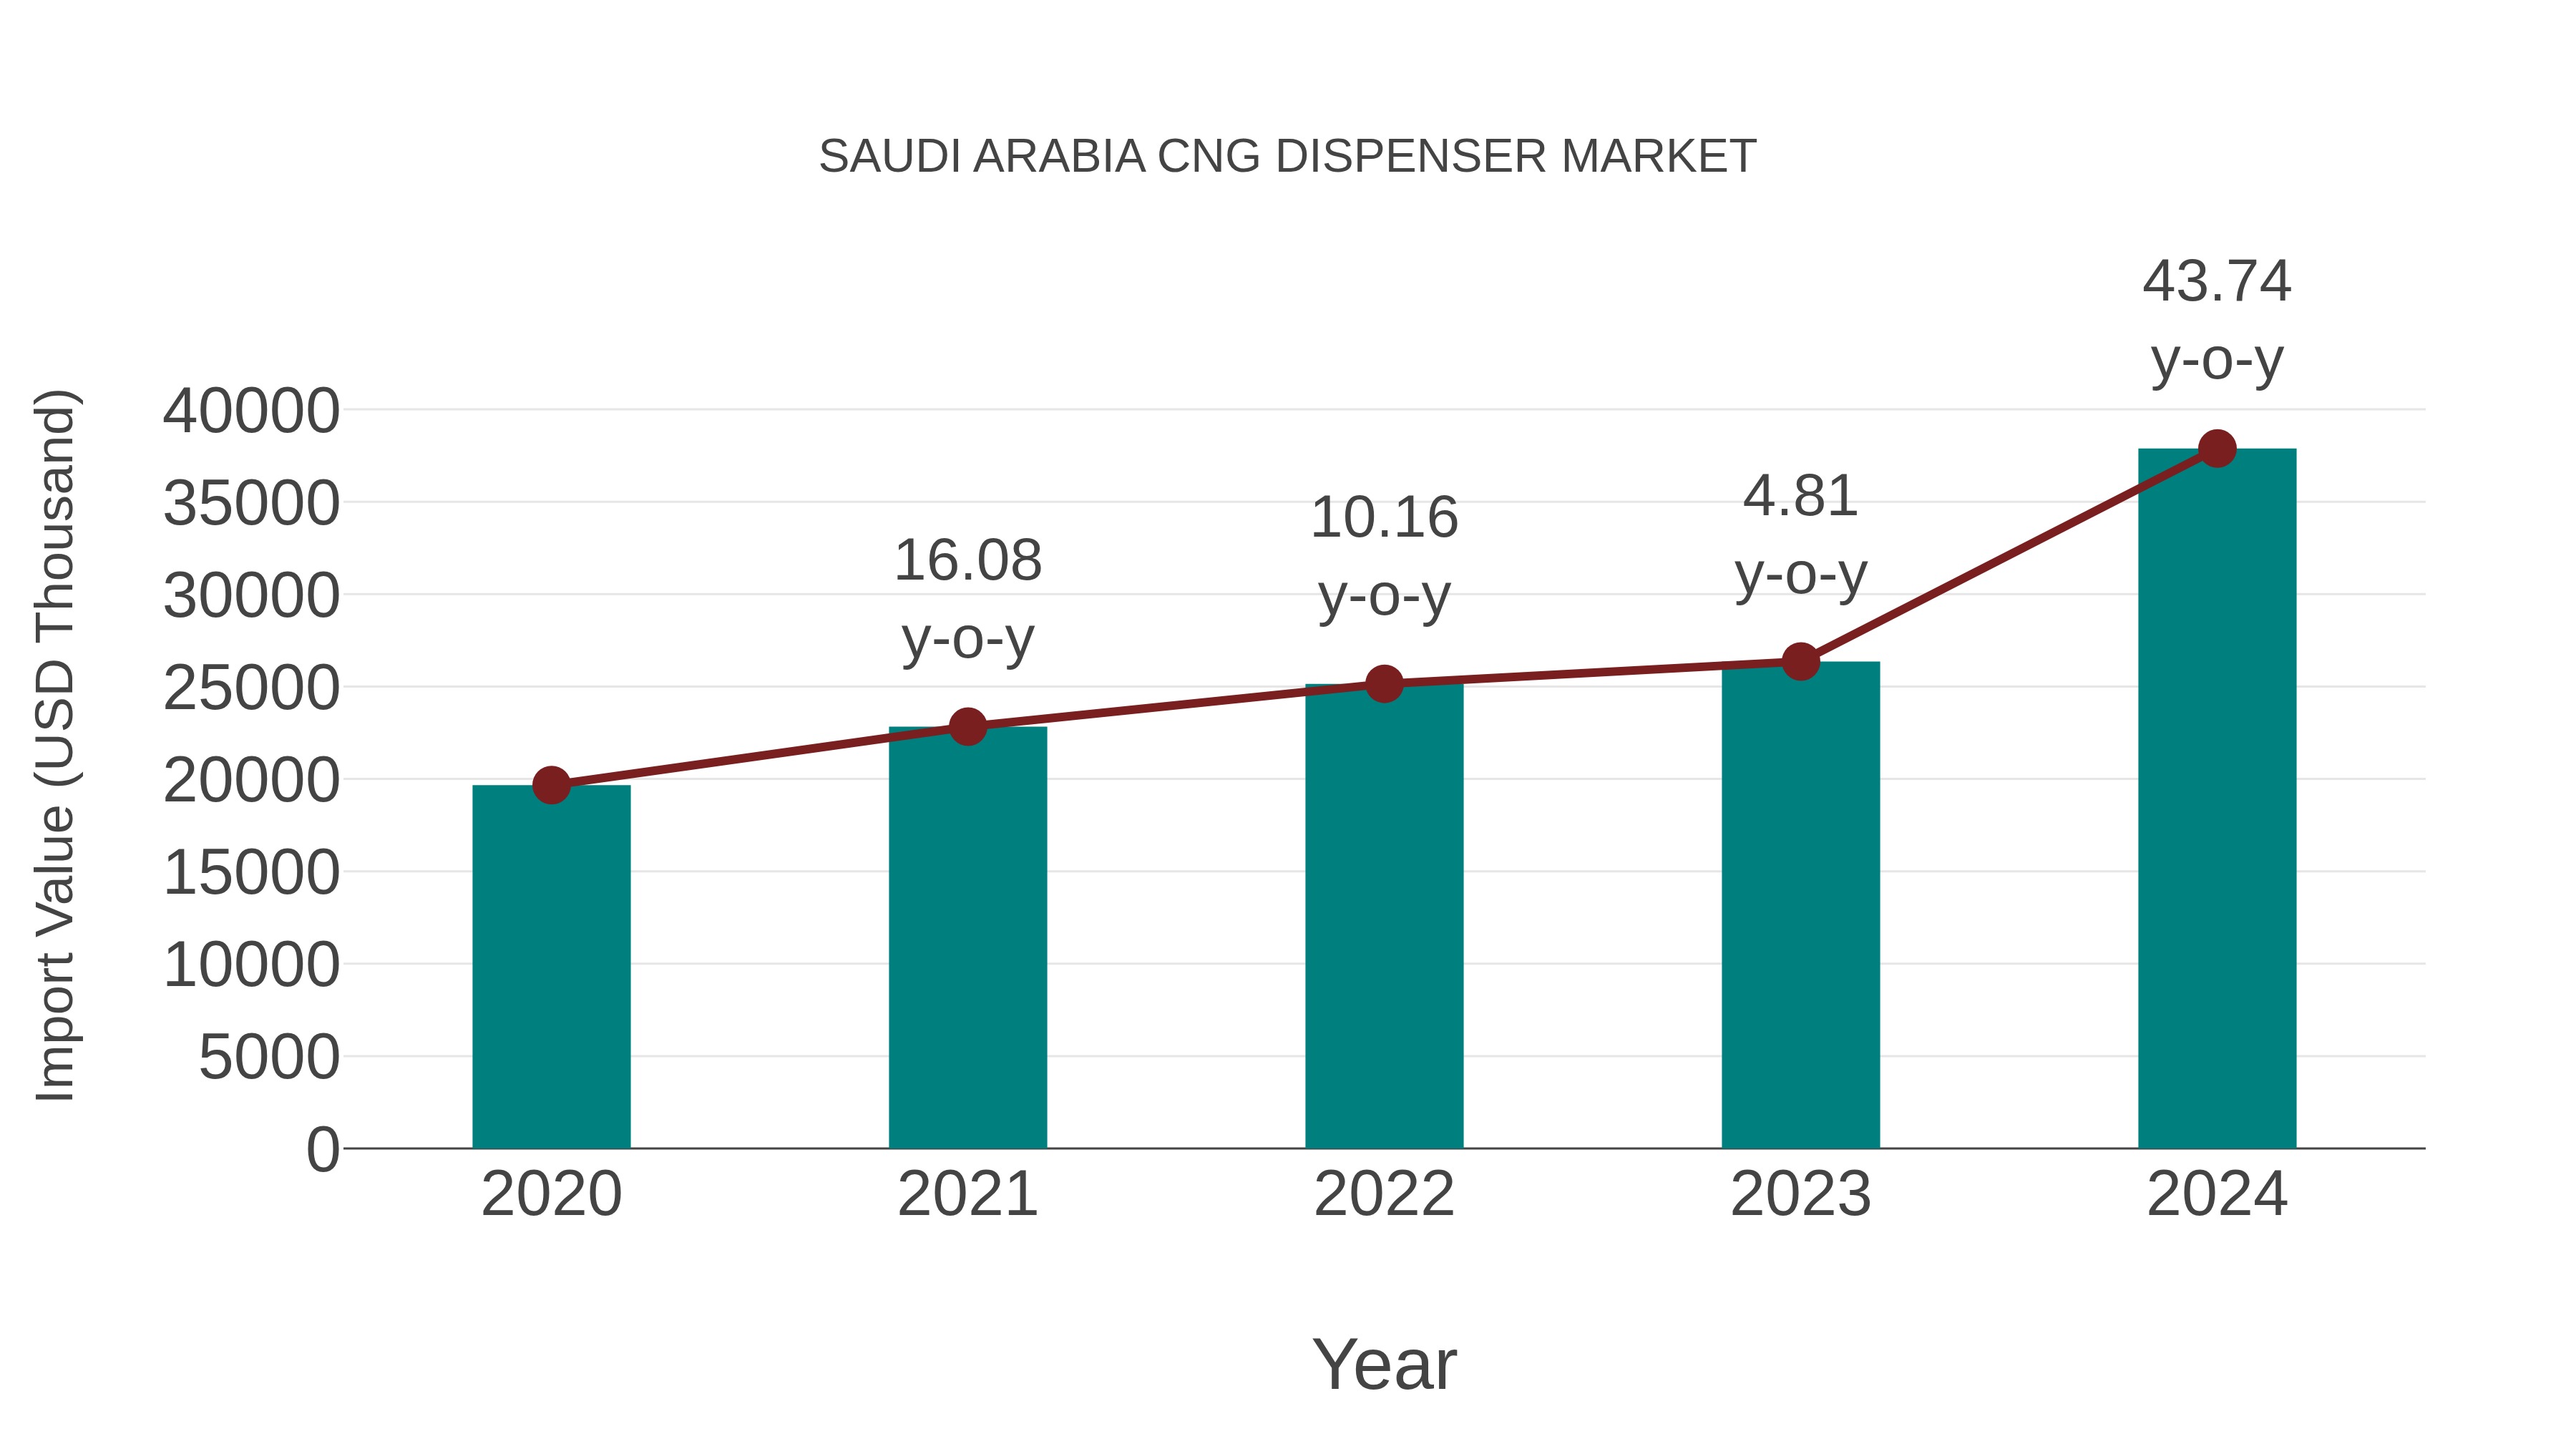
Saudi Arabia Cng Dispenser Market: Import Trend Analysis
Saudi Arabia`s import trend for CNG dispensers in the Saudi Arabian market exhibited significant growth from 2023 to 2024, with a growth rate of 43.74%. The compound annual growth rate (CAGR) from 2020 to 2024 stood at 17.81%. This surge in imports can be attributed to the increasing shift towards cleaner energy sources and the government`s initiatives to promote the use of compressed natural gas as a more sustainable fuel option.
Saudi Arabia Cng Dispenser Market Overview
Compressed Natural Gas (CNG) dispensers are crucial for refueling CNG-powered vehicles. In Saudi Arabia, this market pertains to the manufacturing and deployment of CNG dispensers, supporting the country`s efforts to reduce its carbon footprint and promote cleaner transportation.
Drivers of the Market
The CNG dispenser market is thriving as Saudi Arabia places a greater emphasis on clean energy and reduced carbon emissions. With a growing interest in Compressed Natural Gas (CNG) as a more environmentally friendly alternative to traditional fuels, the demand for CNG dispensers is on the rise, driven by government initiatives to promote the use of CNG in vehicles and transportation.
Challenges of the Market
The CNG (Compressed Natural Gas) dispenser market in Saudi Arabia faces challenges concerning the safe and efficient dispensing of CNG, addressing safety standards and regulatory compliance, and ensuring the reliability of CNG dispensers.
COVID-19 Impact on the Market
The CNG Dispenser market in Saudi Arabia, essential for compressed natural gas refueling, faced temporary disruptions during the pandemic. Supply chain challenges impacted manufacturing and deployment. However, as the demand for cleaner energy sources grows, the market is showing signs of revival.
Key Players in the Market
Key companies in the Saudi Arabia CNG (Compressed Natural Gas) dispenser market include Bennett Pump Company, Gilbarco Veeder-Root, and Fortive Corporation, supplying CNG dispensers for fueling stations.
Key Highlights of the Report:
- Saudi Arabia CNG Dispenser Market Outlook
- Market Size of Saudi Arabia CNG Dispenser Market, 2025
- Forecast of Saudi Arabia CNG Dispenser Market, 2032
- Historical Data and Forecast of Saudi Arabia CNG Dispenser Revenues & Volume for the Period 2022-2032F
- Saudi Arabia CNG Dispenser Market Trend Evolution
- Saudi Arabia CNG Dispenser Market Drivers and Challenges
- Saudi Arabia CNG Dispenser Price Trends
- Saudi Arabia CNG Dispenser Porter's Five Forces
- Saudi Arabia CNG Dispenser Industry Life Cycle
- Historical Data and Forecast of Saudi Arabia CNG Dispenser Market Revenues & Volume By Type for the Period 2022-2032F
- Historical Data and Forecast of Saudi Arabia CNG Dispenser Market Revenues & Volume By Fast Fill for the Period 2022-2032F
- Historical Data and Forecast of Saudi Arabia CNG Dispenser Market Revenues & Volume By Time Fill for the Period 2022-2032F
- Historical Data and Forecast of Saudi Arabia CNG Dispenser Market Revenues & Volume By Flow Rate for the Period 2022-2032F
- Historical Data and Forecast of Saudi Arabia CNG Dispenser Market Revenues & Volume By Up to 15 for the Period 2022-2032F
- Historical Data and Forecast of Saudi Arabia CNG Dispenser Market Revenues & Volume By Up to 50 for the Period 2022-2032F
- Historical Data and Forecast of Saudi Arabia CNG Dispenser Market Revenues & Volume By Up to 100 Kg/Min for the Period 2022-2032F
- Historical Data and Forecast of Saudi Arabia CNG Dispenser Market Revenues & Volume By Distribution for the Period 2022-2032F
- Historical Data and Forecast of Saudi Arabia CNG Dispenser Market Revenues & Volume By Company Owned & Company Run for the Period 2022-2032F
- Historical Data and Forecast of Saudi Arabia CNG Dispenser Market Revenues & Volume By Company Owned & Dealer Run for the Period 2022-2032F
- Historical Data and Forecast of Saudi Arabia CNG Dispenser Market Revenues & Volume By Dealer Owned & Dealer Run for the Period 2022-2032F
- Saudi Arabia CNG Dispenser Import Export Trade Statistics
- Market Opportunity Assessment By Type
- Market Opportunity Assessment By Flow Rate
- Market Opportunity Assessment By Distribution
- Saudi Arabia CNG Dispenser Top Companies Market Share
- Saudi Arabia CNG Dispenser Competitive Benchmarking By Technical and Operational Parameters
- Saudi Arabia CNG Dispenser Company Profiles
- Saudi Arabia CNG Dispenser Key Strategic Recommendations
Saudi Arabia CNG Dispenser Market (2026-2032): FAQs
6Wresearch actively monitors the Saudi Arabia CNG Dispenser Market and publishes its comprehensive annual report, highlighting emerging trends, growth drivers, revenue analysis, and forecast outlook. Our insights help businesses to make data-backed strategic decisions with ongoing market dynamics. Our analysts track relevent industries related to the Saudi Arabia CNG Dispenser Market, allowing our clients with actionable intelligence and reliable forecasts tailored to emerging regional needs.
Yes, we provide customisation as per your requirements. To learn more, feel free to contact us on sales@6wresearch.com
1 Executive Summary |
2 Introduction |
2.1 Key Highlights of the Report |
2.2 Report Description |
2.3 Market Scope & Segmentation |
2.4 Research Methodology |
2.5 Assumptions |
3 Saudi Arabia CNG Dispenser Market Overview |
3.1 Saudi Arabia Country Macro Economic Indicators |
3.2 Saudi Arabia CNG Dispenser Market Revenues & Volume, 2022 & 2032F |
3.3 Saudi Arabia CNG Dispenser Market - Industry Life Cycle |
3.4 Saudi Arabia CNG Dispenser Market - Porter's Five Forces |
3.5 Saudi Arabia CNG Dispenser Market Revenues & Volume Share, By Type, 2022 & 2032F |
3.6 Saudi Arabia CNG Dispenser Market Revenues & Volume Share, By Flow Rate, 2022 & 2032F |
3.7 Saudi Arabia CNG Dispenser Market Revenues & Volume Share, By Distribution, 2022 & 2032F |
4 Saudi Arabia CNG Dispenser Market Dynamics |
4.1 Impact Analysis |
4.2 Market Drivers |
4.2.1 Increasing government initiatives to promote the use of CNG as a cleaner fuel alternative in Saudi Arabia |
4.2.2 Growth in the transportation sector leading to higher demand for CNG dispensers |
4.2.3 Rising awareness about environmental sustainability and the benefits of using CNG over traditional fuels |
4.3 Market Restraints |
4.3.1 High initial investment costs associated with setting up CNG dispensing stations |
4.3.2 Limited infrastructure for CNG distribution and dispensing in certain regions of Saudi Arabia |
5 Saudi Arabia CNG Dispenser Market Trends |
6 Saudi Arabia CNG Dispenser Market, By Types |
6.1 Saudi Arabia CNG Dispenser Market, By Type |
6.1.1 Overview and Analysis |
6.1.2 Saudi Arabia CNG Dispenser Market Revenues & Volume, By Type, 2022-2032F |
6.1.3 Saudi Arabia CNG Dispenser Market Revenues & Volume, By Fast Fill , 2022-2032F |
6.1.4 Saudi Arabia CNG Dispenser Market Revenues & Volume, By Time Fill, 2022-2032F |
6.2 Saudi Arabia CNG Dispenser Market, By Flow Rate |
6.2.1 Overview and Analysis |
6.2.2 Saudi Arabia CNG Dispenser Market Revenues & Volume, By Up to 15, 2022-2032F |
6.2.3 Saudi Arabia CNG Dispenser Market Revenues & Volume, By Up to 50, 2022-2032F |
6.2.4 Saudi Arabia CNG Dispenser Market Revenues & Volume, By Up to 100 Kg/Min, 2022-2032F |
6.3 Saudi Arabia CNG Dispenser Market, By Distribution |
6.3.1 Overview and Analysis |
6.3.2 Saudi Arabia CNG Dispenser Market Revenues & Volume, By Company Owned & Company Run, 2022-2032F |
6.3.3 Saudi Arabia CNG Dispenser Market Revenues & Volume, By Company Owned & Dealer Run, 2022-2032F |
6.3.4 Saudi Arabia CNG Dispenser Market Revenues & Volume, By Dealer Owned & Dealer Run, 2022-2032F |
7 Saudi Arabia CNG Dispenser Market Import-Export Trade Statistics |
7.1 Saudi Arabia CNG Dispenser Market Export to Major Countries |
7.2 Saudi Arabia CNG Dispenser Market Imports from Major Countries |
8 Saudi Arabia CNG Dispenser Market Key Performance Indicators |
8.1 Number of new CNG dispensing stations installed |
8.2 Average utilization rate of existing CNG dispensers |
8.3 Growth in the number of vehicles converted to CNG |
8.4 Adoption rate of CNG technology in the transportation sector |
8.5 Investment in research and development for improved CNG dispenser technology |
9 Saudi Arabia CNG Dispenser Market - Opportunity Assessment |
9.1 Saudi Arabia CNG Dispenser Market Opportunity Assessment, By Type, 2022 & 2032F |
9.2 Saudi Arabia CNG Dispenser Market Opportunity Assessment, By Flow Rate, 2022 & 2032F |
9.3 Saudi Arabia CNG Dispenser Market Opportunity Assessment, By Distribution, 2022 & 2032F |
10 Saudi Arabia CNG Dispenser Market - Competitive Landscape |
10.1 Saudi Arabia CNG Dispenser Market Revenue Share, By Companies, 2025 |
10.2 Saudi Arabia CNG Dispenser Market Competitive Benchmarking, By Operating and Technical Parameters |
11 Company Profiles |
12 Recommendations |
13 Disclaimer |
Global Go To Market Strategy - 2030
Export potential enables firms to identify high-growth global markets with greater confidence by combining advanced trade intelligence with a structured quantitative methodology. The framework analyzes emerging demand trends and country-level import patterns while integrating macroeconomic and trade datasets such as GDP and population forecasts, bilateral import–export flows, tariff structures, elasticity differentials between developed and developing economies, geographic distance, and import demand projections. Using weighted trade values from 2020–2024 as the base period to project country-to-country export potential for 2030, these inputs are operationalized through calculated drivers such as gravity model parameters, tariff impact factors, and projected GDP per-capita growth. Through an analysis of hidden potentials, demand hotspots, and market conditions that are most favorable to success, this method enables firms to focus on target countries, maximize returns, and global expansion with data, backed by accuracy.
By factoring in the projected importer demand gap that is currently unmet and could be potential opportunity, it identifies the potential for the Exporter (Country) among 190 countries, against the general trade analysis, which identifies the biggest importer or exporter.
To discover high-growth global markets and optimize your business strategy:
Click Here
Pricing
- Single User License$ 1,995
- Department License$ 2,400
- Site License$ 3,120
- Global License$ 3,795

Leadership Perspectives from Industry Events
Search
Thought Leadership and Analyst Meet


Our Clients
6WResearch In News
- Doha a strategic location for EV manufacturing hub: IPA Qatar
- Demand for luxury TVs surging in the GCC, says Samsung
- Empowering Growth: The Thriving Journey of Bangladesh’s Cable Industry
- Demand for luxury TVs surging in the GCC, says Samsung
- Video call with a traditional healer? Once unthinkable, it’s now common in South Africa
- Intelligent Buildings To Smooth GCC’s Path To Net Zero
Latest Reports
- Taiwan Airport Wireless Infrastructure Market (2026-2032)
- Vietnam Airport Wireless Infrastructure Market (2026-2032)
- Thailand Airport Wireless Infrastructure Market (2026-2032)
- South Korea Airport Wireless Infrastructure Market (2026-2032)
- Romania Airport Wireless Infrastructure Market (2026-2032)
- Qatar Airport Wireless Infrastructure Market (2026-2032)
- Philippines Airport Wireless Infrastructure Market (2026-2032)
- Japan Airport Wireless Infrastructure Market (2026-2032)
- Taiwan Airport Winter Services Market (2026-2032)
- Vietnam Airport Winter Services Market (2026-2032)
Industry Events and Analyst Meet

HIMTEX 2026

India Refining Summit 2026

India EV Show 2026

EV tech India Expo 2026

Auto Tech Asia 2026
Whitepaper
- Middle East & Africa Commercial Security Market Click here to view more.
- Middle East & Africa Fire Safety Systems & Equipment Market Click here to view more.
- GCC Drone Market Click here to view more.
- Middle East Lighting Fixture Market Click here to view more.
- GCC Physical & Perimeter Security Market Click here to view more.