Saudi Arabia Energy Saving & Fluorescent Market (2026-2032) | Growth, Value, Trends, Companies, Revenue, Size, Industry, Forecast, Share, Outlook & Analysis
Market Forecast By Sources (High-Intensity Discharge Lamps (HID), Linear Fluorescent Lamps (LFL), Light Emitting Diodes (LED)), By Applications (Commercial, Residential, Government) And Competitive Landscape
| Product Code: ETC005099 | Publication Date: Jul 2023 | Updated Date: Jun 2026 | Product Type: Report | |
| Publisher: 6Wresearch | Author: Ravi Bhandari | No. of Pages: 70 | No. of Figures: 35 | No. of Tables: 5 |
Saudi Arabia Energy Saving & Fluorescent Market Summary
The saudi arabia energy saving & fluorescent market was estimated at USD 189 Million in 2025 and is projected to reach USD 242 Million by 2032, growing at a CAGR of 5.1% from 2026 to 2032.
Saudi Arabia Energy Saving & Fluorescent Market Growth Rate Analysis (2021-2032)
The energy-saving and fluorescent market in Saudi Arabia has seen notable fluctuations over recent years, with a decrease of 2.3% in 2021 largely due to supply chain disruptions and global economic uncertainties. However, a strong recovery began in 2022, marked by a growth of 6.2%, propelled by increasing consumer demand for energy-efficient solutions and government initiatives aimed at energy transition. This growth accelerated further in 2023, achieving 10.7%, driven by advancements in technology and heightened investment in sustainable infrastructure. Projections for the following years indicate sustained progress, with expected growth rates around 4% to 5% through 2032, reflecting ongoing economic diversification and a commitment to reducing carbon emissions.
Saudi Arabia Energy Saving & Fluorescent Market Year-wise Growth Rate and Key Drivers
This graph highlights how the Saudi Arabia Energy Saving & Fluorescent Market has steadily grown over the past five years, supported by major growth factors.
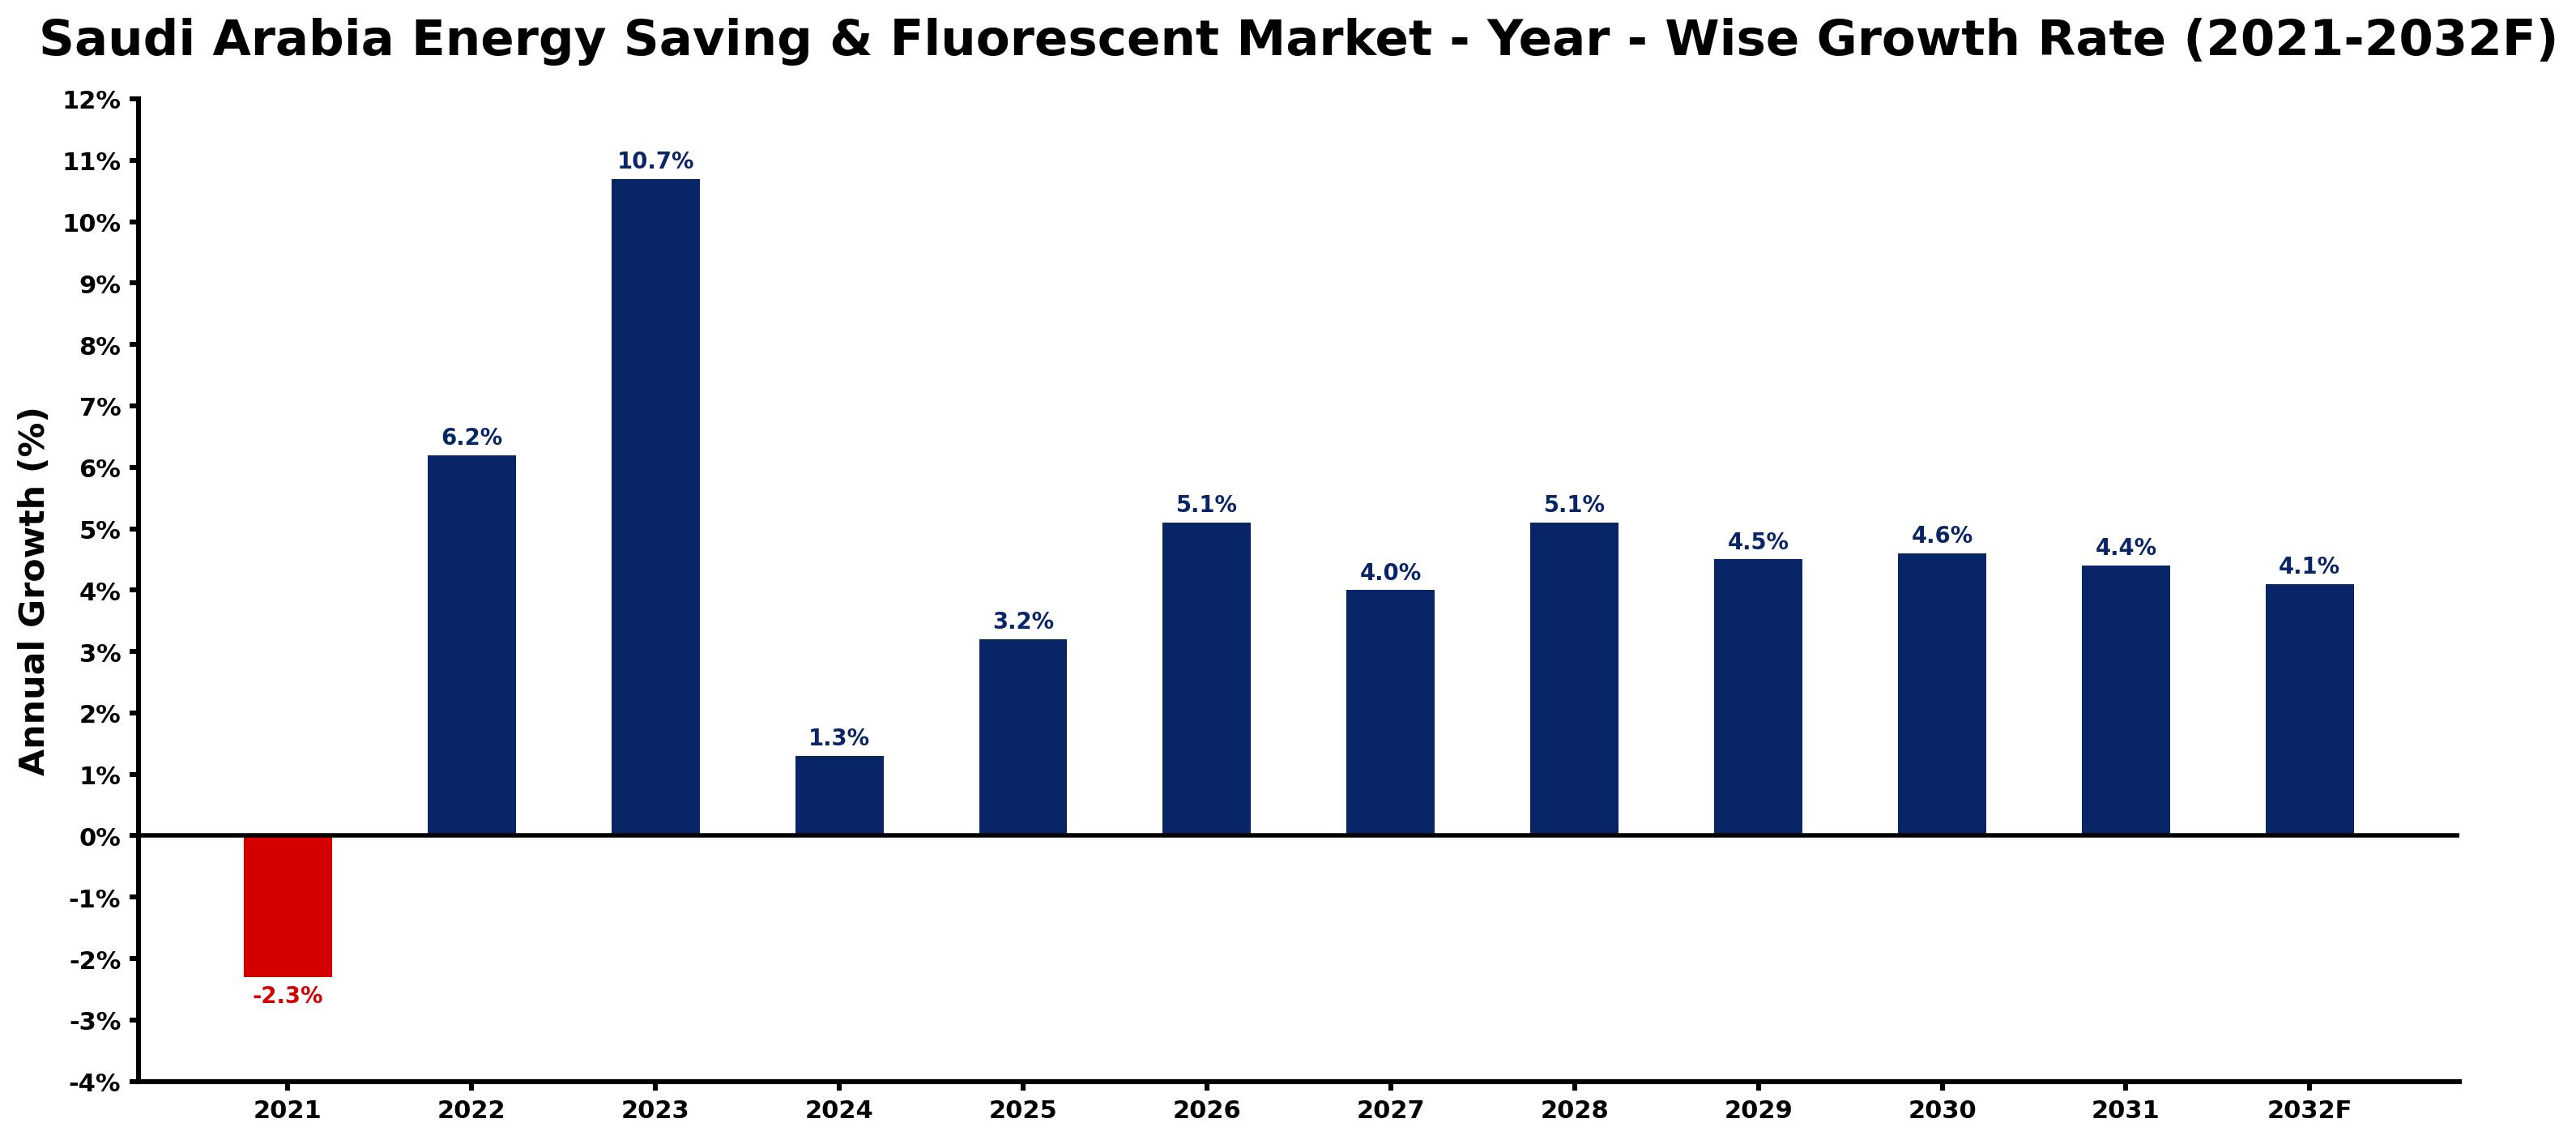
The table below presents the year wise growth rates along with the key drivers influencing the market
| Year | Growth Rate | Major Drivers |
| 2021 | -2.3% | A surge in competition from cheaper imported lighting solutions diminished local market share and sales. |
| 2022 | 6.2% | Increased awareness of energy consumption impacts on household budgets influenced buying behavior. |
| 2023 | 10.7% | Localization efforts promote competitive pricing for energy-saving technologies across the region. |
| 2024 | 1.3% | Integration of smart building technologies enhances demand for advanced fluorescent lighting solutions. |
| 2025 | 3.2% | New urban developments push for energy-efficient designs in line with Vision 2030 goals. |
| 2026 | 5.1% | Collaborations between local manufacturers and international brands strengthen market presence significantly. |
| 2027 | 4.0% | Shifts in consumer preferences favor eco-friendly products, spurring growth in energy-saving options. |
| 2028 | 5.1% | Expansion of renewable energy initiatives highlights the need for efficient lighting solutions. |
| 2029 | 4.5% | Corporate sustainability commitments challenge firms to adopt energy-efficient technologies rapidly. |
| 2030 | 4.6% | Growing urbanization necessitates innovative lighting solutions for smart city infrastructures. |
| 2031 | 4.4% | Emerging competition fosters innovation within the fluorescent market, enhancing product offerings. |
| 2032 | 4.1% | Rising standards for energy efficiency reshape consumer expectations and industry benchmarks. |
Note - Market size estimations and growth projections presented in this report are based on 6Wresearch's advanced forecasting approach, validated with industry datasets as of June 2026.
Saudi Arabia Energy Saving & Fluorescent Market Synopsis
The Saudi Arabia Energy Saving Fluorescent Market is projected to reach 5.1% and witness significant growth during the forecast period (2026-2032). The compound annual growth rate (CAGR) is anticipated at 4.8%, driven by a combination of factors that underscore the country's commitment to energy efficiency and sustainable development. Key drivers include a robust demand for high-efficiency lighting solutions, increasing awareness about the benefits of energy-saving technologies, and proactive government initiatives supporting the integration of such products into the market.
Saudi Arabia Energy Saving & Fluorescent Market Growth Drivers
The growth of the Saudi Arabia Energy Saving & Fluorescent Market can be attributed to several intertwined factors:
- The rising demand for high-efficiency lighting products stems from their superior performance compared to traditional options. These products not only provide high-quality illumination but also translate into significant cost savings over time, encouraging broader adoption across various sectors.
- Consumer awareness regarding energy conservation is growing, driven by a greater emphasis on environmental sustainability. This shift in perception is enhanced by stringent government regulations that promote the use of energy-efficient lighting solutions.
- The push for smart city development in Saudi Arabia is generating substantial investment in infrastructure that supports the deployment of modern lighting solutions. This initiative is aligned with technological advancements that further improve energy efficiency.
- Favorable government policies and incentives for energy-efficient technologies are paving the way for increased market penetration of fluorescent and LED lighting options, which are becoming viable alternatives to conventional lighting systems.
- Technological advancements in lighting systems, including the development of smart lighting solutions, are creating new opportunities for market expansion. These innovations not only enhance operational efficiency but also improve user experience through advanced controls.
Saudi Arabia Energy Saving & Fluorescent Market Challenges and Restraints
Despite the positive growth outlook, the Saudi Arabia Energy Saving & Fluorescent Market faces specific challenges that may impede progress:
- The prevalence of low-quality and counterfeit products in the market can undermine consumer confidence. These inferior products, often cheaper, may result in substandard lighting performance and pose safety risks, leading to potential backlash against energy-efficient solutions.
- Economic fluctuations, particularly stemming from global oil price instability, can impact consumer spending power and investment in energy-efficient technologies, potentially slowing down market growth.
- The ongoing effects of the COVID-19 pandemic have disrupted supply chains and manufacturing capabilities, leading to delays in product availability and impacting overall market dynamics.
- Regulatory compliance can be challenging for manufacturers as they must adhere to an evolving set of standards and certifications related to energy efficiency, which can lead to increased operational costs.
- Consumer preferences may shift occasionally, creating uncertainty in demand forecasting for energy-saving products, thus complicating strategic planning for manufacturers.
Saudi Arabia Energy Saving & Fluorescent Market Government Investment and Initiatives
The Saudi government has demonstrated a strong commitment to promoting energy efficiency within the economy. Various initiatives include:
- Implementation of national energy efficiency programs aimed at reducing overall electricity consumption across residential, commercial, and industrial sectors.
- Investment in research and development to foster innovation in sustainable technologies, including lighting solutions, which are essential for achieving energy conservation goals.
- Introduction of financial incentives such as subsidies for businesses and households adopting energy-efficient products, thereby stimulating demand for energy-saving lighting options.
- Collaboration with international organizations to leverage global expertise and best practices in energy efficiency, ensuring the effectiveness of domestic initiatives.
- Promotion of awareness campaigns targeting consumers to educate them on the benefits of energy-saving technologies, ultimately fostering a culture of sustainability.
Saudi Arabia Energy Saving & Fluorescent Market Latest Developments (May 2025 - June 2026)
Recent developments in the Saudi Arabia Energy Saving & Fluorescent Market reflect an industry transitioning towards greater efficiency and sustainability. Throughout the period from May 2025 to June 2026, several trends have emerged:
- Heightened investment in smart lighting systems, with an increasing number of projects focusing on integrating advanced controls and automation to enhance energy efficiency.
- A surge in consumer demand for modern, aesthetic lighting designs that also prioritize energy efficiency, leading to new product innovations within the market.
- Growing partnerships between local businesses and technology firms to develop tailored solutions that meet the specific needs of the Saudi market, enhancing competition and innovation.
- Increased regulatory scrutiny on lighting products, with authorities enforcing standards that ensure consumer safety and product performance.
- The introduction of educational programs by various stakeholders aimed at informing consumers about the benefits of energy-efficient lighting, thereby fostering greater market penetration.
Saudi Arabia Energy Saving & Fluorescent Market - Key Attractiveness of the Report
- 10 Years of Market Numbers
- Historical Data Starting from 2022 to 2025
- Base Year: 2025
- Forecast Data until 2032
- Key Performance Indicators Impacting the Market
- Major Upcoming Developments and Projects
Key Highlights of the Report:
- Saudi Arabia Energy Saving & Fluorescent Market Outlook
- Market Size of Saudi Arabia Energy Saving & Fluorescent Market, 2025
- Forecast of Saudi Arabia Energy Saving & Fluorescent Market, 2032
- Historical Data and Forecast of Saudi Arabia Energy Saving & Fluorescent Revenues & Volume for the Period 2022-2032F
- Saudi Arabia Energy Saving & Fluorescent Market Trend Evolution
- Saudi Arabia Energy Saving & Fluorescent Market Drivers and Challenges
- Saudi Arabia Energy Saving & Fluorescent Price Trends
- Saudi Arabia Energy Saving & Fluorescent Porter's Five Forces
- Saudi Arabia Energy Saving & Fluorescent Industry Life Cycle
- Historical Data and Forecast of Saudi Arabia Energy Saving & Fluorescent Market Revenues & Volume By Sources for the Period 2022-2032F
- Historical Data and Forecast of Saudi Arabia Energy Saving & Fluorescent Market Revenues & Volume By High-Intensity Discharge Lamps (HID) for the Period 2022-2032F
- Historical Data and Forecast of Saudi Arabia Energy Saving & Fluorescent Market Revenues & Volume By Linear Fluorescent Lamps (LFL) for the Period 2022-2032F
- Historical Data and Forecast of Saudi Arabia Energy Saving & Fluorescent Market Revenues & Volume By Light Emitting Diodes (LED) for the Period 2022-2032F
- Historical Data and Forecast of Saudi Arabia Energy Saving & Fluorescent Market Revenues & Volume By Applications for the Period 2022-2032F
- Historical Data and Forecast of Saudi Arabia Energy Saving & Fluorescent Market Revenues & Volume By Commercial for the Period 2022-2032F
- Historical Data and Forecast of Saudi Arabia Energy Saving & Fluorescent Market Revenues & Volume By Residential for the Period 2022-2032F
- Historical Data and Forecast of Saudi Arabia Energy Saving & Fluorescent Market Revenues & Volume By Government for the Period 2022-2032F
- Saudi Arabia Energy Saving & Fluorescent Import Export Trade Statistics
- Market Opportunity Assessment By Sources
- Market Opportunity Assessment By Applications
- Saudi Arabia Energy Saving & Fluorescent Top Companies Market Share
- Saudi Arabia Energy Saving & Fluorescent Competitive Benchmarking By Technical and Operational Parameters
- Saudi Arabia Energy Saving & Fluorescent Company Profiles
- Saudi Arabia Energy Saving & Fluorescent Key Strategic Recommendations
Frequently Asked Questions About the Market Study (FAQs):
Growth is driven by increasing demand for high-efficiency lighting, rising consumer awareness of energy conservation, and government initiatives promoting energy-efficient technologies.
Key challenges include the presence of low-quality counterfeit products, potential economic fluctuations, and the impact of the COVID-19 pandemic on supply chains.
The government is investing in national programs aimed at energy conservation, providing financial incentives, and promoting public awareness campaigns to encourage the adoption of energy-efficient products.
Recent trends include investment in smart lighting solutions, consumer demand for aesthetically pleasing energy-efficient products, and partnerships between local businesses and technology firms to innovate within the market.
6Wresearch actively monitors the Saudi Arabia Energy Saving & Fluorescent Market and publishes its comprehensive annual report, highlighting emerging trends, growth drivers, revenue analysis, and forecast outlook. Our insights help businesses to make data-backed strategic decisions with ongoing market dynamics. Our analysts track relevent industries related to the Saudi Arabia Energy Saving & Fluorescent Market, allowing our clients with actionable intelligence and reliable forecasts tailored to emerging regional needs.
Yes, we provide customisation as per your requirements. To learn more, feel free to contact us on sales@6wresearch.com
1 Executive Summary |
2 Introduction |
2.1 Key Highlights of the Report |
2.2 Report Description |
2.3 Market Scope & Segmentation |
2.4 Research Methodology |
2.5 Assumptions |
3 Saudi Arabia Energy Saving & Fluorescent Market Overview |
3.1 Saudi Arabia Country Macro Economic Indicators |
3.2 Saudi Arabia Energy Saving & Fluorescent Market Revenues & Volume, 2022 & 2032F |
3.3 Saudi Arabia Energy Saving & Fluorescent Market - Industry Life Cycle |
3.4 Saudi Arabia Energy Saving & Fluorescent Market - Porter's Five Forces |
3.5 Saudi Arabia Energy Saving & Fluorescent Market Revenues & Volume Share, By Sources, 2022 & 2032F |
3.6 Saudi Arabia Energy Saving & Fluorescent Market Revenues & Volume Share, By Applications, 2022 & 2032F |
4 Saudi Arabia Energy Saving & Fluorescent Market Dynamics |
4.1 Impact Analysis |
4.2 Market Drivers |
4.2.1 Increasing government initiatives and regulations promoting energy efficiency |
4.2.2 Growing awareness among consumers about the benefits of energy-saving products |
4.2.3 Rising electricity prices driving demand for energy-saving solutions |
4.3 Market Restraints |
4.3.1 Initial higher costs associated with energy-saving and fluorescent products |
4.3.2 Limited availability of energy-saving products in the market |
4.3.3 Lack of consumer education on the long-term cost savings of energy-efficient solutions |
5 Saudi Arabia Energy Saving & Fluorescent Market Trends |
6 Saudi Arabia Energy Saving & Fluorescent Market, By Types |
6.1 Saudi Arabia Energy Saving & Fluorescent Market, By Sources |
6.1.1 Overview and Analysis |
6.1.2 Saudi Arabia Energy Saving & Fluorescent Market Revenues & Volume, By Sources, 2022-2032F |
6.1.3 Saudi Arabia Energy Saving & Fluorescent Market Revenues & Volume, By High-Intensity Discharge Lamps (HID), 2022-2032F |
6.1.4 Saudi Arabia Energy Saving & Fluorescent Market Revenues & Volume, By Linear Fluorescent Lamps (LFL), 2022-2032F |
6.1.5 Saudi Arabia Energy Saving & Fluorescent Market Revenues & Volume, By Light Emitting Diodes (LED), 2022-2032F |
6.2 Saudi Arabia Energy Saving & Fluorescent Market, By Applications |
6.2.1 Overview and Analysis |
6.2.2 Saudi Arabia Energy Saving & Fluorescent Market Revenues & Volume, By Commercial, 2022-2032F |
6.2.3 Saudi Arabia Energy Saving & Fluorescent Market Revenues & Volume, By Residential, 2022-2032F |
6.2.4 Saudi Arabia Energy Saving & Fluorescent Market Revenues & Volume, By Government, 2022-2032F |
7 Saudi Arabia Energy Saving & Fluorescent Market Import-Export Trade Statistics |
7.1 Saudi Arabia Energy Saving & Fluorescent Market Export to Major Countries |
7.2 Saudi Arabia Energy Saving & Fluorescent Market Imports from Major Countries |
8 Saudi Arabia Energy Saving & Fluorescent Market Key Performance Indicators |
8.1 Energy consumption reduction rate in households and commercial buildings |
8.2 Number of new energy-saving products introduced to the market |
8.3 Percentage increase in adoption of energy-efficient lighting solutions |
8.4 Energy efficiency rating improvement in the country |
8.5 Number of energy-saving workshops and campaigns conducted annually |
9 Saudi Arabia Energy Saving & Fluorescent Market - Opportunity Assessment |
9.1 Saudi Arabia Energy Saving & Fluorescent Market Opportunity Assessment, By Sources, 2022 & 2032F |
9.2 Saudi Arabia Energy Saving & Fluorescent Market Opportunity Assessment, By Applications, 2022 & 2032F |
10 Saudi Arabia Energy Saving & Fluorescent Market - Competitive Landscape |
10.1 Saudi Arabia Energy Saving & Fluorescent Market Revenue Share, By Companies, 2025 |
10.2 Saudi Arabia Energy Saving & Fluorescent Market Competitive Benchmarking, By Operating and Technical Parameters |
11 Company Profiles |
12 Recommendations |
13 Disclaimer |
Global Go To Market Strategy - 2030
Export potential enables firms to identify high-growth global markets with greater confidence by combining advanced trade intelligence with a structured quantitative methodology. The framework analyzes emerging demand trends and country-level import patterns while integrating macroeconomic and trade datasets such as GDP and population forecasts, bilateral import–export flows, tariff structures, elasticity differentials between developed and developing economies, geographic distance, and import demand projections. Using weighted trade values from 2020–2024 as the base period to project country-to-country export potential for 2030, these inputs are operationalized through calculated drivers such as gravity model parameters, tariff impact factors, and projected GDP per-capita growth. Through an analysis of hidden potentials, demand hotspots, and market conditions that are most favorable to success, this method enables firms to focus on target countries, maximize returns, and global expansion with data, backed by accuracy.
By factoring in the projected importer demand gap that is currently unmet and could be potential opportunity, it identifies the potential for the Exporter (Country) among 190 countries, against the general trade analysis, which identifies the biggest importer or exporter.
To discover high-growth global markets and optimize your business strategy:
Click Here
Pricing
- Single User License$ 1,995
- Department License$ 2,400
- Site License$ 3,120
- Global License$ 3,795

Leadership Perspectives from Industry Events
Search
Thought Leadership and Analyst Meet


Our Clients
6WResearch In News
- India Air Conditioner Market Set for Strong Rebound in 2026 After Weather-Led Correction and GST-Driven Recovery: 6Wresearch
- ADAS in India: How Automatic Emergency Braking, Blind Spot Detection & Driver Monitoring are Transforming Road Safety
- Doha a strategic location for EV manufacturing hub: IPA Qatar
- Demand for luxury TVs surging in the GCC, says Samsung
- Empowering Growth: The Thriving Journey of Bangladesh’s Cable Industry
- Demand for luxury TVs surging in the GCC, says Samsung
Latest Reports
- Nicaragua RPG Gaming Market (2026-2032)
- New Zealand RPG Gaming Market (2026-2032)
- Netherlands RPG Gaming Market (2026-2032)
- Nauru RPG Gaming Market (2026-2032)
- Namibia RPG Gaming Market (2026-2032)
- Mozambique RPG Gaming Market (2026-2032)
- Montenegro RPG Gaming Market (2026-2032)
- Mongolia RPG Gaming Market (2026-2032)
- Monaco RPG Gaming Market (2026-2032)
- Micronesia RPG Gaming Market (2026-2032)
Industry Events and Analyst Meet

HIMTEX 2026

India Refining Summit 2026

India EV Show 2026

EV tech India Expo 2026

Auto Tech Asia 2026
Whitepaper
- Middle East & Africa Commercial Security Market Click here to view more.
- Middle East & Africa Fire Safety Systems & Equipment Market Click here to view more.
- GCC Drone Market Click here to view more.
- Middle East Lighting Fixture Market Click here to view more.
- GCC Physical & Perimeter Security Market Click here to view more.