Saudi Arabia Nitric Acid Market (2026-2032) Outlook | Size, Analysis, Value, Forecast, Trends, Growth, Industry, Share, Companies & Revenue
Market Forecast By Product Types (Concentration, Dilute Nitric Acid, Concentrated Nitric Acid), By Applications (Fertilizers, Ammonium Nitrate, Nitrobenzene, Toluene Di-Isocyanate, Adipic Acid, Nitro chlorobenzene, Others), By End-Use (Agrochemicals, Explosives, Chemical, Mining, Others) And Competitive Landscape
| Product Code: ETC125552 | Publication Date: Jun 2021 | Updated Date: Mar 2026 | Product Type: Report | |
| Publisher: 6Wresearch | Author: Ravi Bhandari | No. of Pages: 70 | No. of Figures: 35 | No. of Tables: 5 |
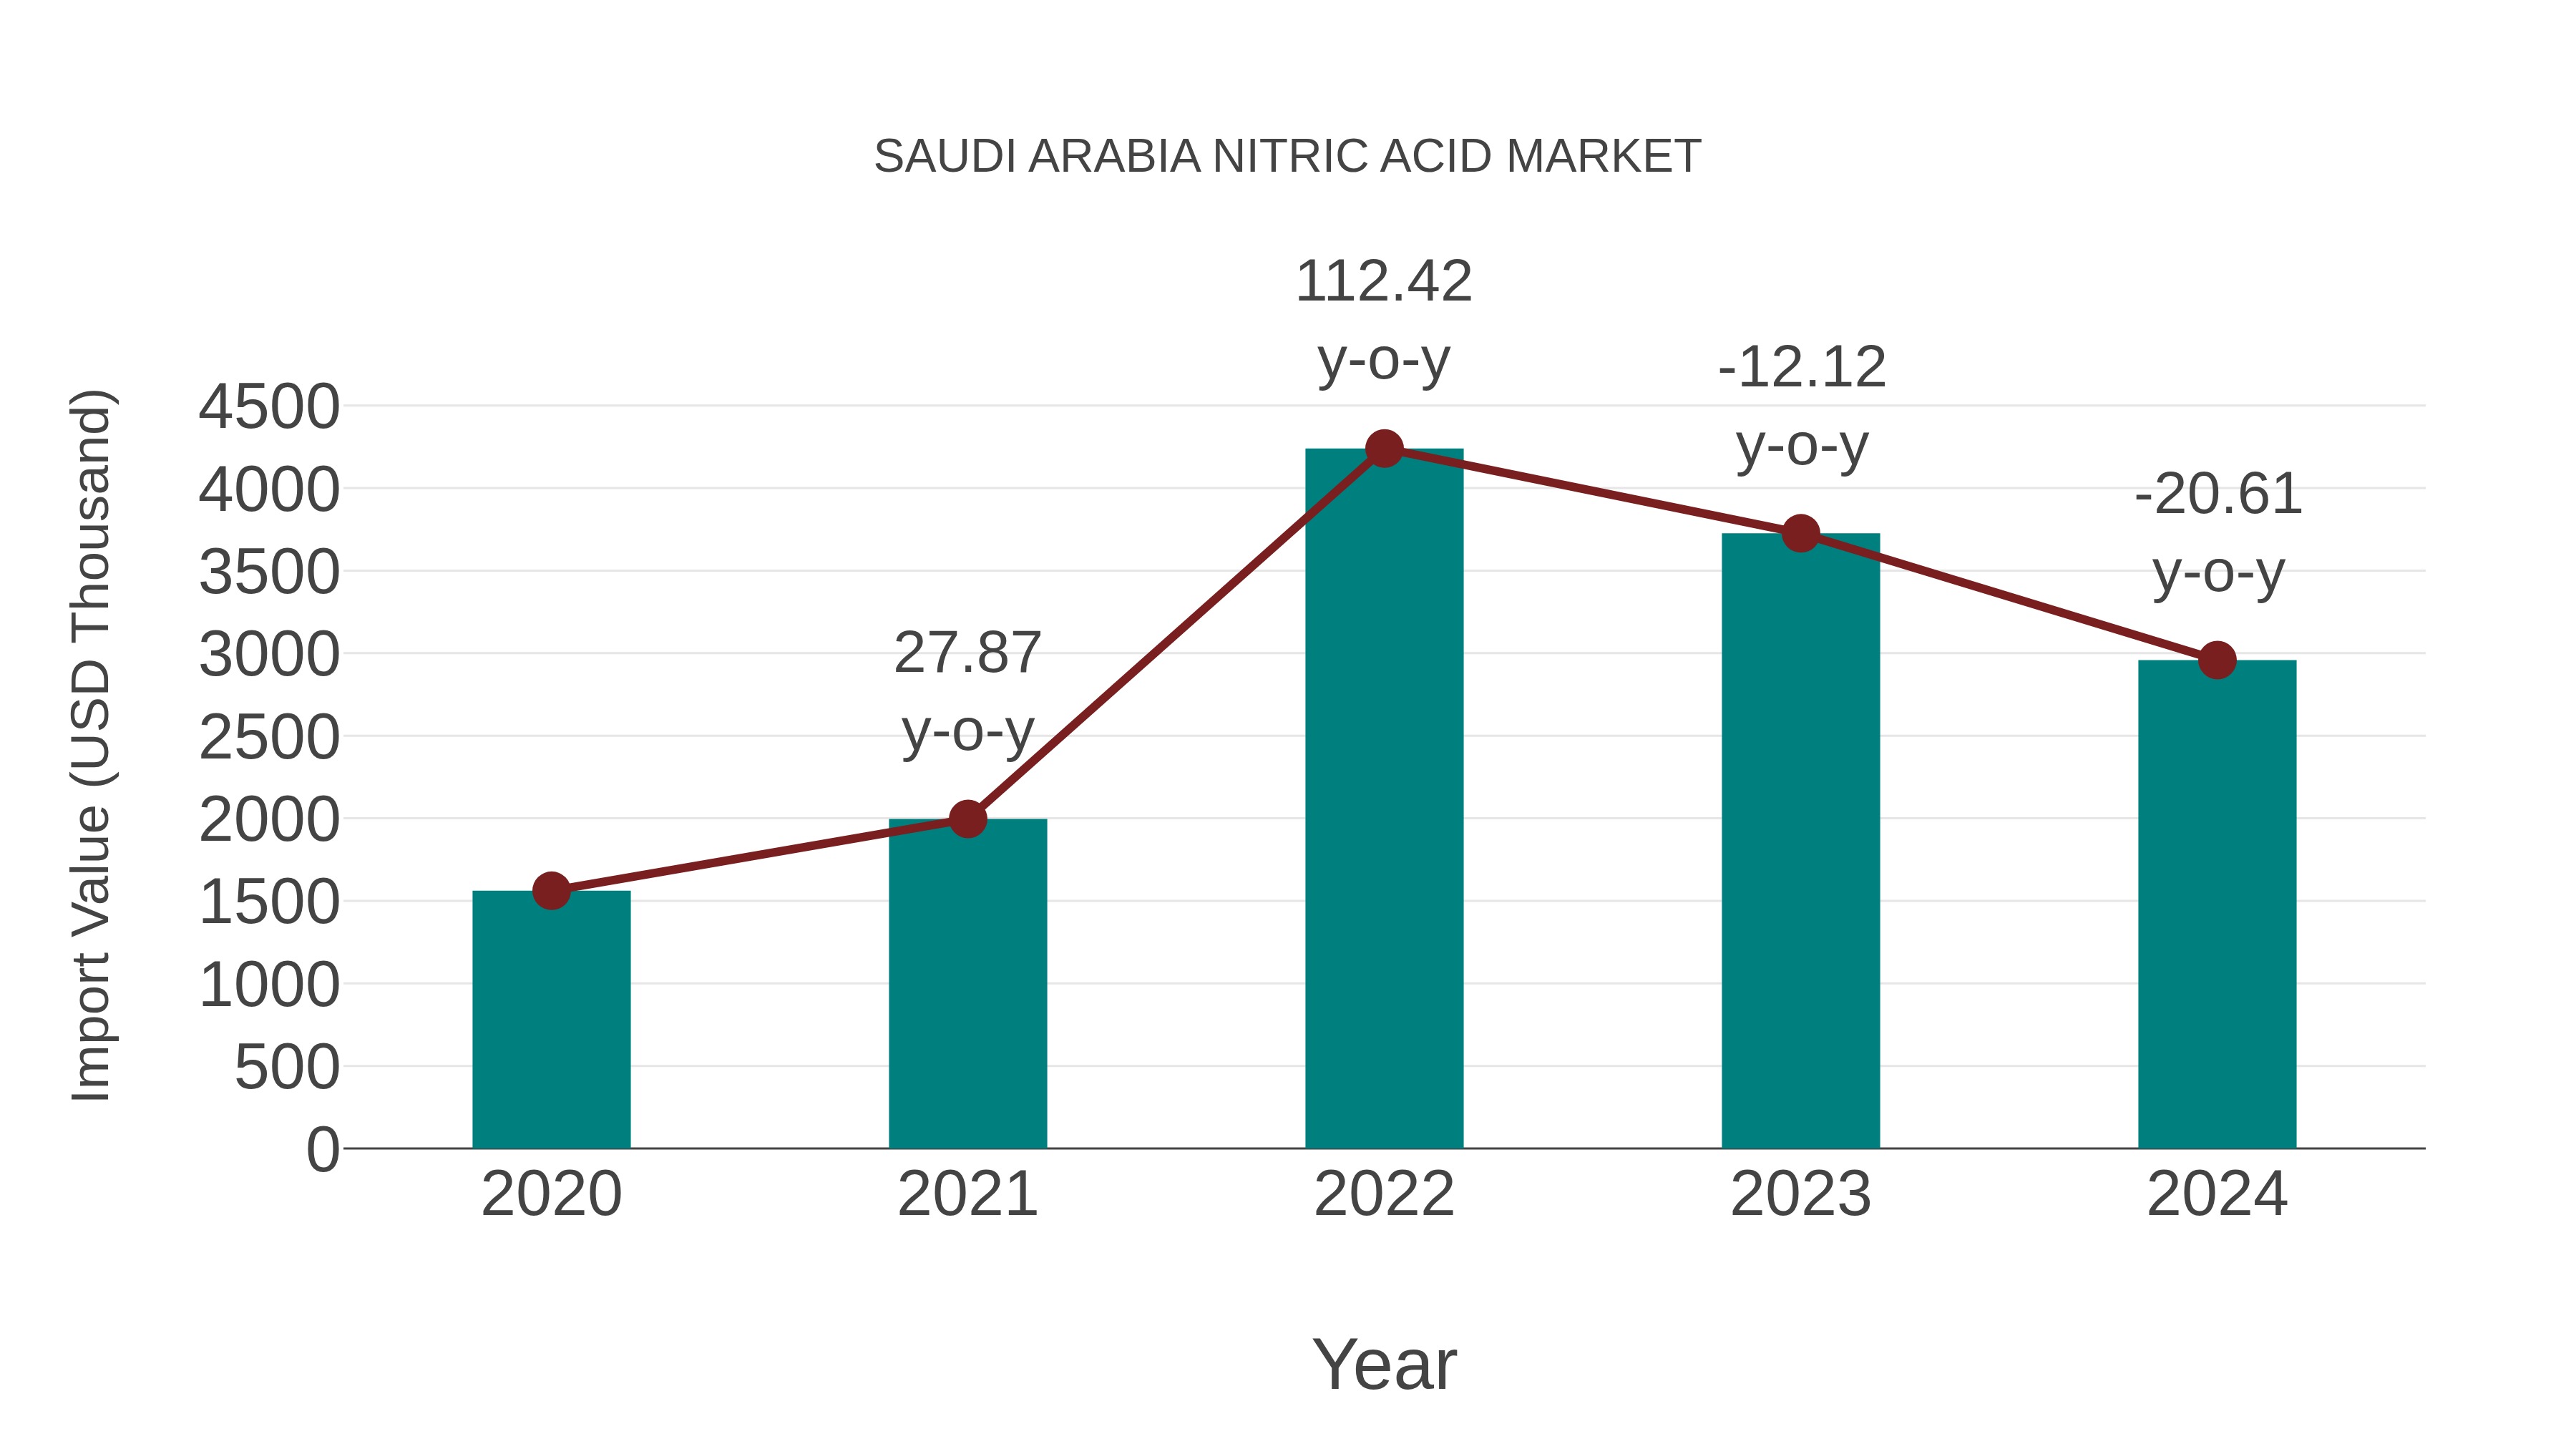
Saudi Arabia Nitric Acid Market: Import Trend Analysis
In the Saudi Arabia nitric acid market, the import trend experienced a decline from 2023 to 2024, with a growth rate of -20.61%. However, the compound annual growth rate (CAGR) for the period 2020-2024 stood at 17.33%. This decline in import momentum could be attributed to shifts in demand dynamics or changes in trade policies impacting market stability.
Saudi Arabia Nitric Acid Market Synopsis
The nitric acid market in Saudi Arabia is projected to reach USD xx billion by 2025, registering a CAGR of xx% during the forecast period (2025-2031).Increasing oil & gas and construction activities across the country are expected to boost demand for nitric acid over the coming years.In addition, growing fertilizers and chemical intermediates production is likely to propel product demand further in the foreseeable future.Furthermore, increasing government initiatives towards developing industrial infrastructure will support growth of this market in Saudi Arabia over the next few years.
Drivers of the Market
The growth of the Saudi Arabia nitric acid market can be attributed to the expanding agricultural and chemical industries.Nitric acid is a key component in the production of fertilizers and various chemicals.As Saudi Arabia seeks to enhance its domestic agricultural capabilities and support food security initiatives, the demand for fertilizers is expected to increase, consequently driving the demand for nitric acid.The chemical industry`s growth also contributes to the overall market expansion.
Challenges of the Market
The Saudi Arabia nitric acid market faces challenges related to stringent regulations and environmental concerns.Nitric acid production involves the handling of hazardous chemicals and emits nitrogen oxides, which are air pollutants.As environmental regulations tighten, manufacturers may need to invest in advanced pollution control technologies to mitigate their impact.Additionally, market players must balance increasing demand from various industries with sustainable production practices.
COVID-19 Impact on the Market
The Saudi Arabia nitric acid market experienced disruptions due to the COVID-19 pandemic.Industries like agriculture, chemicals, and manufacturing, which heavily rely on nitric acid, faced production halts and reduced demand during lockdowns.As economic activities resumed, demand gradually picked up, driven by agricultural needs and industrial processes.Major companies have continued to adapt to changing market dynamics, focusing on supply chain resilience and sustainable practices in the post-pandemic recovery phase.
Key Players in the Market
Prominent participants in the Saudi Arabia nitric acid market include Saudi Arabia Mining Company (Ma`aden) and Petro Rabigh.These companies are significant producers and suppliers of nitric acid, essential for various industrial processes.With a focus on chemical production and industrial growth in the region, these key players are expected to contribute to the stability and development of the nitric acid market.
Key Highlights of the Report:
- Saudi Arabia Nitric Acid Market Outlook
- Market Size of Saudi Arabia Nitric Acid Market, 2025
- Forecast of Saudi Arabia Nitric Acid Market, 2032
- Historical Data and Forecast of Saudi Arabia Nitric Acid Revenues & Volume for the Period 2022-2032F
- Saudi Arabia Nitric Acid Market Trend Evolution
- Saudi Arabia Nitric Acid Market Drivers and Challenges
- Saudi Arabia Nitric Acid Price Trends
- Saudi Arabia Nitric Acid Porter's Five Forces
- Saudi Arabia Nitric Acid Industry Life Cycle
- Historical Data and Forecast of Saudi Arabia Nitric Acid Market Revenues & Volume By Product Types for the Period 2022-2032F
- Historical Data and Forecast of Saudi Arabia Nitric Acid Market Revenues & Volume By Concentration for the Period 2022-2032F
- Historical Data and Forecast of Saudi Arabia Nitric Acid Market Revenues & Volume By Dilute Nitric Acid for the Period 2022-2032F
- Historical Data and Forecast of Saudi Arabia Nitric Acid Market Revenues & Volume By Concentrated Nitric Acid for the Period 2022-2032F
- Historical Data and Forecast of Saudi Arabia Nitric Acid Market Revenues & Volume By Applications for the Period 2022-2032F
- Historical Data and Forecast of Saudi Arabia Nitric Acid Market Revenues & Volume By Fertilizers for the Period 2022-2032F
- Historical Data and Forecast of Saudi Arabia Nitric Acid Market Revenues & Volume By Ammonium Nitrate for the Period 2022-2032F
- Historical Data and Forecast of Saudi Arabia Nitric Acid Market Revenues & Volume By Nitrobenzene for the Period 2022-2032F
- Historical Data and Forecast of Saudi Arabia Nitric Acid Market Revenues & Volume By Toluene Di-Isocyanate for the Period 2022-2032F
- Historical Data and Forecast of Saudi Arabia Nitric Acid Market Revenues & Volume By Adipic Acid for the Period 2022-2032F
- Historical Data and Forecast of Saudi Arabia Nitric Acid Market Revenues & Volume By Nitro chlorobenzene for the Period 2022-2032F
- Historical Data and Forecast of Saudi Arabia Nitric Acid Market Revenues & Volume By Others for the Period 2022-2032F
- Historical Data and Forecast of Saudi Arabia Nitric Acid Market Revenues & Volume By End-Use for the Period 2022-2032F
- Historical Data and Forecast of Saudi Arabia Nitric Acid Market Revenues & Volume By Agrochemicals for the Period 2022-2032F
- Historical Data and Forecast of Saudi Arabia Nitric Acid Market Revenues & Volume By Explosives for the Period 2022-2032F
- Historical Data and Forecast of Saudi Arabia Nitric Acid Market Revenues & Volume By Chemical for the Period 2022-2032F
- Historical Data and Forecast of Saudi Arabia Nitric Acid Market Revenues & Volume By Mining for the Period 2022-2032F
- Historical Data and Forecast of Saudi Arabia Nitric Acid Market Revenues & Volume By Others for the Period 2022-2032F
- Saudi Arabia Nitric Acid Import Export Trade Statistics
- Market Opportunity Assessment By Product Types
- Market Opportunity Assessment By Applications
- Market Opportunity Assessment By End-Use
- Saudi Arabia Nitric Acid Top Companies Market Share
- Saudi Arabia Nitric Acid Competitive Benchmarking By Technical and Operational Parameters
- Saudi Arabia Nitric Acid Company Profiles
- Saudi Arabia Nitric Acid Key Strategic Recommendations
Saudi Arabia Nitric Acid Market (2026-2032): FAQs
6Wresearch actively monitors the Saudi Arabia Nitric Acid Market and publishes its comprehensive annual report, highlighting emerging trends, growth drivers, revenue analysis, and forecast outlook. Our insights help businesses to make data-backed strategic decisions with ongoing market dynamics. Our analysts track relevent industries related to the Saudi Arabia Nitric Acid Market, allowing our clients with actionable intelligence and reliable forecasts tailored to emerging regional needs.
Yes, we provide customisation as per your requirements. To learn more, feel free to contact us on sales@6wresearch.com
Saudi Arabia Nitric Acid |
1 Executive Summary |
2 Introduction |
2.1 Key Highlights of the Report |
2.2 Report Description |
2.3 Market Scope & Segmentation |
2.4 Research Methodology |
2.5 Assumptions |
3 Saudi Arabia Nitric Acid Market Overview |
3.1 Saudi Arabia Country Macro Economic Indicators |
3.2 Saudi Arabia Nitric Acid Market Revenues & Volume, 2022 & 2032F |
3.3 Saudi Arabia Nitric Acid Market - Industry Life Cycle |
3.4 Saudi Arabia Nitric Acid Market - Porter's Five Forces |
3.5 Saudi Arabia Nitric Acid Market Revenues & Volume Share, By Product Types, 2022 & 2032F |
3.6 Saudi Arabia Nitric Acid Market Revenues & Volume Share, By Applications, 2022 & 2032F |
3.7 Saudi Arabia Nitric Acid Market Revenues & Volume Share, By End-Use, 2022 & 2032F |
4 Saudi Arabia Nitric Acid Market Dynamics |
4.1 Impact Analysis |
4.2 Market Drivers |
4.2.1 Growth in the agriculture sector leading to increased demand for fertilizers like ammonium nitrate, a key application of nitric acid. |
4.2.2 Expansion of the chemical industry in Saudi Arabia, driving the demand for nitric acid in the production of various chemicals. |
4.2.3 Government initiatives promoting industrial growth and investments in sectors that utilize nitric acid, such as pharmaceuticals and explosives. |
4.3 Market Restraints |
4.3.1 Volatility in raw material prices impacting the production cost of nitric acid. |
4.3.2 Stringent environmental regulations regarding emissions and waste disposal, leading to compliance challenges for nitric acid manufacturers. |
4.3.3 Competition from alternative products or technologies affecting the market share of nitric acid. |
5 Saudi Arabia Nitric Acid Market Trends |
6 Saudi Arabia Nitric Acid Market, By Types |
6.1 Saudi Arabia Nitric Acid Market, By Product Types |
6.1.1 Overview and Analysis |
6.1.2 Saudi Arabia Nitric Acid Market Revenues & Volume, By Product Types, 2022-2032F |
6.1.3 Saudi Arabia Nitric Acid Market Revenues & Volume, By Concentration, 2022-2032F |
6.1.4 Saudi Arabia Nitric Acid Market Revenues & Volume, By Dilute Nitric Acid, 2022-2032F |
6.1.5 Saudi Arabia Nitric Acid Market Revenues & Volume, By Concentrated Nitric Acid, 2022-2032F |
6.2 Saudi Arabia Nitric Acid Market, By Applications |
6.2.1 Overview and Analysis |
6.2.2 Saudi Arabia Nitric Acid Market Revenues & Volume, By Fertilizers, 2022-2032F |
6.2.3 Saudi Arabia Nitric Acid Market Revenues & Volume, By Ammonium Nitrate, 2022-2032F |
6.2.4 Saudi Arabia Nitric Acid Market Revenues & Volume, By Nitrobenzene, 2022-2032F |
6.2.5 Saudi Arabia Nitric Acid Market Revenues & Volume, By Toluene Di-Isocyanate, 2022-2032F |
6.2.6 Saudi Arabia Nitric Acid Market Revenues & Volume, By Adipic Acid, 2022-2032F |
6.2.7 Saudi Arabia Nitric Acid Market Revenues & Volume, By Nitro chlorobenzene, 2022-2032F |
6.3 Saudi Arabia Nitric Acid Market, By End-Use |
6.3.1 Overview and Analysis |
6.3.2 Saudi Arabia Nitric Acid Market Revenues & Volume, By Agrochemicals, 2022-2032F |
6.3.3 Saudi Arabia Nitric Acid Market Revenues & Volume, By Explosives, 2022-2032F |
6.3.4 Saudi Arabia Nitric Acid Market Revenues & Volume, By Chemical, 2022-2032F |
6.3.5 Saudi Arabia Nitric Acid Market Revenues & Volume, By Mining, 2022-2032F |
6.3.6 Saudi Arabia Nitric Acid Market Revenues & Volume, By Others, 2022-2032F |
7 Saudi Arabia Nitric Acid Market Import-Export Trade Statistics |
7.1 Saudi Arabia Nitric Acid Market Export to Major Countries |
7.2 Saudi Arabia Nitric Acid Market Imports from Major Countries |
8 Saudi Arabia Nitric Acid Market Key Performance Indicators |
8.1 Capacity utilization rate of nitric acid production facilities in Saudi Arabia. |
8.2 Number of new product launches or applications utilizing nitric acid in different industries. |
8.3 Research and development expenditure allocated to innovations in nitric acid production processes. |
8.4 Energy efficiency improvements in nitric acid production plants. |
8.5 Adoption rate of sustainable practices in the nitric acid industry, such as recycling and waste management. |
9 Saudi Arabia Nitric Acid Market - Opportunity Assessment |
9.1 Saudi Arabia Nitric Acid Market Opportunity Assessment, By Product Types, 2022 & 2032F |
9.2 Saudi Arabia Nitric Acid Market Opportunity Assessment, By Applications, 2022 & 2032F |
9.3 Saudi Arabia Nitric Acid Market Opportunity Assessment, By End-Use, 2022 & 2032F |
10 Saudi Arabia Nitric Acid Market - Competitive Landscape |
10.1 Saudi Arabia Nitric Acid Market Revenue Share, By Companies, 2025 |
10.2 Saudi Arabia Nitric Acid Market Competitive Benchmarking, By Operating and Technical Parameters |
11 Company Profiles |
12 Recommendations |
13 Disclaimer |
Global Go To Market Strategy - 2030
Export potential enables firms to identify high-growth global markets with greater confidence by combining advanced trade intelligence with a structured quantitative methodology. The framework analyzes emerging demand trends and country-level import patterns while integrating macroeconomic and trade datasets such as GDP and population forecasts, bilateral import–export flows, tariff structures, elasticity differentials between developed and developing economies, geographic distance, and import demand projections. Using weighted trade values from 2020–2024 as the base period to project country-to-country export potential for 2030, these inputs are operationalized through calculated drivers such as gravity model parameters, tariff impact factors, and projected GDP per-capita growth. Through an analysis of hidden potentials, demand hotspots, and market conditions that are most favorable to success, this method enables firms to focus on target countries, maximize returns, and global expansion with data, backed by accuracy.
By factoring in the projected importer demand gap that is currently unmet and could be potential opportunity, it identifies the potential for the Exporter (Country) among 190 countries, against the general trade analysis, which identifies the biggest importer or exporter.
To discover high-growth global markets and optimize your business strategy:
Click Here
Pricing
- Single User License$ 1,995
- Department License$ 2,400
- Site License$ 3,120
- Global License$ 3,795

Leadership Perspectives from Industry Events
Search
Thought Leadership and Analyst Meet


Our Clients
6WResearch In News
- India Air Conditioner Market Set for Strong Rebound in 2026 After Weather-Led Correction and GST-Driven Recovery: 6Wresearch
- ADAS in India: How Automatic Emergency Braking, Blind Spot Detection & Driver Monitoring are Transforming Road Safety
- Doha a strategic location for EV manufacturing hub: IPA Qatar
- Demand for luxury TVs surging in the GCC, says Samsung
- Empowering Growth: The Thriving Journey of Bangladesh’s Cable Industry
- Demand for luxury TVs surging in the GCC, says Samsung
Latest Reports
- Nicaragua RPG Gaming Market (2026-2032)
- New Zealand RPG Gaming Market (2026-2032)
- Netherlands RPG Gaming Market (2026-2032)
- Nauru RPG Gaming Market (2026-2032)
- Namibia RPG Gaming Market (2026-2032)
- Mozambique RPG Gaming Market (2026-2032)
- Montenegro RPG Gaming Market (2026-2032)
- Mongolia RPG Gaming Market (2026-2032)
- Monaco RPG Gaming Market (2026-2032)
- Micronesia RPG Gaming Market (2026-2032)
Industry Events and Analyst Meet

HIMTEX 2026

India Refining Summit 2026

India EV Show 2026

EV tech India Expo 2026

Auto Tech Asia 2026
Whitepaper
- Middle East & Africa Commercial Security Market Click here to view more.
- Middle East & Africa Fire Safety Systems & Equipment Market Click here to view more.
- GCC Drone Market Click here to view more.
- Middle East Lighting Fixture Market Click here to view more.
- GCC Physical & Perimeter Security Market Click here to view more.