Seychelles Military Radars Market (2026-2032) | Industry, Growth, Outlook, Size, Segmentation, Companies, Trends, Value, Revenue, Analysis, Forecast & Share
Market Forecast By Component (Transmitter, Digital Signal Processor), By Platform (Land, Naval, Airborne, Space), By Technology (SDR, Quantum, Conventional), By Application (Airspace Monitoring & Traffic Management, Air & Missile Defense, Weapon Guidance, Ground Surveillance & Intruder Detection, Airborne Mapping, Navigation, Mine Detection & Underground Mapping, Ground Force Protection & Counter Battery), By Waveform/frequency modulations (Frequency Modulated Continuous Wave (FMCW), Doppler) And Competitive Landscape
| Product Code: ETC5855006 | Publication Date: Nov 2023 | Updated Date: Mar 2026 | Product Type: Market Research Report | |
| Publisher: 6Wresearch | Author: Ravi Bhandari | No. of Pages: 60 | No. of Figures: 30 | No. of Tables: 5 |
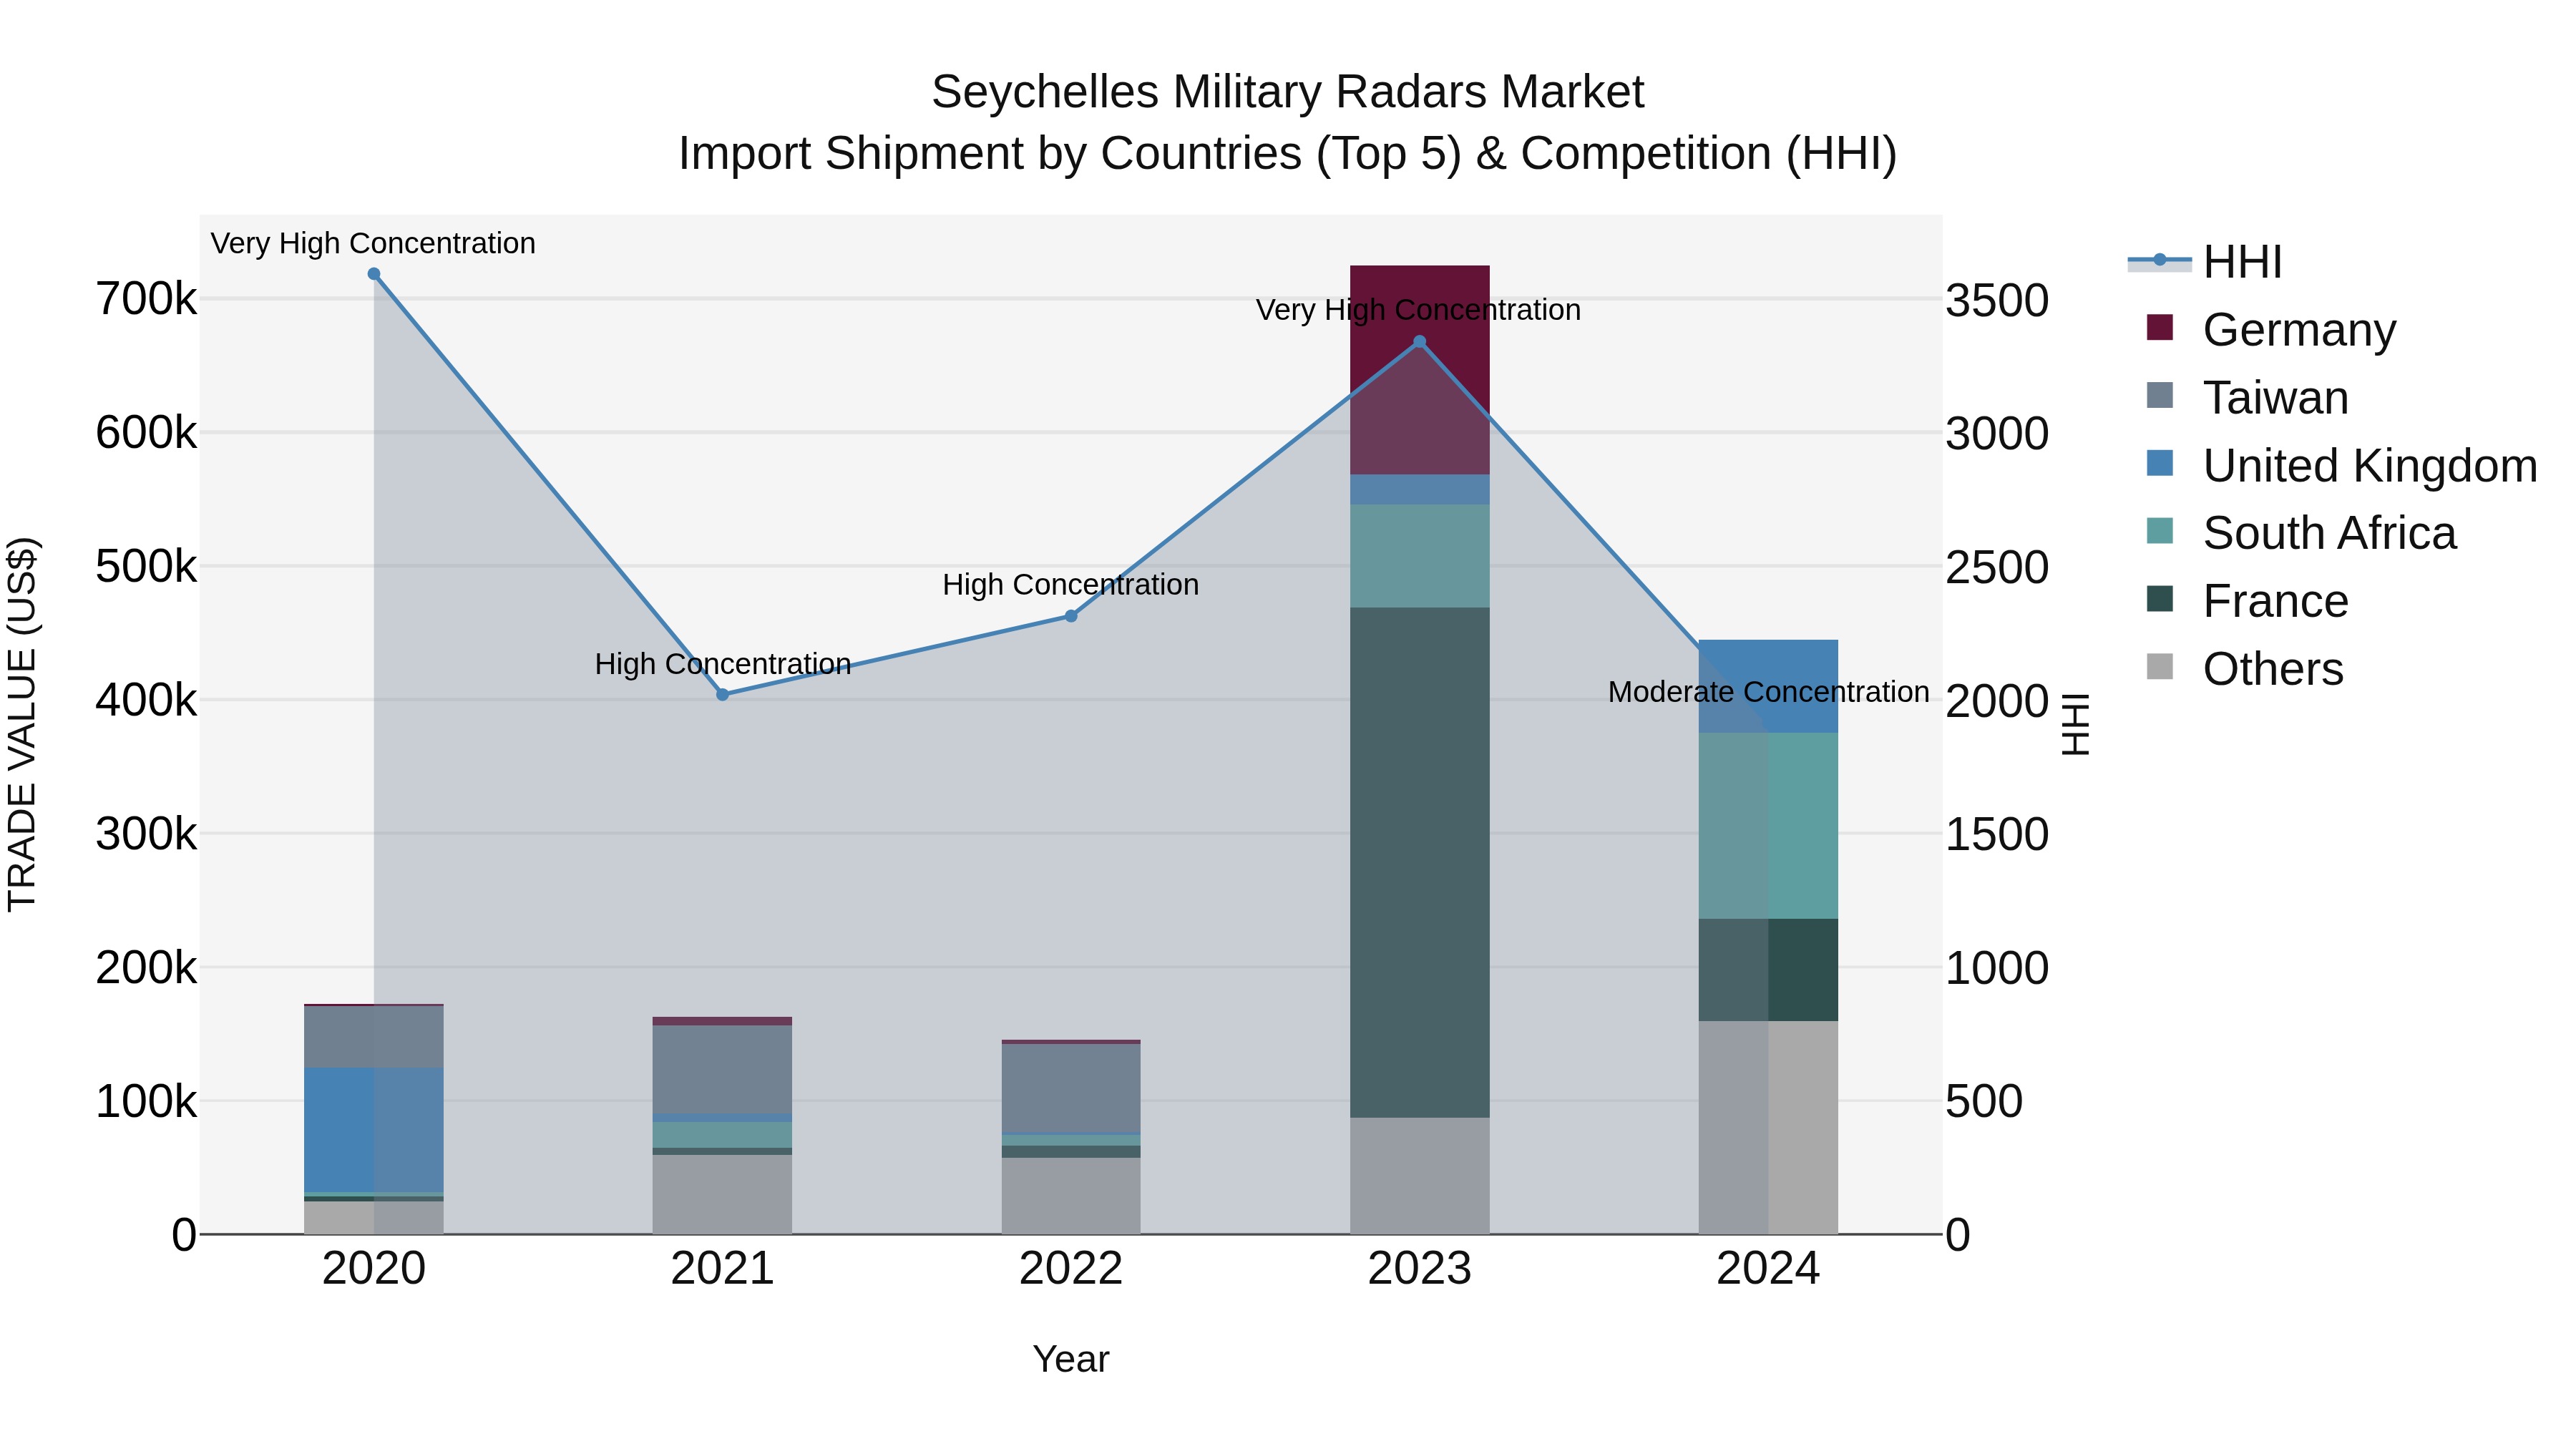
Seychelles Military Radars Market: Top 5 Importing Countries and Market Competition (HHI) Analysis
In 2024, Seychelles saw a shift in its military radar import sources, with South Africa, USA, France, UK, and China leading the way. The market displayed a significant decrease in concentration compared to 2023, moving from very high to moderate levels. Despite a strong compound annual growth rate (CAGR) of 26.72% from 2020 to 2024, there was a notable decline in the growth rate from 2023 to 2024 at -38.64%. This change highlights evolving dynamics in the Seychelles military radar import market, indicating potential shifts in supplier relationships and market trends.
Key Highlights of the Report:
- Seychelles Military Radars Market Outlook
- Market Size of Seychelles Military Radars Market, 2025
- Forecast of Seychelles Military Radars Market, 2032
- Historical Data and Forecast of Seychelles Military Radars Revenues & Volume for the Period 2022 - 2032F
- Seychelles Military Radars Market Trend Evolution
- Seychelles Military Radars Market Drivers and Challenges
- Seychelles Military Radars Price Trends
- Seychelles Military Radars Porter`s Five Forces
- Seychelles Military Radars Industry Life Cycle
- Historical Data and Forecast of Seychelles Military Radars Market Revenues & Volume By Component for the Period 2022 - 2032F
- Historical Data and Forecast of Seychelles Military Radars Market Revenues & Volume By Transmitter for the Period 2022 - 2032F
- Historical Data and Forecast of Seychelles Military Radars Market Revenues & Volume By Digital Signal Processor for the Period 2022 - 2032F
- Historical Data and Forecast of Seychelles Military Radars Market Revenues & Volume By Platform for the Period 2022 - 2032F
- Historical Data and Forecast of Seychelles Military Radars Market Revenues & Volume By Land for the Period 2022 - 2032F
- Historical Data and Forecast of Seychelles Military Radars Market Revenues & Volume By Naval for the Period 2022 - 2032F
- Historical Data and Forecast of Seychelles Military Radars Market Revenues & Volume By Airborne for the Period 2022 - 2032F
- Historical Data and Forecast of Seychelles Military Radars Market Revenues & Volume By Space for the Period 2022 - 2032F
- Historical Data and Forecast of Seychelles Military Radars Market Revenues & Volume By Technology for the Period 2022 - 2032F
- Historical Data and Forecast of Seychelles Military Radars Market Revenues & Volume By SDR for the Period 2022 - 2032F
- Historical Data and Forecast of Seychelles Military Radars Market Revenues & Volume By Quantum for the Period 2022 - 2032F
- Historical Data and Forecast of Seychelles Military Radars Market Revenues & Volume By Conventional for the Period 2022 - 2032F
- Historical Data and Forecast of Seychelles Military Radars Market Revenues & Volume By Application for the Period 2022 - 2032F
- Historical Data and Forecast of Seychelles Military Radars Market Revenues & Volume By Airspace Monitoring & Traffic Management for the Period 2022 - 2032F
- Historical Data and Forecast of Seychelles Military Radars Market Revenues & Volume By Air & Missile Defense for the Period 2022 - 2032F
- Historical Data and Forecast of Seychelles Military Radars Market Revenues & Volume By Weapon Guidance for the Period 2022 - 2032F
- Historical Data and Forecast of Seychelles Military Radars Market Revenues & Volume By Ground Surveillance & Intruder Detection for the Period 2022 - 2032F
- Historical Data and Forecast of Seychelles Military Radars Market Revenues & Volume By Airborne Mapping for the Period 2022 - 2032F
- Historical Data and Forecast of Seychelles Military Radars Market Revenues & Volume By Navigation for the Period 2022 - 2032F
- Historical Data and Forecast of Seychelles Military Radars Market Revenues & Volume By Mine Detection & Underground Mapping for the Period 2022 - 2032F
- Historical Data and Forecast of Seychelles Military Radars Market Revenues & Volume By Ground Force Protection & Counter Battery for the Period 2022 - 2032F
- Historical Data and Forecast of Seychelles Military Radars Market Revenues & Volume By Waveform/frequency modulations for the Period 2022 - 2032F
- Historical Data and Forecast of Seychelles Military Radars Market Revenues & Volume By Frequency Modulated Continuous Wave (FMCW) for the Period 2022 - 2032F
- Historical Data and Forecast of Seychelles Military Radars Market Revenues & Volume By Doppler for the Period 2022 - 2032F
- Seychelles Military Radars Import Export Trade Statistics
- Market Opportunity Assessment By Component
- Market Opportunity Assessment By Platform
- Market Opportunity Assessment By Technology
- Market Opportunity Assessment By Application
- Market Opportunity Assessment By Waveform/frequency modulations
- Seychelles Military Radars Top Companies Market Share
- Seychelles Military Radars Competitive Benchmarking By Technical and Operational Parameters
- Seychelles Military Radars Company Profiles
- Seychelles Military Radars Key Strategic Recommendations
Frequently Asked Questions About the Market Study (FAQs):
6Wresearch actively monitors the Seychelles Military Radars Market and publishes its comprehensive annual report, highlighting emerging trends, growth drivers, revenue analysis, and forecast outlook. Our insights help businesses to make data-backed strategic decisions with ongoing market dynamics. Our analysts track relevent industries related to the Seychelles Military Radars Market, allowing our clients with actionable intelligence and reliable forecasts tailored to emerging regional needs.
Yes, we provide customisation as per your requirements. To learn more, feel free to contact us on sales@6wresearch.com
1 Executive Summary |
2 Introduction |
2.1 Key Highlights of the Report |
2.2 Report Description |
2.3 Market Scope & Segmentation |
2.4 Research Methodology |
2.5 Assumptions |
3 Seychelles Military Radars Market Overview |
3.1 Seychelles Country Macro Economic Indicators |
3.2 Seychelles Military Radars Market Revenues & Volume, 2022 & 2032F |
3.3 Seychelles Military Radars Market - Industry Life Cycle |
3.4 Seychelles Military Radars Market - Porter's Five Forces |
3.5 Seychelles Military Radars Market Revenues & Volume Share, By Component, 2022 & 2032F |
3.6 Seychelles Military Radars Market Revenues & Volume Share, By Platform, 2022 & 2032F |
3.7 Seychelles Military Radars Market Revenues & Volume Share, By Technology, 2022 & 2032F |
3.8 Seychelles Military Radars Market Revenues & Volume Share, By Application, 2022 & 2032F |
3.9 Seychelles Military Radars Market Revenues & Volume Share, By Waveform/frequency modulations, 2022 & 2032F |
4 Seychelles Military Radars Market Dynamics |
4.1 Impact Analysis |
4.2 Market Drivers |
4.2.1 Increase in defense spending by the Seychelles government |
4.2.2 Growing need for modernization and enhancement of military capabilities |
4.2.3 Rising security concerns and threats in the region |
4.3 Market Restraints |
4.3.1 High initial investment cost for radar systems |
4.3.2 Limited budget allocation for military expenditures |
4.3.3 Dependence on foreign suppliers for advanced radar technology |
5 Seychelles Military Radars Market Trends |
6 Seychelles Military Radars Market Segmentations |
6.1 Seychelles Military Radars Market, By Component |
6.1.1 Overview and Analysis |
6.1.2 Seychelles Military Radars Market Revenues & Volume, By Transmitter, 2022 - 2032F |
6.1.3 Seychelles Military Radars Market Revenues & Volume, By Digital Signal Processor, 2022 - 2032F |
6.2 Seychelles Military Radars Market, By Platform |
6.2.1 Overview and Analysis |
6.2.2 Seychelles Military Radars Market Revenues & Volume, By Land, 2022 - 2032F |
6.2.3 Seychelles Military Radars Market Revenues & Volume, By Naval, 2022 - 2032F |
6.2.4 Seychelles Military Radars Market Revenues & Volume, By Airborne, 2022 - 2032F |
6.2.5 Seychelles Military Radars Market Revenues & Volume, By Space, 2022 - 2032F |
6.3 Seychelles Military Radars Market, By Technology |
6.3.1 Overview and Analysis |
6.3.2 Seychelles Military Radars Market Revenues & Volume, By SDR, 2022 - 2032F |
6.3.3 Seychelles Military Radars Market Revenues & Volume, By Quantum, 2022 - 2032F |
6.3.4 Seychelles Military Radars Market Revenues & Volume, By Conventional, 2022 - 2032F |
6.4 Seychelles Military Radars Market, By Application |
6.4.1 Overview and Analysis |
6.4.2 Seychelles Military Radars Market Revenues & Volume, By Airspace Monitoring & Traffic Management, 2022 - 2032F |
6.4.3 Seychelles Military Radars Market Revenues & Volume, By Air & Missile Defense, 2022 - 2032F |
6.4.4 Seychelles Military Radars Market Revenues & Volume, By Weapon Guidance, 2022 - 2032F |
6.4.5 Seychelles Military Radars Market Revenues & Volume, By Ground Surveillance & Intruder Detection, 2022 - 2032F |
6.4.6 Seychelles Military Radars Market Revenues & Volume, By Airborne Mapping, 2022 - 2032F |
6.4.7 Seychelles Military Radars Market Revenues & Volume, By Navigation, 2022 - 2032F |
6.4.8 Seychelles Military Radars Market Revenues & Volume, By Ground Force Protection & Counter Battery, 2022 - 2032F |
6.4.9 Seychelles Military Radars Market Revenues & Volume, By Ground Force Protection & Counter Battery, 2022 - 2032F |
6.5 Seychelles Military Radars Market, By Waveform/frequency modulations |
6.5.1 Overview and Analysis |
6.5.2 Seychelles Military Radars Market Revenues & Volume, By Frequency Modulated Continuous Wave (FMCW), 2022 - 2032F |
6.5.3 Seychelles Military Radars Market Revenues & Volume, By Doppler, 2022 - 2032F |
7 Seychelles Military Radars Market Import-Export Trade Statistics |
7.1 Seychelles Military Radars Market Export to Major Countries |
7.2 Seychelles Military Radars Market Imports from Major Countries |
8 Seychelles Military Radars Market Key Performance Indicators |
8.1 Percentage increase in defense budget allocation for radar systems |
8.2 Number of successful radar system installations in the Seychelles military |
8.3 Average time taken for radar system integration and implementation in military operations. |
9 Seychelles Military Radars Market - Opportunity Assessment |
9.1 Seychelles Military Radars Market Opportunity Assessment, By Component, 2022 & 2032F |
9.2 Seychelles Military Radars Market Opportunity Assessment, By Platform, 2022 & 2032F |
9.3 Seychelles Military Radars Market Opportunity Assessment, By Technology, 2022 & 2032F |
9.4 Seychelles Military Radars Market Opportunity Assessment, By Application, 2022 & 2032F |
9.5 Seychelles Military Radars Market Opportunity Assessment, By Waveform/frequency modulations, 2022 & 2032F |
10 Seychelles Military Radars Market - Competitive Landscape |
10.1 Seychelles Military Radars Market Revenue Share, By Companies, 2025 |
10.2 Seychelles Military Radars Market Competitive Benchmarking, By Operating and Technical Parameters |
11 Company Profiles |
12 Recommendations | 13 Disclaimer |
Global Go To Market Strategy - 2030
Export potential enables firms to identify high-growth global markets with greater confidence by combining advanced trade intelligence with a structured quantitative methodology. The framework analyzes emerging demand trends and country-level import patterns while integrating macroeconomic and trade datasets such as GDP and population forecasts, bilateral import–export flows, tariff structures, elasticity differentials between developed and developing economies, geographic distance, and import demand projections. Using weighted trade values from 2020–2024 as the base period to project country-to-country export potential for 2030, these inputs are operationalized through calculated drivers such as gravity model parameters, tariff impact factors, and projected GDP per-capita growth. Through an analysis of hidden potentials, demand hotspots, and market conditions that are most favorable to success, this method enables firms to focus on target countries, maximize returns, and global expansion with data, backed by accuracy.
By factoring in the projected importer demand gap that is currently unmet and could be potential opportunity, it identifies the potential for the Exporter (Country) among 190 countries, against the general trade analysis, which identifies the biggest importer or exporter.
To discover high-growth global markets and optimize your business strategy:
Click Here
Pricing
- Single User License$ 1,995
- Department License$ 2,400
- Site License$ 3,120
- Global License$ 3,795

Leadership Perspectives from Industry Events
Search
Thought Leadership and Analyst Meet


Our Clients
6WResearch In News
- Doha a strategic location for EV manufacturing hub: IPA Qatar
- Demand for luxury TVs surging in the GCC, says Samsung
- Empowering Growth: The Thriving Journey of Bangladesh’s Cable Industry
- Demand for luxury TVs surging in the GCC, says Samsung
- Video call with a traditional healer? Once unthinkable, it’s now common in South Africa
- Intelligent Buildings To Smooth GCC’s Path To Net Zero
Latest Reports
- Taiwan Airport Wireless Infrastructure Market (2026-2032)
- Vietnam Airport Wireless Infrastructure Market (2026-2032)
- Thailand Airport Wireless Infrastructure Market (2026-2032)
- South Korea Airport Wireless Infrastructure Market (2026-2032)
- Romania Airport Wireless Infrastructure Market (2026-2032)
- Qatar Airport Wireless Infrastructure Market (2026-2032)
- Philippines Airport Wireless Infrastructure Market (2026-2032)
- Japan Airport Wireless Infrastructure Market (2026-2032)
- Taiwan Airport Winter Services Market (2026-2032)
- Vietnam Airport Winter Services Market (2026-2032)
Industry Events and Analyst Meet

HIMTEX 2026

India Refining Summit 2026

India EV Show 2026

EV tech India Expo 2026

Auto Tech Asia 2026
Whitepaper
- Middle East & Africa Commercial Security Market Click here to view more.
- Middle East & Africa Fire Safety Systems & Equipment Market Click here to view more.
- GCC Drone Market Click here to view more.
- Middle East Lighting Fixture Market Click here to view more.
- GCC Physical & Perimeter Security Market Click here to view more.