Singapore Calcium Cyanide Market (2026-2032) Outlook | Size, Trends, Industry, Value, Growth, Forecast, Revenue, Companies, Share & Analysis
Market Forecast By Application (Mining Industry, Agrochemical, Other), By Type (Solid Flake Calcium Cyanide, Powder Calcium Cyanide, Liquid Calcium Cyanide) And Competitive Landscape
| Product Code: ETC203979 | Publication Date: May 2022 | Updated Date: Jul 2026 | Product Type: Market Research Report | |
| Publisher: 6Wresearch | Author: Ravi Bhandari | No. of Pages: 60 | No. of Figures: 40 | No. of Tables: 7 |
Singapore Calcium Cyanide Market Size, Share & Growth Rate
The Singapore Calcium Cyanide Market was estimated at USD 232 Million in 2025 and is projected to reach USD 325 Million by 2032, growing at a CAGR of 4.9% from 2026 to 2032. This positive trajectory is largely driven by the robust demand for gold in the region and the significant role calcium cyanide plays in gold mining operations. As mining activities ramp up and chemical industries evolve, Singapore's strategic position as a trade hub further solidifies its importance in the calcium cyanide market.
Singapore Calcium Cyanide Market Year-wise Growth Rate and Key Drivers
This graph highlights how the Singapore Calcium Cyanide Market has steadily grown over the years, supported by major growth factors.
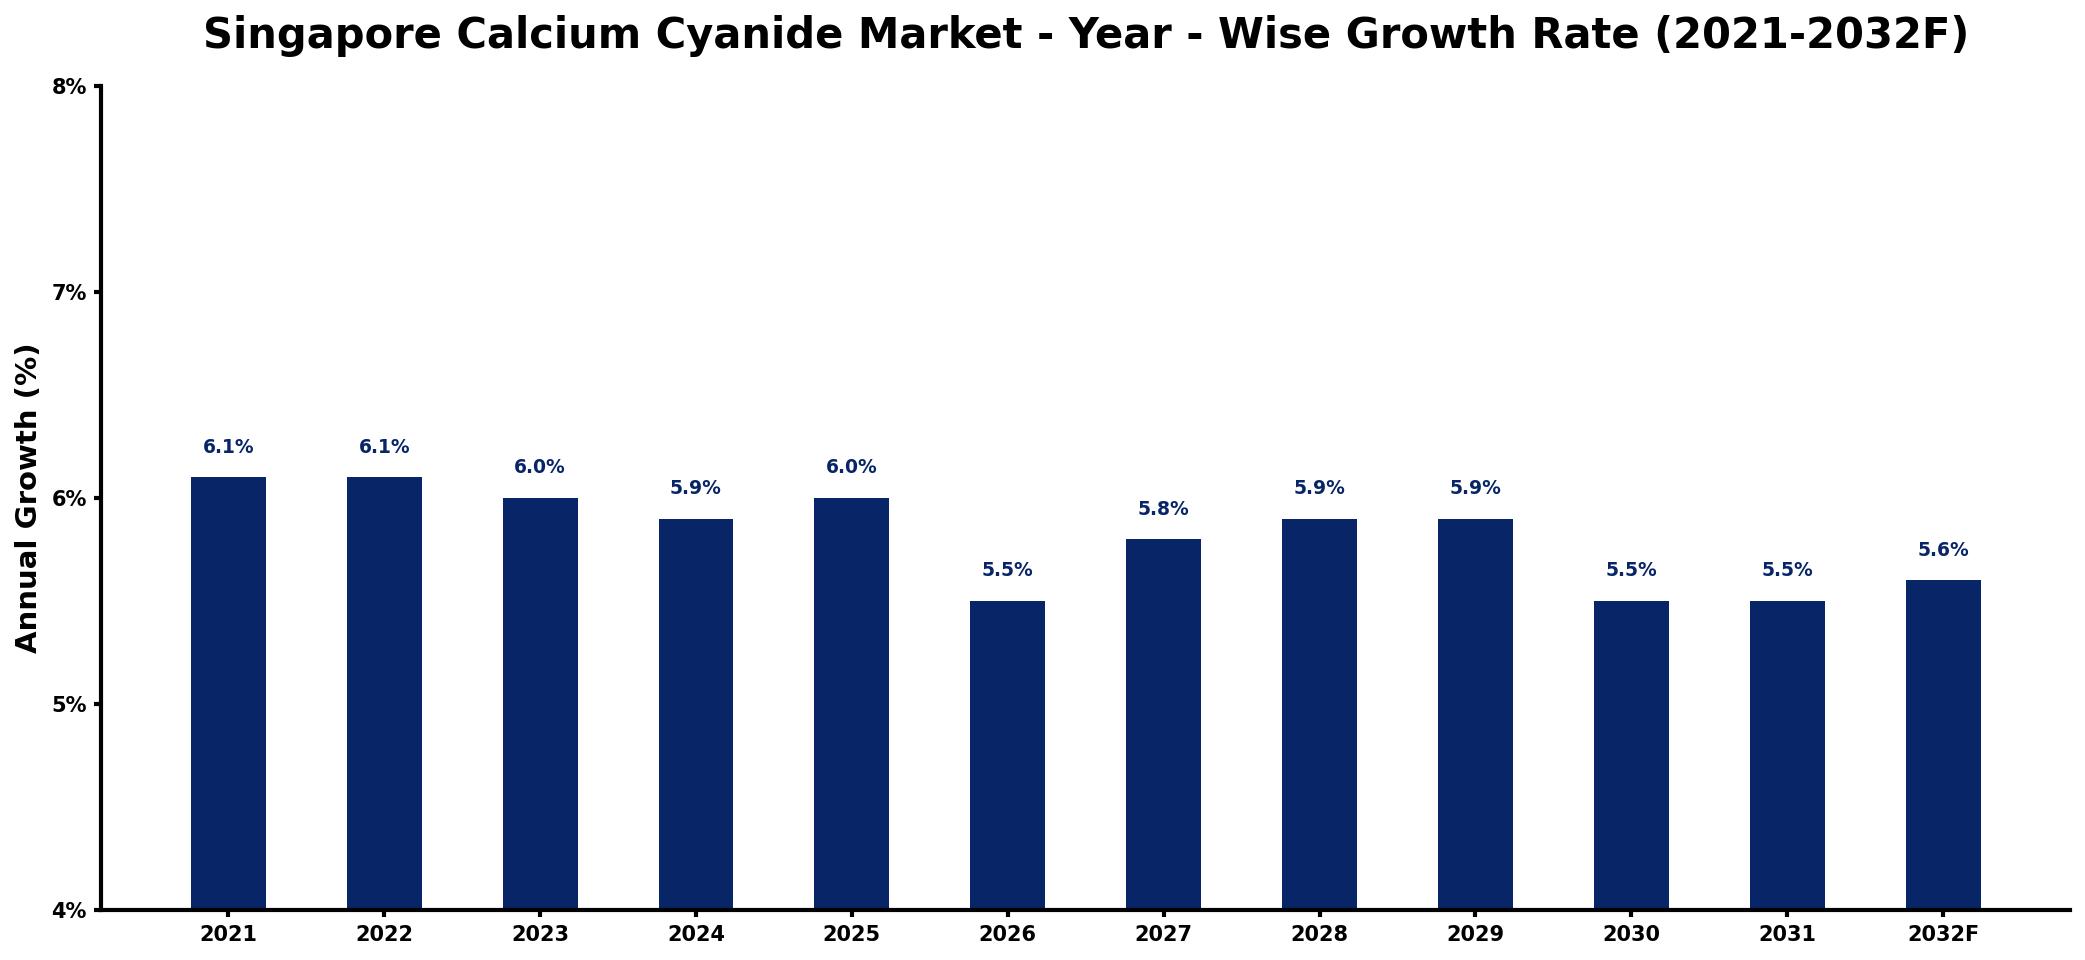
The table below presents the year‑wise growth rates along with the key drivers influencing the market
| Year | Growth Rate | Major Drivers |
| 2021 | 6.1% | Rising demand in agriculture sector |
| 2022 | 6.1% | Increased investments in mining activities |
| 2023 | 6.0% | Expansion of chemical manufacturing facilities |
| 2024 | 5.9% | increased pharmaceutical industry usage |
| 2025 | 6.0% | Enhanced regulations supporting industrial applications |
| 2026 | 5.5% | Emerging markets seeking chemical solutions |
| 2027 | 5.8% | Technological advancements in production methods |
| 2028 | 5.9% | Strengthened supply chain networks established |
| 2029 | 5.9% | Growing applications in metallurgy processes |
| 2030 | 5.5% | Increased focus on sustainable practices |
| 2031 | 5.5% | strengthening international trade flows |
| 2032 | 5.6% | Expanding usage in water treatment |
Note: Market size estimations and growth projections presented in this report are based on 6Wresearch's proprietary forecasting methodology, utilizing the latest available industry data, government publications, and primary research inputs.
Singapore Calcium Cyanide Market Synopsis
The Singapore calcium cyanide market has experienced fluctuating momentum recently, primarily due to external economic pressures and regulatory changes. However, as global gold prices stabilize and mining operations resume full capacity, the market is poised for an upward shift.
As Singapore continues to enhance its commitment to sustainable mining practices, the demand for calcium cyanide remains strong. Companies are adapting to changing regulations while leveraging the markets unique position within Southeast Asia to ensure a steady supply for the chemical and mining sectors.
Singapore Calcium Cyanide Market Key Takeaways
- The Singapore calcium cyanide market is tightly interlinked with gold mining and chemical synthesis applications.
- Ongoing environmental regulations will necessitate increased safety measures in handling calcium cyanide.
- Post-COVID recovery is expected to influence market dynamics and demand projections positively.
- Key players are focusing on sustainable practices amidst fluctuating gold prices.
- Singapores central location enhances its role as a pivotal trade hub for calcium cyanide in the region.
Evaluation of Restraints in Singapore Calcium Cyanide Market
While the Singapore calcium cyanide market shows promising growth prospects, several restraints are inhibiting its full potential. Safety concerns stemming from the toxicity of calcium cyanide necessitate rigorous handling and disposal protocols, which can lead to increased operational costs. Furthermore, as environmental scrutiny intensifies, there are greater demands for compliance with regulations that may limit production capabilities and create hurdles for new entrants into the market. These factors contribute to a cautious business environment where companies must navigate both safety and regulatory landscapes diligently.
Singapore Calcium Cyanide Market Trends
Several current and emerging trends are shaping the Singapore calcium cyanide market. There is an increasing focus on sustainability and responsible mining practices, pushing companies to innovate safer methods of production and usage. Additionally, advancements in chemical synthesis processes are making calcium cyanide more vital in various industrial applications. As digitalization permeates the industry, data-driven decision-making is improving supply chain efficiencies and market responsiveness.
Singapore Calcium Cyanide Market Opportunities
The future holds genuine growth opportunities within the Singapore calcium cyanide market. As gold prices remain favorable, the mining sector is set to expand, increasing the demand for calcium cyanide. Moreover, the chemical synthesis industry is exploring new applications for calcium cyanide, opening avenues for diversification. Companies that prioritize innovation and adhere to environmental regulations are likely to secure a competitive advantage, positioning themselves favorably for future investments.
Government Initiatives in the Singapore Calcium Cyanide Market
The Singapore government has implemented various initiatives aimed at enhancing the mining and chemical industries, which directly impacts the calcium cyanide market. Policies promoting sustainable mining practices and environmental responsibility are becoming increasingly prominent. Additionally, government-backed programs encouraging research and development within the chemical sector support advancements in production techniques and safety measures. Such public spending initiatives signify a robust commitment to fostering a safe and sustainable industry.
Future Insights of the Singapore Calcium Cyanide Market
Looking ahead to 2026-2032, the Singapore calcium cyanide market is positioned for steady growth, driven by both the resumption of mining activities and advancements in the chemical industry. As companies adapt to evolving regulatory landscapes, strategic investments in safety and sustainability will be crucial. The market's resilience will hinge on its ability to balance production with environmental responsibilities, ensuring a healthy trajectory amidst global economic shifts.
Singapore Calcium Cyanide Market Latest Developments (2025 - 2026)
Recent developments in the Singapore calcium cyanide market reflect a renewed focus on safety and regulatory compliance following the disruptions caused by the COVID-19 pandemic. As industries recalibrate, efforts to improve operational efficiencies and explore sustainable alternatives have gained momentum. Additionally, ongoing collaborations between stakeholders in the mining and chemical sectors are fostering innovation, paving the way for enhanced supply chain dynamics in the forthcoming years.
Singapore Calcium Cyanide Market - Key Attractiveness of the Report
- 10 Years of Market Numbers
- Historical Data Starting from 2022 to 2025
- Base Year: 2025
- Forecast Data until 2032
- Key Performance Indicators Impacting the Market
- Major Upcoming Developments and Projects
Key Highlights of the Report:
- Singapore Calcium Cyanide Market Outlook
- Market Size of Singapore Calcium Cyanide Market, 2025
- Forecast of Singapore Calcium Cyanide Market, 2032
- Historical Data and Forecast of Singapore Calcium Cyanide Revenues & Volume for the Period 2022-2032F
- Singapore Calcium Cyanide Market Trend Evolution
- Singapore Calcium Cyanide Market Drivers and Challenges
- Singapore Calcium Cyanide Price Trends
- Singapore Calcium Cyanide Porter's Five Forces
- Singapore Calcium Cyanide Industry Life Cycle
- Historical Data and Forecast of Singapore Calcium Cyanide Market Revenues & Volume By Application for the Period 2022-2032F
- Historical Data and Forecast of Singapore Calcium Cyanide Market Revenues & Volume By Mining Industry for the Period 2022-2032F
- Historical Data and Forecast of Singapore Calcium Cyanide Market Revenues & Volume By Agrochemical for the Period 2022-2032F
- Historical Data and Forecast of Singapore Calcium Cyanide Market Revenues & Volume By Other for the Period 2022-2032F
- Historical Data and Forecast of Singapore Calcium Cyanide Market Revenues & Volume By Type for the Period 2022-2032F
- Historical Data and Forecast of Singapore Calcium Cyanide Market Revenues & Volume By Solid Flake Calcium Cyanide for the Period 2022-2032F
- Historical Data and Forecast of Singapore Calcium Cyanide Market Revenues & Volume By Powder Calcium Cyanide for the Period 2022-2032F
- Historical Data and Forecast of Singapore Calcium Cyanide Market Revenues & Volume By Liquid Calcium Cyanide for the Period 2022-2032F
- Singapore Calcium Cyanide Import Export Trade Statistics
- Market Opportunity Assessment By Application
- Market Opportunity Assessment By Type
- Singapore Calcium Cyanide Top Companies Market Share
- Singapore Calcium Cyanide Competitive Benchmarking By Technical and Operational Parameters
- Singapore Calcium Cyanide Company Profiles
- Singapore Calcium Cyanide Key Strategic Recommendations
Frequently Asked Questions About the Market Study (FAQs):
Singapore’s strategic position enhances its role as a crucial hub for calcium cyanide distribution in the region, driven largely by the consistent demand for gold in nearby markets.
The Singapore Calcium Cyanide Market was estimated at USD 232 Million in 2025 and is projected to reach USD 325 Million by 2032, growing at a CAGR of 4.9% from 2026 to 2032.
Stricter environmental regulations related to cyanide usage could limit production and create compliance challenges, impacting overall market dynamics and safety practices.
The primary applications of calcium cyanide in Singapore are in gold mining and various chemical synthesis processes, highlighting its versatility and significance.
Innovation is crucial as companies seek to enhance safety measures and develop alternative applications, driving demand and improving industry standards.
6Wresearch actively monitors the Singapore Calcium Cyanide Market and publishes its comprehensive annual report, highlighting emerging trends, growth drivers, revenue analysis, and forecast outlook. Our insights help businesses to make data-backed strategic decisions with ongoing market dynamics. Our analysts track relevent industries related to the Singapore Calcium Cyanide Market, allowing our clients with actionable intelligence and reliable forecasts tailored to emerging regional needs.
Yes, we provide customisation as per your requirements. To learn more, feel free to contact us on sales@6wresearch.com
1 Executive Summary |
2 Introduction |
2.1 Key Highlights of the Report |
2.2 Report Description |
2.3 Market Scope & Segmentation |
2.4 Research Methodology |
2.5 Assumptions |
3 Singapore Calcium Cyanide Market Overview |
3.1 Singapore Country Macro Economic Indicators |
3.2 Singapore Calcium Cyanide Market Revenues & Volume, 2022 & 2032F |
3.3 Singapore Calcium Cyanide Market - Industry Life Cycle |
3.4 Singapore Calcium Cyanide Market - Porter's Five Forces |
3.5 Singapore Calcium Cyanide Market Revenues & Volume Share, By Application, 2022 & 2032F |
3.6 Singapore Calcium Cyanide Market Revenues & Volume Share, By Type, 2022 & 2032F |
4 Singapore Calcium Cyanide Market Dynamics |
4.1 Impact Analysis |
4.2 Market Drivers |
4.2.1 Growing demand for calcium cyanide in the mining industry for gold extraction |
4.2.2 Increasing use of calcium cyanide in the chemical industry for the production of various chemicals |
4.2.3 Rise in agricultural activities leading to higher use of calcium cyanide in pest control |
4.3 Market Restraints |
4.3.1 Stringent regulations and environmental concerns regarding the use of calcium cyanide |
4.3.2 Fluctuating prices of raw materials affecting the production cost |
5 Singapore Calcium Cyanide Market Trends |
6 Singapore Calcium Cyanide Market, By Types |
6.1 Singapore Calcium Cyanide Market, By Application |
6.1.1 Overview and Analysis |
6.1.2 Singapore Calcium Cyanide Market Revenues & Volume, By Application, 2022-2032F |
6.1.3 Singapore Calcium Cyanide Market Revenues & Volume, By Mining Industry, 2022-2032F |
6.1.4 Singapore Calcium Cyanide Market Revenues & Volume, By Agrochemical, 2022-2032F |
6.1.5 Singapore Calcium Cyanide Market Revenues & Volume, By Other, 2022-2032F |
6.2 Singapore Calcium Cyanide Market, By Type |
6.2.1 Overview and Analysis |
6.2.2 Singapore Calcium Cyanide Market Revenues & Volume, By Solid Flake Calcium Cyanide, 2022-2032F |
6.2.3 Singapore Calcium Cyanide Market Revenues & Volume, By Powder Calcium Cyanide, 2022-2032F |
6.2.4 Singapore Calcium Cyanide Market Revenues & Volume, By Liquid Calcium Cyanide, 2022-2032F |
7 Singapore Calcium Cyanide Market Import-Export Trade Statistics |
7.1 Singapore Calcium Cyanide Market Export to Major Countries |
7.2 Singapore Calcium Cyanide Market Imports from Major Countries |
8 Singapore Calcium Cyanide Market Key Performance Indicators |
8.1 Number of new mining projects in Singapore |
8.2 Volume of calcium cyanide used in the chemical industry |
8.3 Amount of calcium cyanide used in agriculture for pest control |
9 Singapore Calcium Cyanide Market - Opportunity Assessment |
9.1 Singapore Calcium Cyanide Market Opportunity Assessment, By Application, 2022 & 2032F |
9.2 Singapore Calcium Cyanide Market Opportunity Assessment, By Type, 2022 & 2032F |
10 Singapore Calcium Cyanide Market - Competitive Landscape |
10.1 Singapore Calcium Cyanide Market Revenue Share, By Companies, 2025 |
10.2 Singapore Calcium Cyanide Market Competitive Benchmarking, By Operating and Technical Parameters |
11 Company Profiles |
12 Recommendations |
13 Disclaimer |
Global Go To Market Strategy - 2030
Export potential enables firms to identify high-growth global markets with greater confidence by combining advanced trade intelligence with a structured quantitative methodology. The framework analyzes emerging demand trends and country-level import patterns while integrating macroeconomic and trade datasets such as GDP and population forecasts, bilateral import–export flows, tariff structures, elasticity differentials between developed and developing economies, geographic distance, and import demand projections. Using weighted trade values from 2020–2024 as the base period to project country-to-country export potential for 2030, these inputs are operationalized through calculated drivers such as gravity model parameters, tariff impact factors, and projected GDP per-capita growth. Through an analysis of hidden potentials, demand hotspots, and market conditions that are most favorable to success, this method enables firms to focus on target countries, maximize returns, and global expansion with data, backed by accuracy.
By factoring in the projected importer demand gap that is currently unmet and could be potential opportunity, it identifies the potential for the Exporter (Country) among 190 countries, against the general trade analysis, which identifies the biggest importer or exporter.
To discover high-growth global markets and optimize your business strategy:
Click Here
Pricing
- Single User License$ 1,995
- Department License$ 2,400
- Site License$ 3,120
- Global License$ 3,795

Leadership Perspectives from Industry Events
Search
Thought Leadership and Analyst Meet


Our Clients
6WResearch In News
- India Air Conditioner Market Set for Strong Rebound in 2026 After Weather-Led Correction and GST-Driven Recovery: 6Wresearch
- ADAS in India: How Automatic Emergency Braking, Blind Spot Detection & Driver Monitoring are Transforming Road Safety
- Doha a strategic location for EV manufacturing hub: IPA Qatar
- Demand for luxury TVs surging in the GCC, says Samsung
- Empowering Growth: The Thriving Journey of Bangladesh’s Cable Industry
- Demand for luxury TVs surging in the GCC, says Samsung
Latest Reports
- Nicaragua RPG Gaming Market (2026-2032)
- New Zealand RPG Gaming Market (2026-2032)
- Netherlands RPG Gaming Market (2026-2032)
- Nauru RPG Gaming Market (2026-2032)
- Namibia RPG Gaming Market (2026-2032)
- Mozambique RPG Gaming Market (2026-2032)
- Montenegro RPG Gaming Market (2026-2032)
- Mongolia RPG Gaming Market (2026-2032)
- Monaco RPG Gaming Market (2026-2032)
- Micronesia RPG Gaming Market (2026-2032)
Industry Events and Analyst Meet

EV India Expo 2026

HIMTEX 2026

India Refining Summit 2026

India EV Show 2026

EV tech India Expo 2026
Whitepaper
- Middle East & Africa Commercial Security Market Click here to view more.
- Middle East & Africa Fire Safety Systems & Equipment Market Click here to view more.
- GCC Drone Market Click here to view more.
- Middle East Lighting Fixture Market Click here to view more.
- GCC Physical & Perimeter Security Market Click here to view more.