Singapore Contactor Market (2026-2032) | Companies, Industry, Size, Forecast, Revenue, COVID-19 IMPACT, Growth, Analysis, Trends, Outlook, Value & Share
Market Forecast By Type (Solid-State Contactor, Magnetic Contactor, Vacuum Contactor, Lighting Contactor), By Product (DC Contactor, AC Contactor), By Poles (2-Pole, 3-Pole, 4-Pole, Others), By Voltage (Low Voltage (Up To 1 KV), Medium Voltage (1 KV – 7.2 KV), High Voltage (Above 7.2 KV)), By End-users (Automotive, Power, Oil & Gas, Food & Beverage, Construction, Data Centers, FA Robots , Others) And Competitive Landscape
| Product Code: ETC014027 | Publication Date: Jun 2023 | Product Type: Report | ||
| Publisher: 6Wresearch | Author: Ravi Bhandari | No. of Pages: 70 | No. of Figures: 35 | No. of Tables: 5 |
Singapore Contactor Market Summary
The singapore contactor market was estimated at USD 311 Million in 2025 and is projected to reach USD 409 Million by 2032, growing at a CAGR of 4.5% from 2026 to 2032.
Singapore Contactor Market Growth Rate Analysis (2021-2032)
The Singapore contractor market has shown a stable yet dynamic growth pattern, with yearly growth rates fluctuating between 4.4% and 5.1% from 2021 to 2032. The growth peaked at 5.1% in 2021, driven largely by increased demand in the construction and infrastructure sectors, particularly due to government investments in urban development and energy transition projects. Although growth softened to 4.5% in 2022, it rebounded to 4.9% in 2023 as digitalization and technological advancements enhanced operational efficiencies. From 2024 through 2026, growth stabilized at 4.5%, reflecting consistent consumer demand and a robust pipeline of construction projects. The market is expected to sustain this momentum, with anticipated growth rates ranging from 4.4% to 5.0% in the following years, supported by ongoing infrastructure initiatives and evolving industry policies.
Singapore Contactor Market Year-wise Growth Rate and Key Drivers
This graph highlights how the Singapore Contactor Market has steadily grown over the past five years, supported by major growth factors.
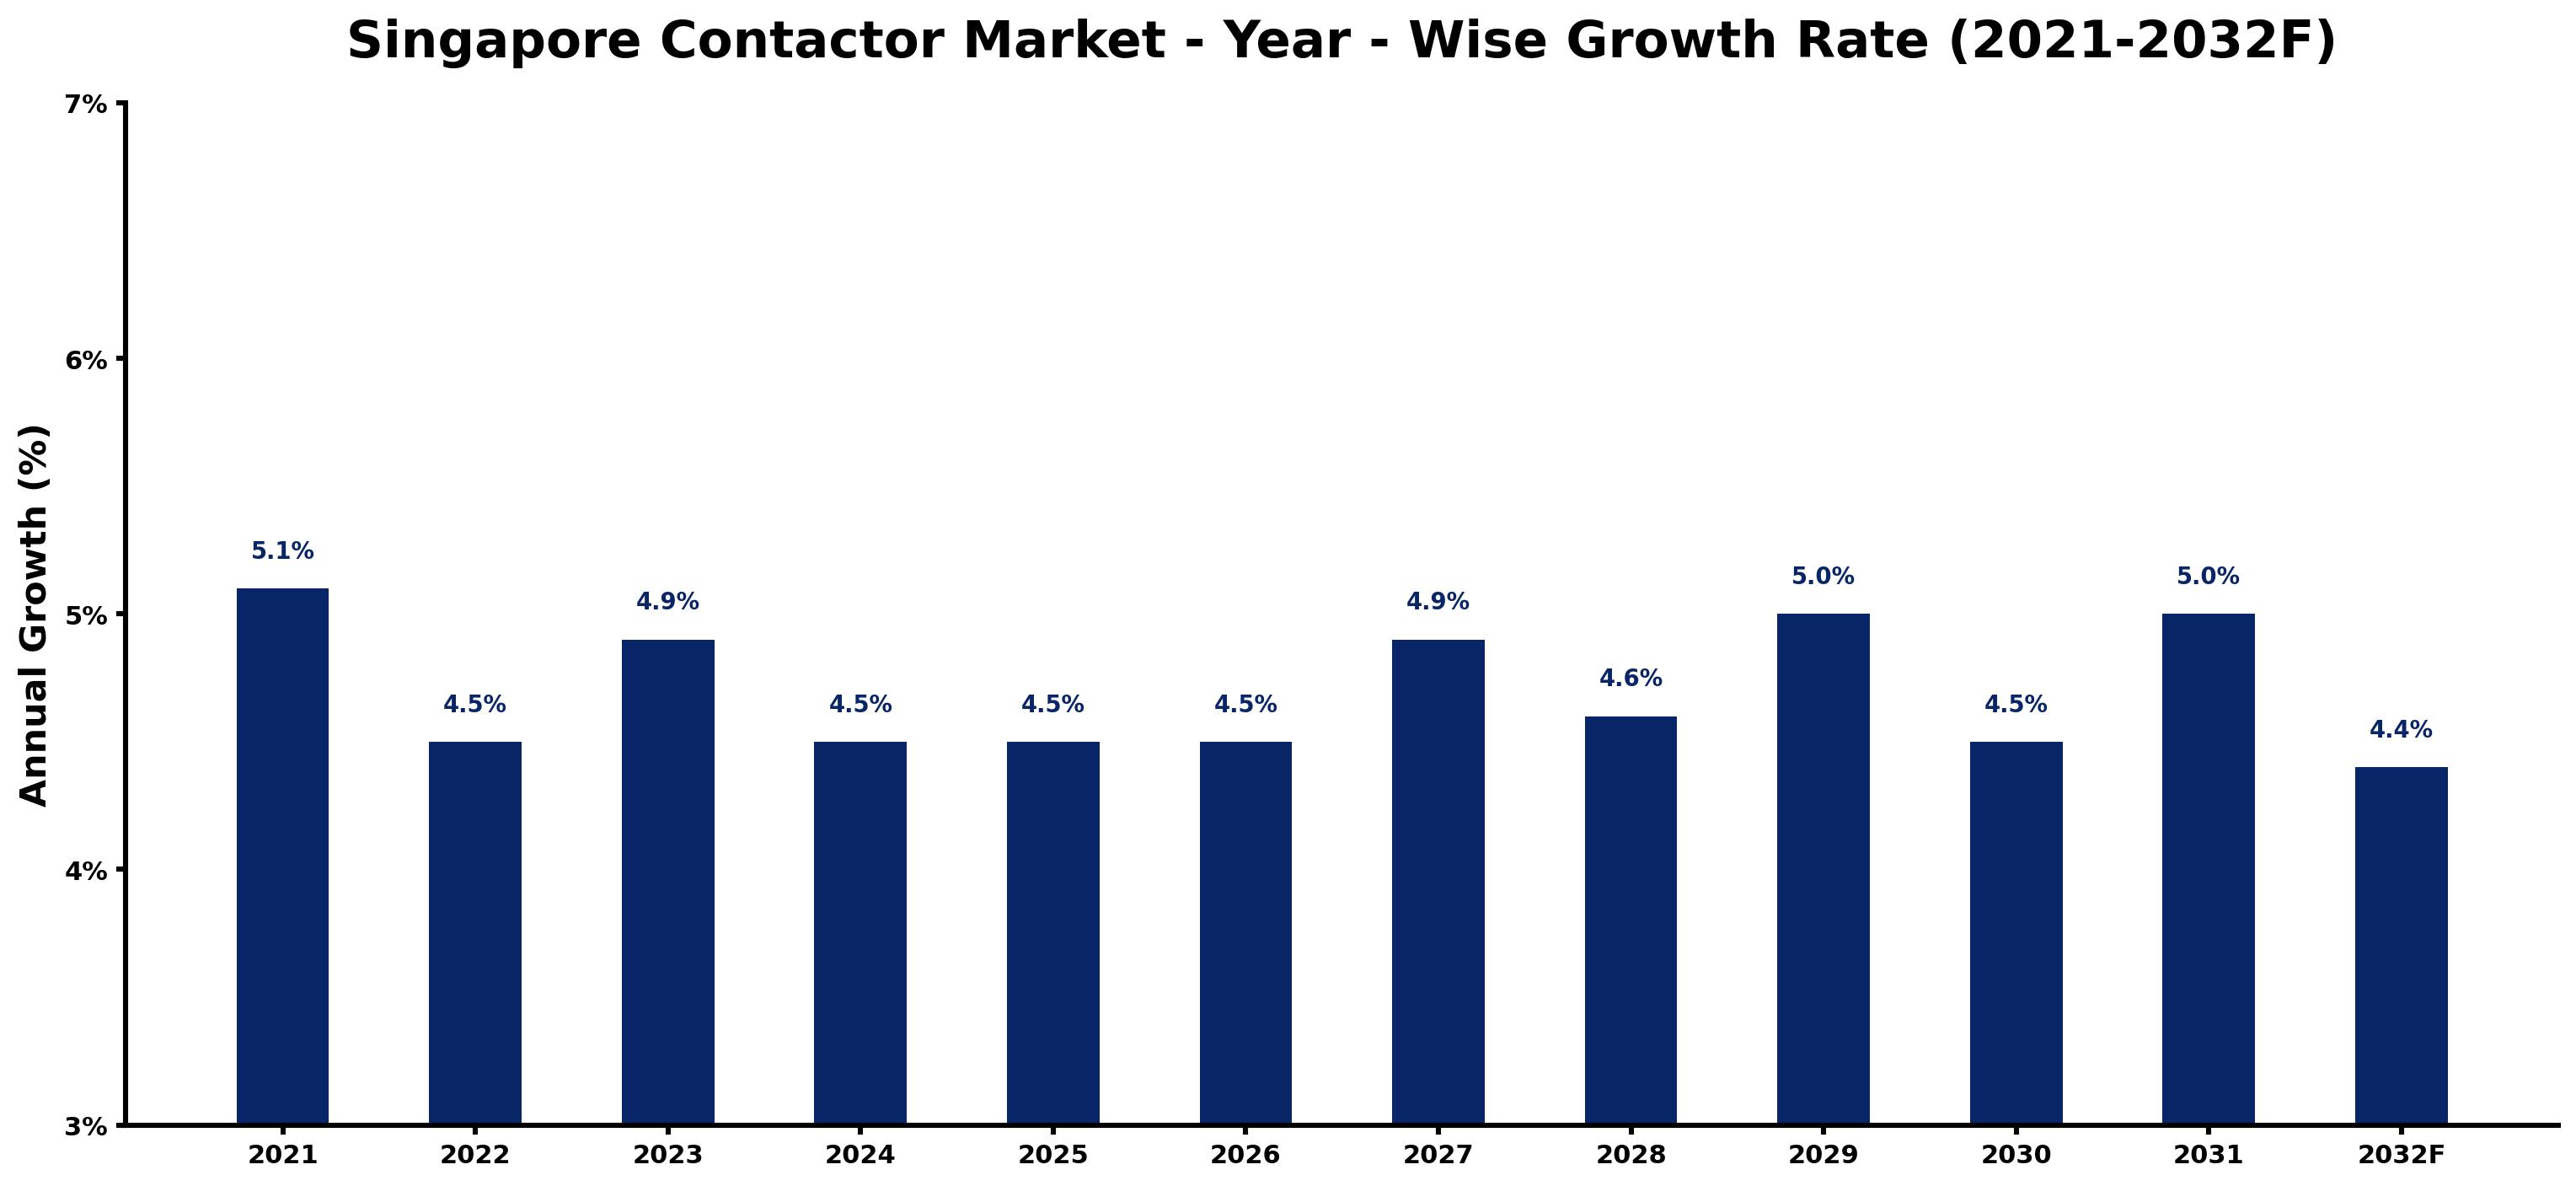
The table below presents the year wise growth rates along with the key drivers influencing the market
| Year | Growth Rate | Major Drivers |
| 2021 | 5.1% | Post-lockdown construction activity led to a revitalization of the contractor sector. |
| 2022 | 4.5% | Enhanced public infrastructure projects attracted more investments into local contractors. |
| 2023 | 4.9% | Emerging sustainability trends demanded innovative solutions from contractors in project delivery. |
| 2024 | 4.5% | Integration of technology in construction processes streamlined project management and efficiency. |
| 2025 | 4.5% | An increase in urbanization shifted focus towards residential contractor opportunities in Singapore. |
| 2026 | 4.5% | Labor shortages prompted contractors to invest in automation and skilled training programs. |
| 2027 | 4.9% | Collaborations between public and private sectors initiated large-scale development projects. |
| 2028 | 4.6% | Economic diversification efforts fostered new niches for contractors in green building practices. |
| 2029 | 5.0% | Digital transformation in the construction sector improved bidding processes and project transparency. |
| 2030 | 4.5% | Evolving client expectations pushed contractors to embrace sustainable design and materials. |
| 2031 | 5.0% | The emphasis on smart city developments opened diverse project avenues for contractors. |
| 2032 | 4.4% | Investments in R&D drove contractors towards innovative construction methodologies and practices. |
Note - Market size estimations and growth projections presented in this report are based on 6Wresearch's advanced forecasting approach, validated with industry datasets as of June 2026.
Singapore Contactor Market Synopsis
The Singapore Contactor Market is projected to reach 4.5% and witness significant growth during the forecast period (2026-2032). The market is poised for expansion, driven principally by the increasing demand for energy-efficient solutions and the rising incorporation of smart lighting technologies across various sectors. The push for greener alternatives has made contactors integral to industrial automation, consumer electronics, and automotive applications.
Singapore Contactor Market Growth Drivers
The growth of the Singapore contactor market can be attributed to several key drivers:
- Increasing demand for energy-efficient solutions, as both consumers and industries prioritise sustainability.
- A significant rise in industrial automation, requiring advanced control mechanisms that utilize contactors for optimal performance.
- Government initiatives aimed at enhancing energy infrastructure and promoting the adoption of smart technologies.
- Growth in the consumer electronics sector, where contactors play a critical role in developing innovative products.
- Automotive sector advancements, particularly in electric vehicles, which necessitate the use of efficient control systems and components.
Singapore Contactor Market Trends and Opportunities
The Singapore contactor market is witnessing notable trends that present various opportunities for growth:
- A transition towards smart home technologies is creating new avenues for contactor applications in residential sectors.
- The growth of the Internet of Things (IoT) is pushing manufacturers to innovate contactor solutions that can seamlessly integrate into connected environments.
- Investments in renewable energy sources are generating demand for contactors that can manage energy distribution efficiently.
- Emerging trends in automation across manufacturing processes are driving the need for reliable control systems, enhancing the relevance of contactors.
- Innovations in materials and design are leading to the development of more compact and efficient contactors, appealing to various industries.
Singapore Contactor Market Challenges and Restraints
Despite the promising outlook, the Singapore contactor market is not without challenges:
- The high cost of advanced contactor technology can hinder adoption among smaller businesses.
- Rapid technological changes necessitate continuous innovation, which can strain resources and focus for manufacturers.
- Supply chain disruptions can impact the availability of essential materials and components required for contactor production.
- Increasing competition from alternative technologies may pose a threat to traditional contactor solutions.
- Regulatory changes related to energy efficiency standards could create additional compliance costs for manufacturers.
Singapore Contactor Market Government Investment and Initiatives
The Singapore government has been proactive in fostering an environment conducive to the growth of the contactor market. Key initiatives include:
- Investment in infrastructure projects that incorporate modern electrical systems, which increases the demand for contactors.
- Incentives for research and development in energy-efficient technologies, encouraging innovation within the market.
- Public spending on industry upgrades, focusing on automation and smart technologies that utilize contactors.
- Promotion of public-private partnerships to advance smart city initiatives, indirectly boosting contactor application demands.
- Regulatory support enhancing energy efficiency across sectors, prompting the adoption of advanced control systems.
Singapore Contactor Market Latest Developments (May 2025 - June 2026)
Recent developments in the Singapore contactor market reflect a dynamic and evolving landscape:
- The introduction of new energy-efficient contactor designs has started transforming how industries manage their electrical systems.
- Collaborations between technology firms have accelerated the development of smart contactors that integrate seamlessly with IoT platforms.
- Regulatory frameworks have been updated to align with global energy efficiency standards, influencing manufacturers to adapt.
- The market has seen increased advocacy for sustainable solutions, encouraging a shift to contactors that minimize environmental impact.
- Emerging trends in automation across various sectors have influenced investments in contactor technology, leading to enhanced product offerings.
Singapore Contactor Market - Key Attractiveness of the Report
- 10 Years of Market Numbers
- Historical Data Starting from 2022 to 2025
- Base Year: 2025
- Forecast Data until 2032
- Key Performance Indicators Impacting the Market
- Major Upcoming Developments and Projects
Key Highlights of the Report:
- Singapore Contactor Market Outlook
- Market Size of Singapore Contactor Market, 2025
- Forecast of Singapore Contactor Market, 2032F
- Historical Data and Forecast of Singapore Contactor Revenues & Volume for the Period 2022-2032F
- Singapore Contactor Market Trend Evolution
- Singapore Contactor Market Drivers and Challenges
- Singapore Contactor Price Trends
- Singapore Contactor Porter's Five Forces
- Singapore Contactor Industry Life Cycle
- Historical Data and Forecast of Singapore Contactor Market Revenues & Volume By Type for the Period 2022-2032F
- Historical Data and Forecast of Singapore Contactor Market Revenues & Volume By Solid-State Contactor for the Period 2022-2032F
- Historical Data and Forecast of Singapore Contactor Market Revenues & Volume By Magnetic Contactor for the Period 2022-2032F
- Historical Data and Forecast of Singapore Contactor Market Revenues & Volume By Vacuum Contactor for the Period 2022-2032F
- Historical Data and Forecast of Singapore Contactor Market Revenues & Volume By Lighting Contactor for the Period 2022-2032F
- Historical Data and Forecast of Singapore Contactor Market Revenues & Volume By Product for the Period 2022-2032F
- Historical Data and Forecast of Singapore Contactor Market Revenues & Volume By DC Contactor for the Period 2022-2032F
- Historical Data and Forecast of Singapore Contactor Market Revenues & Volume By AC Contactor for the Period 2022-2032F
- Historical Data and Forecast of Singapore Contactor Market Revenues & Volume By Poles for the Period 2022-2032F
- Historical Data and Forecast of Singapore Contactor Market Revenues & Volume By 2-Pole for the Period 2022-2032F
- Historical Data and Forecast of Singapore Contactor Market Revenues & Volume By 3-Pole for the Period 2022-2032F
- Historical Data and Forecast of Singapore Contactor Market Revenues & Volume By 4-Pole for the Period 2022-2032F
- Historical Data and Forecast of Singapore Contactor Market Revenues & Volume By Others for the Period 2022-2032F
- Historical Data and Forecast of Singapore Contactor Market Revenues & Volume By Voltage for the Period 2022-2032F
- Historical Data and Forecast of Singapore Contactor Market Revenues & Volume By Low Voltage (Up To 1 KV) for the Period 2022-2032F
- Historical Data and Forecast of Singapore Contactor Market Revenues & Volume By Medium Voltage (1 KV ? 7.2 KV) for the Period 2022-2032F
- Historical Data and Forecast of Singapore Contactor Market Revenues & Volume By High Voltage (Above 7.2 KV) for the Period 2022-2032F
- Historical Data and Forecast of Singapore Contactor Market Revenues & Volume By End-users for the Period 2022-2032F
- Historical Data and Forecast of Singapore Contactor Market Revenues & Volume By Automotive for the Period 2022-2032F
- Historical Data and Forecast of Singapore Contactor Market Revenues & Volume By Power for the Period 2022-2032F
- Historical Data and Forecast of Singapore Contactor Market Revenues & Volume By Oil & Gas for the Period 2022-2032F
- Historical Data and Forecast of Singapore Contactor Market Revenues & Volume By Food & Beverage for the Period 2022-2032F
- Historical Data and Forecast of Singapore Contactor Market Revenues & Volume By Construction for the Period 2022-2032F
- Historical Data and Forecast of Singapore Contactor Market Revenues & Volume By Data Centers for the Period 2022-2032F
- Historical Data and Forecast of Singapore Contactor Market Revenues & Volume By FA Robots for the Period 2022-2032F
- Historical Data and Forecast of Singapore Contactor Market Revenues & Volume By Others for the Period 2022-2032F
- Singapore Contactor Import Export Trade Statistics
- Market Opportunity Assessment By Type
- Market Opportunity Assessment By Product
- Market Opportunity Assessment By Poles
- Market Opportunity Assessment By Voltage
- Market Opportunity Assessment By End-users
- Singapore Contactor Top Companies Market Share
- Singapore Contactor Competitive Benchmarking By Technical and Operational Parameters
- Singapore Contactor Company Profiles
- Singapore Contactor Key Strategic Recommendations
Frequently Asked Questions About the Market Study (FAQs):
The growth is primarily driven by increasing demand for energy-efficient solutions, industrial automation, and smart technologies.
The government is investing in infrastructure, providing incentives for R&D, and promoting regulations that enhance energy efficiency.
Challenges include high technology costs, rapid technological changes, and supply chain disruptions affecting component availability.
Recent developments include new energy-efficient designs, technology collaborations for smart contactors, and updated regulatory frameworks.
6Wresearch actively monitors the Singapore Contactor Market and publishes its comprehensive annual report, highlighting emerging trends, growth drivers, revenue analysis, and forecast outlook. Our insights help businesses to make data-backed strategic decisions with ongoing market dynamics. Our analysts track relevent industries related to the Singapore Contactor Market, allowing our clients with actionable intelligence and reliable forecasts tailored to emerging regional needs.
Yes, we provide customisation as per your requirements. To learn more, feel free to contact us on sales@6wresearch.com
1 Executive Summary |
2 Introduction |
2.1 Key Highlights of the Report |
2.2 Report Description |
2.3 Market Scope & Segmentation |
2.4 Research Methodology |
2.5 Assumptions |
3 Singapore Contactor Market Overview |
3.1 Singapore Country Macro Economic Indicators |
3.2 Singapore Contactor Market Revenues & Volume, 2022 & 2032F |
3.3 Singapore Contactor Market - Industry Life Cycle |
3.4 Singapore Contactor Market - Porter's Five Forces |
3.5 Singapore Contactor Market Revenues & Volume Share, By Type, 2022 & 2032F |
3.6 Singapore Contactor Market Revenues & Volume Share, By Product, 2022 & 2032F |
3.7 Singapore Contactor Market Revenues & Volume Share, By Poles, 2022 & 2032F |
3.8 Singapore Contactor Market Revenues & Volume Share, By Voltage, 2022 & 2032F |
3.9 Singapore Contactor Market Revenues & Volume Share, By End-users, 2022 & 2032F |
4 Singapore Contactor Market Dynamics |
4.1 Impact Analysis |
4.2 Market Drivers |
4.3 Market Restraints |
5 Singapore Contactor Market Trends |
6 Singapore Contactor Market, By Types |
6.1 Singapore Contactor Market, By Type |
6.1.1 Overview and Analysis |
6.1.2 Singapore Contactor Market Revenues & Volume, By Type, 2022-2032F |
6.1.3 Singapore Contactor Market Revenues & Volume, By Solid-State Contactor, 2022-2032F |
6.1.4 Singapore Contactor Market Revenues & Volume, By Magnetic Contactor, 2022-2032F |
6.1.5 Singapore Contactor Market Revenues & Volume, By Vacuum Contactor, 2022-2032F |
6.1.6 Singapore Contactor Market Revenues & Volume, By Lighting Contactor, 2022-2032F |
6.2 Singapore Contactor Market, By Product |
6.2.1 Overview and Analysis |
6.2.2 Singapore Contactor Market Revenues & Volume, By DC Contactor, 2022-2032F |
6.2.3 Singapore Contactor Market Revenues & Volume, By AC Contactor, 2022-2032F |
6.3 Singapore Contactor Market, By Poles |
6.3.1 Overview and Analysis |
6.3.2 Singapore Contactor Market Revenues & Volume, By 2-Pole, 2022-2032F |
6.3.3 Singapore Contactor Market Revenues & Volume, By 3-Pole, 2022-2032F |
6.3.4 Singapore Contactor Market Revenues & Volume, By 4-Pole, 2022-2032F |
6.3.5 Singapore Contactor Market Revenues & Volume, By Others, 2022-2032F |
6.4 Singapore Contactor Market, By Voltage |
6.4.1 Overview and Analysis |
6.4.2 Singapore Contactor Market Revenues & Volume, By Low Voltage (Up To 1 KV), 2022-2032F |
6.4.3 Singapore Contactor Market Revenues & Volume, By Medium Voltage (1 KV ? 7.2 KV), 2022-2032F |
6.4.4 Singapore Contactor Market Revenues & Volume, By High Voltage (Above 7.2 KV), 2022-2032F |
6.5 Singapore Contactor Market, By End-users |
6.5.1 Overview and Analysis |
6.5.2 Singapore Contactor Market Revenues & Volume, By Automotive, 2022-2032F |
6.5.3 Singapore Contactor Market Revenues & Volume, By Power, 2022-2032F |
6.5.4 Singapore Contactor Market Revenues & Volume, By Oil & Gas, 2022-2032F |
6.5.5 Singapore Contactor Market Revenues & Volume, By Food & Beverage, 2022-2032F |
6.5.6 Singapore Contactor Market Revenues & Volume, By Construction, 2022-2032F |
6.5.7 Singapore Contactor Market Revenues & Volume, By Data Centers, 2022-2032F |
6.5.8 Singapore Contactor Market Revenues & Volume, By Others, 2022-2032F |
6.5.9 Singapore Contactor Market Revenues & Volume, By Others, 2022-2032F |
7 Singapore Contactor Market Import-Export Trade Statistics |
7.1 Singapore Contactor Market Export to Major Countries |
7.2 Singapore Contactor Market Imports from Major Countries |
8 Singapore Contactor Market Key Performance Indicators |
9 Singapore Contactor Market - Opportunity Assessment |
9.1 Singapore Contactor Market Opportunity Assessment, By Type, 2022 & 2032F |
9.2 Singapore Contactor Market Opportunity Assessment, By Product, 2022 & 2032F |
9.3 Singapore Contactor Market Opportunity Assessment, By Poles, 2022 & 2032F |
9.4 Singapore Contactor Market Opportunity Assessment, By Voltage, 2022 & 2032F |
9.5 Singapore Contactor Market Opportunity Assessment, By End-users, 2022 & 2032F |
10 Singapore Contactor Market - Competitive Landscape |
10.1 Singapore Contactor Market Revenue Share, By Companies, 2025 |
10.2 Singapore Contactor Market Competitive Benchmarking, By Operating and Technical Parameters |
11 Company Profiles |
12 Recommendations |
13 Disclaimer |
Global Go To Market Strategy - 2030
Export potential enables firms to identify high-growth global markets with greater confidence by combining advanced trade intelligence with a structured quantitative methodology. The framework analyzes emerging demand trends and country-level import patterns while integrating macroeconomic and trade datasets such as GDP and population forecasts, bilateral import–export flows, tariff structures, elasticity differentials between developed and developing economies, geographic distance, and import demand projections. Using weighted trade values from 2020–2024 as the base period to project country-to-country export potential for 2030, these inputs are operationalized through calculated drivers such as gravity model parameters, tariff impact factors, and projected GDP per-capita growth. Through an analysis of hidden potentials, demand hotspots, and market conditions that are most favorable to success, this method enables firms to focus on target countries, maximize returns, and global expansion with data, backed by accuracy.
By factoring in the projected importer demand gap that is currently unmet and could be potential opportunity, it identifies the potential for the Exporter (Country) among 190 countries, against the general trade analysis, which identifies the biggest importer or exporter.
To discover high-growth global markets and optimize your business strategy:
Click Here
Pricing
- Single User License$ 1,995
- Department License$ 2,400
- Site License$ 3,120
- Global License$ 3,795

Leadership Perspectives from Industry Events
Search
Thought Leadership and Analyst Meet


Our Clients
6WResearch In News
- India Air Conditioner Market Set for Strong Rebound in 2026 After Weather-Led Correction and GST-Driven Recovery: 6Wresearch
- ADAS in India: How Automatic Emergency Braking, Blind Spot Detection & Driver Monitoring are Transforming Road Safety
- Doha a strategic location for EV manufacturing hub: IPA Qatar
- Demand for luxury TVs surging in the GCC, says Samsung
- Empowering Growth: The Thriving Journey of Bangladesh’s Cable Industry
- Demand for luxury TVs surging in the GCC, says Samsung
Latest Reports
- Nicaragua RPG Gaming Market (2026-2032)
- New Zealand RPG Gaming Market (2026-2032)
- Netherlands RPG Gaming Market (2026-2032)
- Nauru RPG Gaming Market (2026-2032)
- Namibia RPG Gaming Market (2026-2032)
- Mozambique RPG Gaming Market (2026-2032)
- Montenegro RPG Gaming Market (2026-2032)
- Mongolia RPG Gaming Market (2026-2032)
- Monaco RPG Gaming Market (2026-2032)
- Micronesia RPG Gaming Market (2026-2032)
Industry Events and Analyst Meet

HIMTEX 2026

India Refining Summit 2026

India EV Show 2026

EV tech India Expo 2026

Auto Tech Asia 2026
Whitepaper
- Middle East & Africa Commercial Security Market Click here to view more.
- Middle East & Africa Fire Safety Systems & Equipment Market Click here to view more.
- GCC Drone Market Click here to view more.
- Middle East Lighting Fixture Market Click here to view more.
- GCC Physical & Perimeter Security Market Click here to view more.