Singapore Electronic Navigational Charts Market (2026-2032) Outlook | Size, Revenue, Forecast, Companies, Industry, Value, Trends, Growth, Analysis & Share
Market Forecast By Component (Hardware, Software, Services), By Application (Aviation, Marine, Others) And Competitive Landscape
| Product Code: ETC211599 | Publication Date: May 2022 | Updated Date: Jul 2026 | Product Type: Market Research Report | |
| Publisher: 6Wresearch | Author: Ravi Bhandari | No. of Pages: 60 | No. of Figures: 40 | No. of Tables: 7 |
Singapore Electronic Navigational Charts Market Size, Share & Growth Rate
The Singapore Electronic Navigational Charts Market was estimated at USD 1495 Million in 2025 and is projected to reach USD 2176 Million by 2032, growing at a CAGR of 5.5% from 2026 to 2032. This growth trajectory is primarily driven by the increasing demand for precise navigation solutions in Singapore's bustling maritime landscape, where safety and efficiency are paramount. The rise in technological advancements, particularly in real-time data integration and advanced route planning functionalities, further underscores the market's potential for expansion.
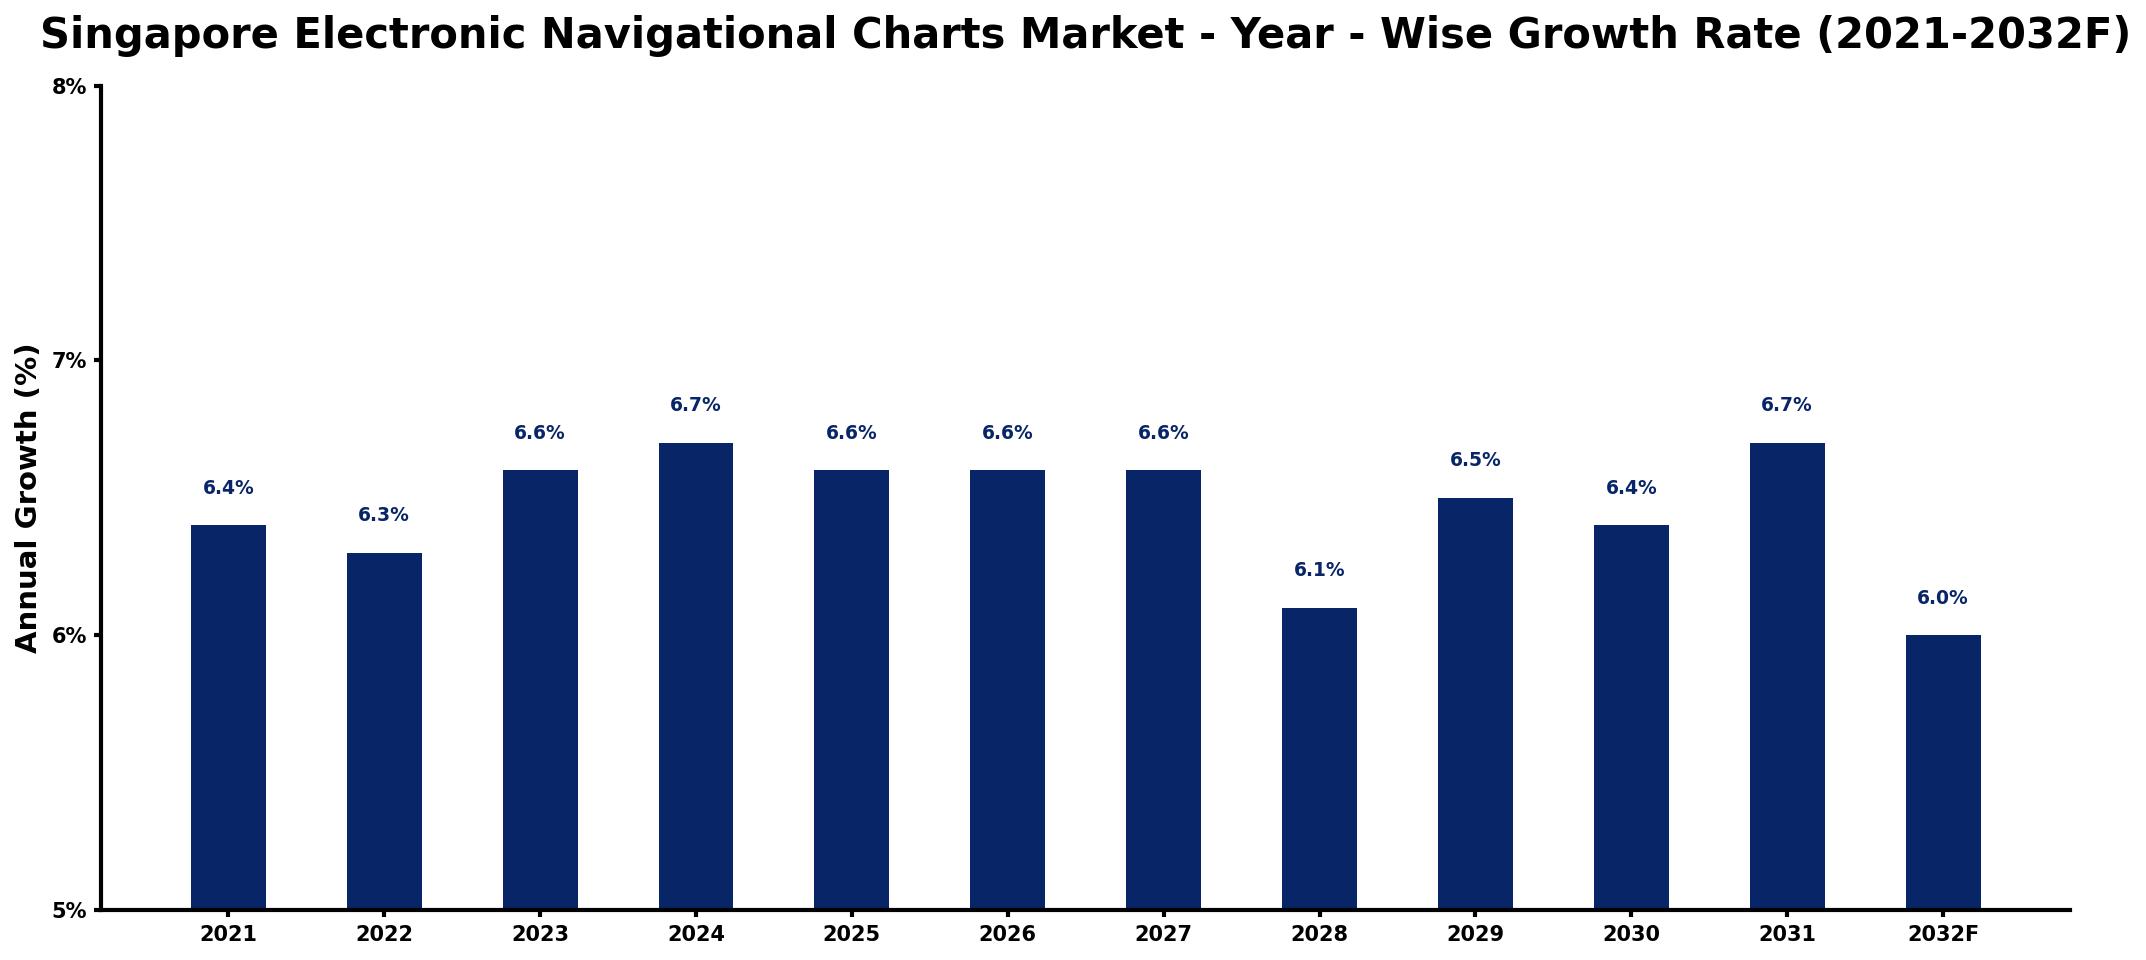
Singapore Electronic Navigational Charts Market Growth Rate Analysis (2021-2032)
The Singapore Electronic Navigational Charts market experienced stable growth, highlighted by a 6.4% rise in 2021, tapering slightly to 6.3% in 2022, before rebounding to 6.6% in 2023. This upward trend can be attributed to increasing maritime traffic and government investments in digital infrastructure, enhancing navigational safety and efficiency. As consumer demand for precise navigation solutions continues, growth is projected to maintain a steady pace, with rates around 6.6% expected from 2024 to 2027. Fluctuations in growth, notably the dip to 6.1% in 2028, can be linked to temporary market adjustments. However, the forecast retains strength, with 6.7% in 2031 driven by ongoing digitalization efforts in the maritime sector.
Singapore Electronic Navigational Charts Market Year-wise Growth Rate and Key Drivers
This graph highlights how the Singapore Electronic Navigational Charts Market has steadily grown over the past five years, supported by major growth factors.
The table below presents the year‑wise growth rates along with the key drivers influencing the market
| Year | Growth Rate | Major Drivers |
| 2021 | 6.4% | Increased maritime safety regulations |
| 2022 | 6.3% | Growing demand for digital solutions |
| 2023 | 6.6% | Expansion of shipping logistics services |
| 2024 | 6.7% | Rising investments in maritime technology |
| 2025 | 6.6% | Enhanced training for navigation professionals |
| 2026 | 6.6% | Development of smart shipping systems |
| 2027 | 6.6% | Integration of AI in navigation |
| 2028 | 6.1% | Emergence of eco-friendly shipping practices |
| 2029 | 6.5% | Increase in international trade activities |
| 2030 | 6.4% | Advancements in satellite positioning systems |
| 2031 | 6.7% | Strengthened partnerships in maritime sector |
| 2032 | 6.0% | Focus on sustainable navigation solutions |
Note: Market size estimations and growth projections presented in this report are based on 6Wresearch's proprietary forecasting methodology, utilizing the latest available industry data, government publications, and primary research inputs.
Singapore Electronic Navigational Charts Market Synopsis
The transition from traditional paper charts to electronic navigational charts (ENC) is the most significant force reshaping the Singapore market today. This shift is not only about modernization; it is essential for ensuring safe navigation in the countrys busy waters, which are frequented by both domestic and international vessels.
As the maritime sector expands, the emphasis on accuracy and the need for timely updates has never been greater. Collaborative efforts between maritime authorities and technology providers aim to enhance the safety and efficiency of navigation, making ENC solutions increasingly indispensable.
Singapore Electronic Navigational Charts Market Key Takeaways
- The market is expected to grow significantly, propelled by demand for enhanced safety in navigation.
- Technological advancements are leading to more integrated and real-time ENC solutions.
- Collaborations between industry players will drive innovation and service offerings.
- The shift toward digital solutions is a fundamental trend that is reshaping maritime operations.
- Government support for maritime safety standards is enhancing the ENC market landscape.
Evaluation of Restraints in Singapore Electronic Navigational Charts Market
Despite its promising growth, the Singapore Electronic Navigational Charts Market grapples with certain restraints. A major concern is the continuous necessity for accurate, up-to-date data, as the integrity of navigational information is crucial for maritime safety. Moreover, smaller companies often find it challenging to bear the costs associated with maintaining and updating electronic charts, which can limit their competitiveness. Cybersecurity threats also pose a significant risk, necessitating robust measures to safeguard critical navigation data. Finally, keeping pace with evolving international regulations can be a complex and resource-intensive endeavor for industry players.
Singapore Electronic Navigational Charts Market Trends
A notable trend in the Singapore Electronic Navigational Charts Market is the integration of artificial intelligence and machine learning technologies to enhance navigation precision and efficiency. Additionally, there is a growing focus on developing user-friendly applications that facilitate easy access to navigational data for both maritime authorities and vessel operators. These trends are driven by the need for greater operational efficiency and safety in a highly regulated maritime environment.
Singapore Electronic Navigational Charts Market Opportunities
The Singapore Electronic Navigational Charts Market presents significant growth and investment opportunities, particularly in the realm of advanced data analytics and predictive modelling. As maritime operations increasingly turn to smart technologies, companies that leverage big data to provide actionable insights will find a competitive edge. Furthermore, the ongoing urbanization of maritime activities opens doors for innovative ENC solutions tailored to specific local needs, such as urban shipping routes and harbor management.
Government Initiatives in the Singapore Electronic Navigational Charts Market
The Singapore government actively promotes the advancement of maritime safety and efficiency through various initiatives. Support for digital transformation in the maritime sector is evident in policies aimed at enhancing navigational standards. Public spending on infrastructure and technology development is designed to ensure that Singapore remains a leading maritime hub. These initiatives not only bolster the local ENC market but also attract international players seeking to align with Singapore's high regulatory standards.
Future Insights of the Singapore Electronic Navigational Charts Market
Looking ahead to 2026-2032, the Singapore Electronic Navigational Charts Market is set to undergo transformative changes fueled by digital innovation. The convergence of advanced technologies, such as cloud computing and real-time data sharing, will enhance the accuracy and functionality of electronic charts. Furthermore, as environmental concerns become more pronounced, the push for sustainable shipping practices will drive demand for sophisticated navigation solutions that optimize route planning and minimize emissions.
Singapore Electronic Navigational Charts Market Latest Developments (2025 - 2026)
In the latest developments, the Singapore Electronic Navigational Charts Market is witnessing a surge in partnerships aimed at integrating more advanced technological solutions. Recent initiatives have focused on enhancing cybersecurity measures and establishing standards for data sharing between international maritime entities. Additionally, the sector is seeing increased investment in research and development to further innovate ENC functionalities that meet the evolving needs of the maritime community.
Singapore Electronic Navigational Charts Market - Key Attractiveness of the Report
- 10 Years of Market Numbers
- Historical Data Starting from 2022 to 2025
- Base Year: 2025
- Forecast Data until 2032
- Key Performance Indicators Impacting the Market
- Major Upcoming Developments and Projects
Key Highlights of the Report:
- Singapore Electronic Navigational Charts Market Outlook
- Market Size of Singapore Electronic Navigational Charts Market, 2025
- Forecast of Singapore Electronic Navigational Charts Market, 2032
- Historical Data and Forecast of Singapore Electronic Navigational Charts Revenues & Volume for the Period 2022-2032F
- Singapore Electronic Navigational Charts Market Trend Evolution
- Singapore Electronic Navigational Charts Market Drivers and Challenges
- Singapore Electronic Navigational Charts Price Trends
- Singapore Electronic Navigational Charts Porter's Five Forces
- Singapore Electronic Navigational Charts Industry Life Cycle
- Historical Data and Forecast of Singapore Electronic Navigational Charts Market Revenues & Volume By Component for the Period 2022-2032F
- Historical Data and Forecast of Singapore Electronic Navigational Charts Market Revenues & Volume By Hardware for the Period 2022-2032F
- Historical Data and Forecast of Singapore Electronic Navigational Charts Market Revenues & Volume By Software for the Period 2022-2032F
- Historical Data and Forecast of Singapore Electronic Navigational Charts Market Revenues & Volume By Services for the Period 2022-2032F
- Historical Data and Forecast of Singapore Electronic Navigational Charts Market Revenues & Volume By Application for the Period 2022-2032F
- Historical Data and Forecast of Singapore Electronic Navigational Charts Market Revenues & Volume By Aviation for the Period 2022-2032F
- Historical Data and Forecast of Singapore Electronic Navigational Charts Market Revenues & Volume By Marine for the Period 2022-2032F
- Historical Data and Forecast of Singapore Electronic Navigational Charts Market Revenues & Volume By Others for the Period 2022-2032F
- Singapore Electronic Navigational Charts Import Export Trade Statistics
- Market Opportunity Assessment By Component
- Market Opportunity Assessment By Application
- Singapore Electronic Navigational Charts Top Companies Market Share
- Singapore Electronic Navigational Charts Competitive Benchmarking By Technical and Operational Parameters
- Singapore Electronic Navigational Charts Company Profiles
- Singapore Electronic Navigational Charts Key Strategic Recommendations
Frequently Asked Questions About the Market Study (FAQs):
The primary drivers include the increasing need for safety in navigation, advancements in technology that enhance chart accuracy, and the ongoing push for digitalization in maritime operations.
The pandemic underscored the importance of reliable navigational data, stabilizing demand as companies focused on ensuring safety and minimizing disruptions in supply chains.
The market is projected to reach USD 2176 Million by 2032, reflecting a compound annual growth rate of 5.5% from 2026 to 2032.
Current trends include the integration of AI and machine learning to optimize navigation processes and enhance the user experience with intuitive applications.
New entrants can capitalize on the demand for innovative data analytics solutions and tailor-made ENC services that cater to local maritime needs.
6Wresearch actively monitors the Singapore Electronic Navigational Charts Market and publishes its comprehensive annual report, highlighting emerging trends, growth drivers, revenue analysis, and forecast outlook. Our insights help businesses to make data-backed strategic decisions with ongoing market dynamics. Our analysts track relevent industries related to the Singapore Electronic Navigational Charts Market, allowing our clients with actionable intelligence and reliable forecasts tailored to emerging regional needs.
Yes, we provide customisation as per your requirements. To learn more, feel free to contact us on sales@6wresearch.com
1 Executive Summary |
2 Introduction |
2.1 Key Highlights of the Report |
2.2 Report Description |
2.3 Market Scope & Segmentation |
2.4 Research Methodology |
2.5 Assumptions |
3 Singapore Electronic Navigational Charts Market Overview |
3.1 Singapore Country Macro Economic Indicators |
3.2 Singapore Electronic Navigational Charts Market Revenues & Volume, 2022 & 2032F |
3.3 Singapore Electronic Navigational Charts Market - Industry Life Cycle |
3.4 Singapore Electronic Navigational Charts Market - Porter's Five Forces |
3.5 Singapore Electronic Navigational Charts Market Revenues & Volume Share, By Component, 2022 & 2032F |
3.6 Singapore Electronic Navigational Charts Market Revenues & Volume Share, By Application, 2022 & 2032F |
4 Singapore Electronic Navigational Charts Market Dynamics |
4.1 Impact Analysis |
4.2 Market Drivers |
4.2.1 Increasing demand for accurate and up-to-date navigational information due to growing maritime activities in Singapore. |
4.2.2 Regulatory requirements mandating the use of electronic navigational charts for safety and efficiency. |
4.2.3 Technological advancements in GIS (Geographic Information System) and navigation technologies driving the adoption of electronic navigational charts. |
4.3 Market Restraints |
4.3.1 High initial investment costs associated with the procurement and implementation of electronic navigational charts. |
4.3.2 Concerns regarding data accuracy and reliability of electronic navigational charts. |
4.3.3 Resistance to change from traditional paper charts to digital formats among some users. |
5 Singapore Electronic Navigational Charts Market Trends |
6 Singapore Electronic Navigational Charts Market, By Types |
6.1 Singapore Electronic Navigational Charts Market, By Component |
6.1.1 Overview and Analysis |
6.1.2 Singapore Electronic Navigational Charts Market Revenues & Volume, By Component, 2022-2032F |
6.1.3 Singapore Electronic Navigational Charts Market Revenues & Volume, By Hardware, 2022-2032F |
6.1.4 Singapore Electronic Navigational Charts Market Revenues & Volume, By Software, 2022-2032F |
6.1.5 Singapore Electronic Navigational Charts Market Revenues & Volume, By Services, 2022-2032F |
6.2 Singapore Electronic Navigational Charts Market, By Application |
6.2.1 Overview and Analysis |
6.2.2 Singapore Electronic Navigational Charts Market Revenues & Volume, By Aviation, 2022-2032F |
6.2.3 Singapore Electronic Navigational Charts Market Revenues & Volume, By Marine, 2022-2032F |
6.2.4 Singapore Electronic Navigational Charts Market Revenues & Volume, By Others, 2022-2032F |
7 Singapore Electronic Navigational Charts Market Import-Export Trade Statistics |
7.1 Singapore Electronic Navigational Charts Market Export to Major Countries |
7.2 Singapore Electronic Navigational Charts Market Imports from Major Countries |
8 Singapore Electronic Navigational Charts Market Key Performance Indicators |
8.1 Percentage increase in the adoption rate of electronic navigational charts among Singaporean maritime companies. |
8.2 Average time saved in route planning and navigation using electronic navigational charts compared to traditional methods. |
8.3 Number of reported safety incidents or navigational errors before and after the implementation of electronic navigational charts. |
9 Singapore Electronic Navigational Charts Market - Opportunity Assessment |
9.1 Singapore Electronic Navigational Charts Market Opportunity Assessment, By Component, 2022 & 2032F |
9.2 Singapore Electronic Navigational Charts Market Opportunity Assessment, By Application, 2022 & 2032F |
10 Singapore Electronic Navigational Charts Market - Competitive Landscape |
10.1 Singapore Electronic Navigational Charts Market Revenue Share, By Companies, 2025 |
10.2 Singapore Electronic Navigational Charts Market Competitive Benchmarking, By Operating and Technical Parameters |
11 Company Profiles |
12 Recommendations |
13 Disclaimer |
Global Go To Market Strategy - 2030
Export potential enables firms to identify high-growth global markets with greater confidence by combining advanced trade intelligence with a structured quantitative methodology. The framework analyzes emerging demand trends and country-level import patterns while integrating macroeconomic and trade datasets such as GDP and population forecasts, bilateral import–export flows, tariff structures, elasticity differentials between developed and developing economies, geographic distance, and import demand projections. Using weighted trade values from 2020–2024 as the base period to project country-to-country export potential for 2030, these inputs are operationalized through calculated drivers such as gravity model parameters, tariff impact factors, and projected GDP per-capita growth. Through an analysis of hidden potentials, demand hotspots, and market conditions that are most favorable to success, this method enables firms to focus on target countries, maximize returns, and global expansion with data, backed by accuracy.
By factoring in the projected importer demand gap that is currently unmet and could be potential opportunity, it identifies the potential for the Exporter (Country) among 190 countries, against the general trade analysis, which identifies the biggest importer or exporter.
To discover high-growth global markets and optimize your business strategy:
Click Here
Pricing
- Single User License$ 1,995
- Department License$ 2,400
- Site License$ 3,120
- Global License$ 3,795

Leadership Perspectives from Industry Events
Search
Thought Leadership and Analyst Meet


Our Clients
6WResearch In News
- India Air Conditioner Market Set for Strong Rebound in 2026 After Weather-Led Correction and GST-Driven Recovery: 6Wresearch
- ADAS in India: How Automatic Emergency Braking, Blind Spot Detection & Driver Monitoring are Transforming Road Safety
- Doha a strategic location for EV manufacturing hub: IPA Qatar
- Demand for luxury TVs surging in the GCC, says Samsung
- Empowering Growth: The Thriving Journey of Bangladesh’s Cable Industry
- Demand for luxury TVs surging in the GCC, says Samsung
Latest Reports
- Nicaragua RPG Gaming Market (2026-2032)
- New Zealand RPG Gaming Market (2026-2032)
- Netherlands RPG Gaming Market (2026-2032)
- Nauru RPG Gaming Market (2026-2032)
- Namibia RPG Gaming Market (2026-2032)
- Mozambique RPG Gaming Market (2026-2032)
- Montenegro RPG Gaming Market (2026-2032)
- Mongolia RPG Gaming Market (2026-2032)
- Monaco RPG Gaming Market (2026-2032)
- Micronesia RPG Gaming Market (2026-2032)
Industry Events and Analyst Meet

HIMTEX 2026

India Refining Summit 2026

India EV Show 2026

EV tech India Expo 2026

Auto Tech Asia 2026
Whitepaper
- Middle East & Africa Commercial Security Market Click here to view more.
- Middle East & Africa Fire Safety Systems & Equipment Market Click here to view more.
- GCC Drone Market Click here to view more.
- Middle East Lighting Fixture Market Click here to view more.
- GCC Physical & Perimeter Security Market Click here to view more.