Singapore Electronic parts Market (2026-2032) | Share, Revenue, Forecast, Trends, Growth, Size, Companies, Outlook, Industry, Value & Analysis
Market Forecast By Type (Passive, Active, Electro Mechanic), By Application (Automotive, Communications, Computing Applications, Others) And Competitive Landscape
| Product Code: ETC035567 | Publication Date: Jul 2023 | Updated Date: Jun 2026 | Product Type: Report | |
| Publisher: 6Wresearch | Author: Ravi Bhandari | No. of Pages: 70 | No. of Figures: 35 | No. of Tables: 5 |
Singapore Electronic parts Market Summary
The singapore electronic parts market was estimated at USD 306 Million in 2025 and is projected to reach USD 403 Million by 2032, growing at a CAGR of 4.6% from 2026 to 2032.
Singapore Electronic parts Market Year-wise Growth Rate and Key Drivers
This graph highlights how the Singapore Electronic parts Market has steadily grown over the past five years, supported by major growth factors.
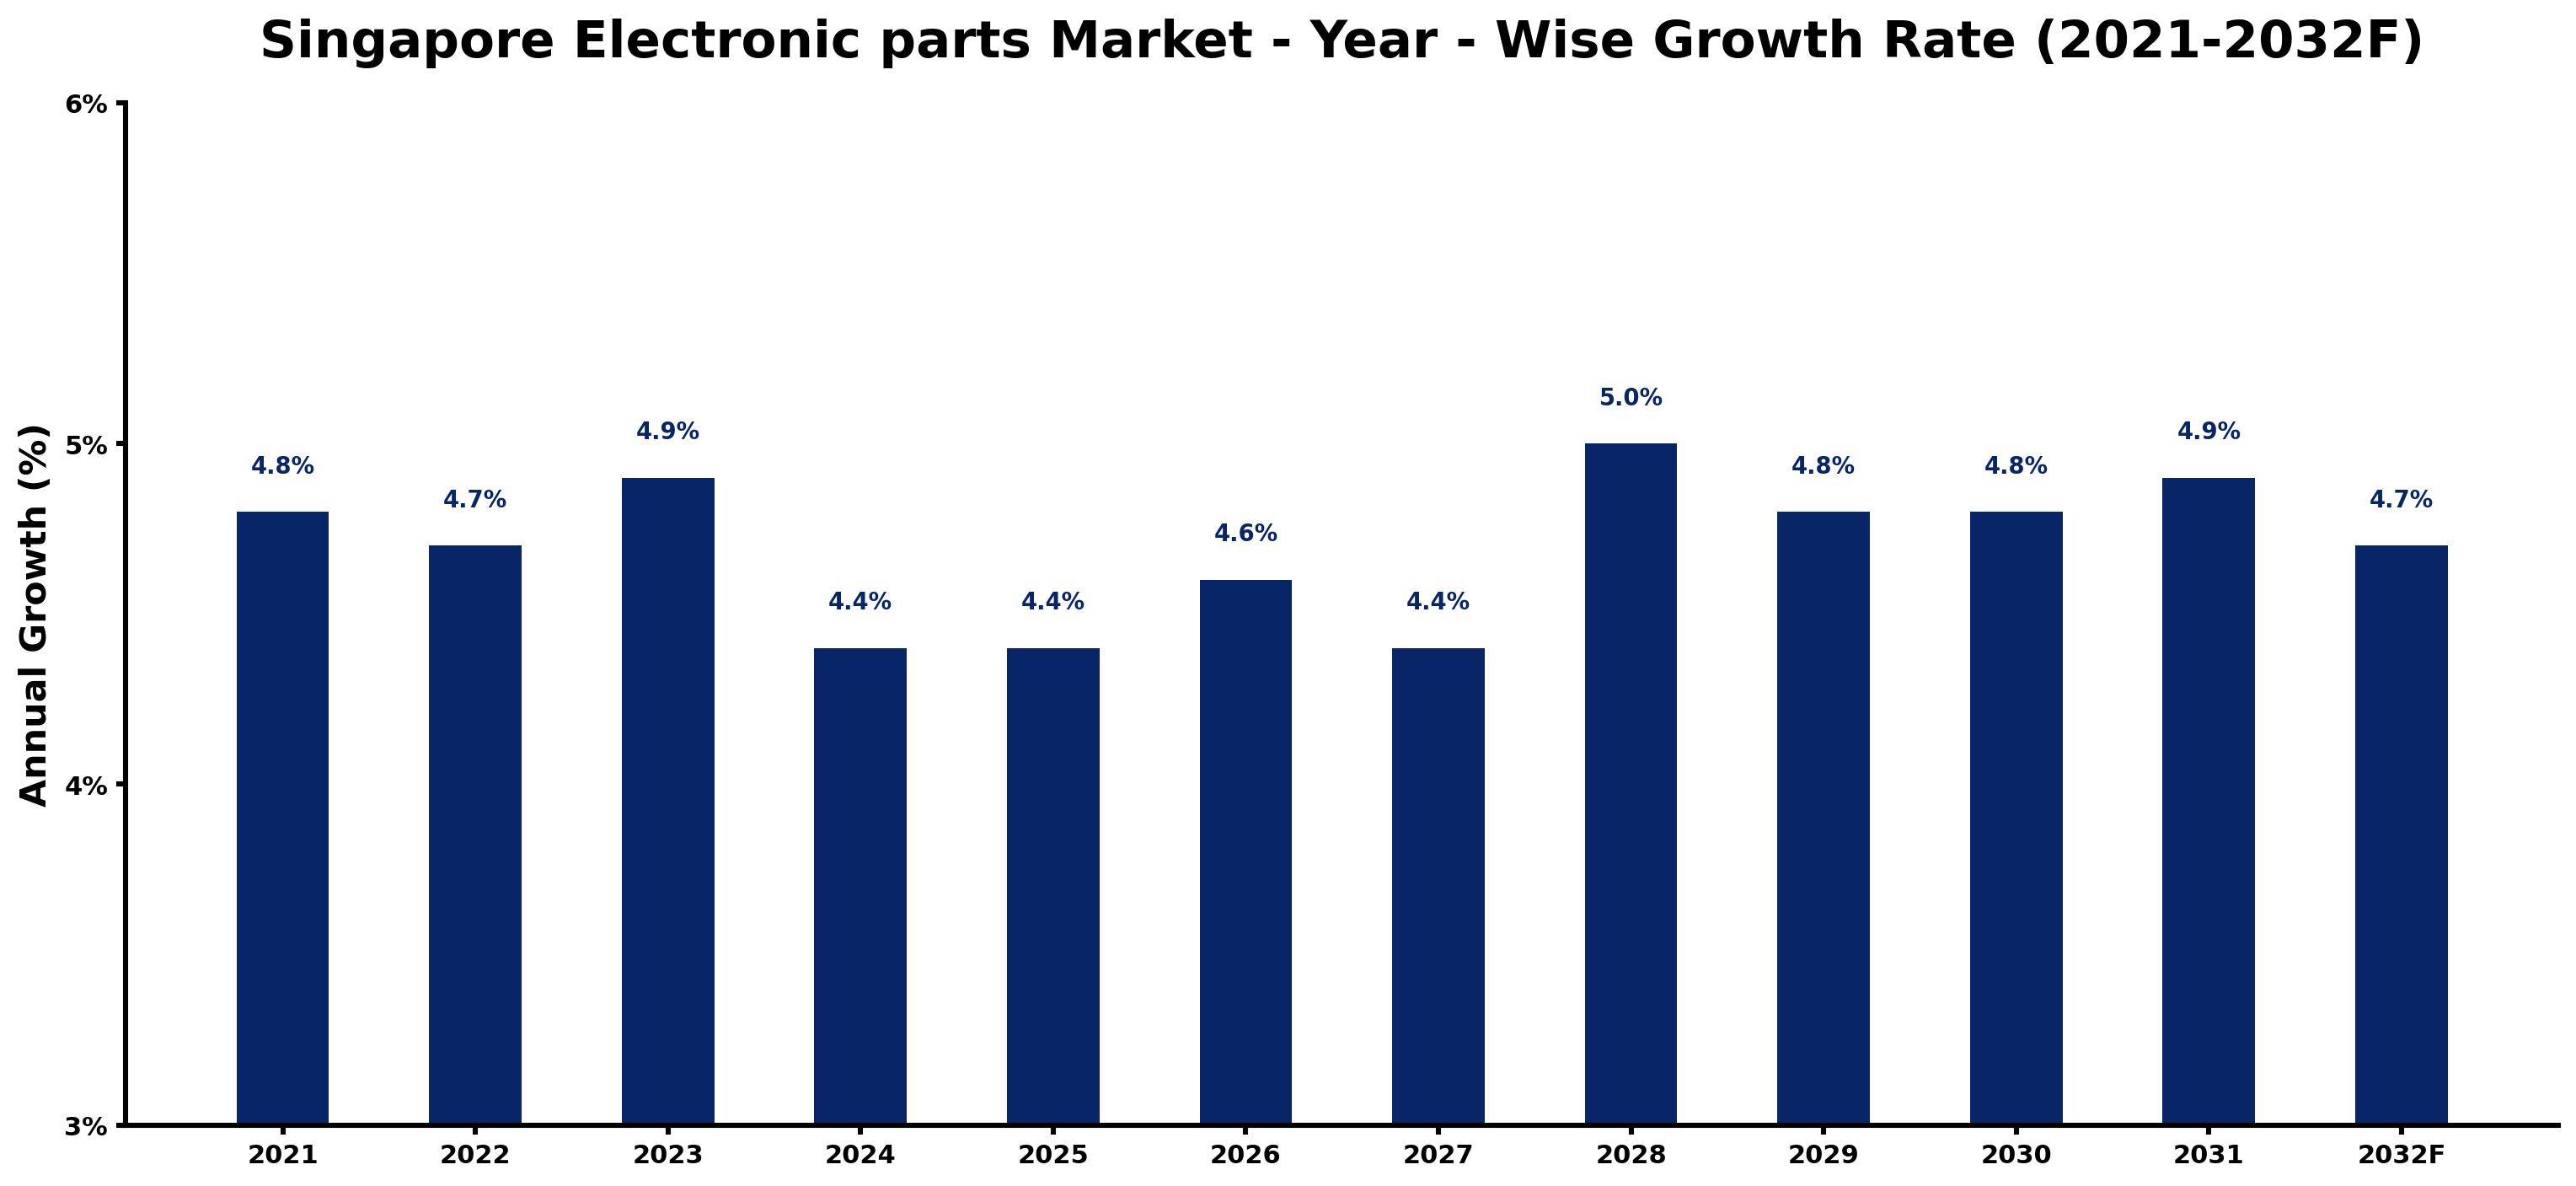
The table below presents the year wise growth rates along with the key drivers influencing the market
| Year | Growth Rate | Major Drivers |
| 2021 | 4.8% | Post-lockdown retail projects sparked renewed interest in consumer electronics demand. |
| 2022 | 4.7% | Technological innovations in IoT devices pushed component requirements higher than previous years. |
| 2023 | 4.9% | Evolving smart city initiatives highlighted the need for advanced electronic infrastructure. |
| 2024 | 4.4% | Manufacturers sought local sourcing to mitigate supply chain vulnerabilities experienced during COVID. |
| 2025 | 4.4% | Increased investment in electric vehicles created demand for specialized electronic components. |
| 2026 | 4.6% | Consumer preferences shifted towards sustainable electronics, driving eco-friendly product designs. |
| 2027 | 4.4% | Partnerships between tech firms and universities fueled research in next-gen electronic solutions. |
| 2028 | 5.0% | Emerging 5G networks intensified the demand for high-performance electronic components and systems. |
| 2029 | 4.8% | Integration of AI in manufacturing processes necessitated advanced electronic hardware development. |
| 2030 | 4.8% | Sharp increases in data processing needs created a surge in component technological upgrades. |
| 2031 | 4.9% | Global sustainability trends prompted local manufacturers to embrace circular economy practices. |
| 2032 | 4.7% | The intersection of health tech and electronics led to new market opportunities for components. |
Note - Market size estimations and growth projections presented in this report are based on 6Wresearch's advanced forecasting approach, validated with industry datasets as of June 2026.
Singapore Electronic parts Market Synopsis
The Singapore Electronic parts Market is projected to reach 4.6% and witness significant growth during the forecast period (2026-2032). This upward trajectory is driven by the increasing integration of electronic components across vital sectors such as automotive, healthcare, and consumer electronics. Moreover, various governmental initiatives aimed at fostering digital transformation and the rising demand for connected devices are significant contributors to the continuous expansion of this market.
Singapore Electronic parts Market Growth Drivers
A series of key factors underpin the robust growth of the Singapore electronic parts market. These include:
- Investment Surge: Increasing investments from multinational corporations establishing manufacturing bases in Singapore are boosting production capacities and technological expertise, thereby enhancing the national output of electronic components.
- Urbanization Trends: The rapid urbanization of Singapore has led to an escalating demand for electronic parts, particularly in the development of smart infrastructures and innovative consumer solutions.
- Technological Evolution: Advancements in technology are driving innovation within the electronic components sector, fostering new applications and enhancing product offerings that meet evolving market demands.
- Smart City Initiatives: The government-sponsored smart city projects have triggered a higher demand for electronic components, emphasizing energy efficiency and smart connectivity, which fuels market penetration.
- Consumer Spending Power: Growing disposable incomes in Singapore have resulted in increased consumer spending on premium electronic gadgets, necessitating higher volumes of sophisticated electronic parts.
Singapore Electronic parts Market Challenges and Restraints
Despite its promising growth trajectory, the Singapore electronic parts market faces several challenges:
- Intense Competition: The highly competitive nature of the industry often results in narrow profit margins, which can lead to the exit of smaller players and potential mergers among local suppliers.
- Supply Chain Disruption: The global semiconductor supply chain has been strained, affecting the availability of critical electronic components and impacting production schedules for local manufacturers.
- Higher Operational Costs: Rising transportation costs and lengthy customs clearance processes add financial pressure on manufacturers, restricting their ability to expand operations effectively.
- Material Cost Volatility: The fluctuating costs of raw materials pose risks to lower-tier producers, squeezing supply chains and making it difficult to maintain pricing stability.
- Skilled Labor Shortage: Rapid technological advancements have outpaced the availability of skilled labor, complicating recruitment efforts necessary to manage new technologies in manufacturing processes.
Singapore Electronic parts Market Government Investment and Initiatives
The Singaporean government has undertaken a variety of initiatives aimed at stimulating growth in the electronic parts sector. Through the Industry Transformation Maps (ITM), the government is investing in digital technologies and promoting a culture of innovation among local manufacturers. Specific initiatives focus on enhancing workforce skills and fostering collaboration between industries to create a more integrated ecosystem. Additionally, incentives for research and development projects are being offered to support innovative solutions that can elevate the capabilities of local manufacturers in the electronic parts domain.
Singapore Electronic parts Market Latest Developments (May 2025 - June 2026)
Recent developments in the Singapore electronic parts market from May 2025 to June 2026 indicate a significant shift towards automation and advanced manufacturing processes. Many local firms are adopting Industry 4.0 technologies, which enhance productivity and allow for greater customization of electronic components. In parallel, partnerships between technology firms and research institutions are on the rise, aiming at pioneering innovations that cater to the evolving demands of smart industries. Furthermore, sustainability has become a critical focus, with numerous manufacturers exploring eco-friendly materials and practices to meet regulatory standards and consumer expectations.
Singapore Electronic parts Market - Key Attractiveness of the Report
- 10 Years of Market Numbers
- Historical Data Starting from 2022 to 2025
- Base Year: 2025
- Forecast Data until 2032
- Key Performance Indicators Impacting the Market
- Major Upcoming Developments and Projects
Key Highlights of the Report:
- Singapore Electronic parts Market Outlook
- Market Size of Singapore Electronic parts Market, 2025
- Forecast of Singapore Electronic parts Market, 2032F
- Historical Data and Forecast of Singapore Electronic parts Revenues & Volume for the Period 2022-2032F
- Singapore Electronic parts Market Trend Evolution
- Singapore Electronic parts Market Drivers and Challenges
- Singapore Electronic parts Price Trends
- Singapore Electronic parts Porter's Five Forces
- Singapore Electronic parts Industry Life Cycle
- Historical Data and Forecast of Singapore Electronic parts Market Revenues & Volume By Type for the Period 2022-2032F
- Historical Data and Forecast of Singapore Electronic parts Market Revenues & Volume By Passive for the Period 2022-2032F
- Historical Data and Forecast of Singapore Electronic parts Market Revenues & Volume By Active for the Period 2022-2032F
- Historical Data and Forecast of Singapore Electronic parts Market Revenues & Volume By Electro Mechanic for the Period 2022-2032F
- Historical Data and Forecast of Singapore Electronic parts Market Revenues & Volume By Application for the Period 2022-2032F
- Historical Data and Forecast of Singapore Electronic parts Market Revenues & Volume By Automotive for the Period 2022-2032F
- Historical Data and Forecast of Singapore Electronic parts Market Revenues & Volume By Communications for the Period 2022-2032F
- Historical Data and Forecast of Singapore Electronic parts Market Revenues & Volume By Computing Applications for the Period 2022-2032F
- Historical Data and Forecast of Singapore Electronic parts Market Revenues & Volume By Others for the Period 2022-2032F
- Singapore Electronic parts Import Export Trade Statistics
- Market Opportunity Assessment By Type
- Market Opportunity Assessment By Application
- Singapore Electronic parts Top Companies Market Share
- Singapore Electronic parts Competitive Benchmarking By Technical and Operational Parameters
- Singapore Electronic parts Company Profiles
- Singapore Electronic parts Key Strategic Recommendations
Frequently Asked Questions About the Market Study (FAQs):
Growth is primarily driven by rising investments, increasing urbanization, technological advancements, and government initiatives promoting digital transformation.
Manufacturers face challenges including intense competition, supply chain disruptions, rising operational costs, material cost volatility, and a shortage of skilled labor.
The government supports the sector through initiatives like Industry Transformation Maps, promoting innovation, providing R&D incentives, and enhancing workforce skills.
Recent developments include the adoption of automation technologies, partnerships between firms and research institutions, and a growing focus on sustainability within manufacturing processes.
6Wresearch actively monitors the Singapore Electronic parts Market and publishes its comprehensive annual report, highlighting emerging trends, growth drivers, revenue analysis, and forecast outlook. Our insights help businesses to make data-backed strategic decisions with ongoing market dynamics. Our analysts track relevent industries related to the Singapore Electronic parts Market, allowing our clients with actionable intelligence and reliable forecasts tailored to emerging regional needs.
Yes, we provide customisation as per your requirements. To learn more, feel free to contact us on sales@6wresearch.com
1 Executive Summary |
2 Introduction |
2.1 Key Highlights of the Report |
2.2 Report Description |
2.3 Market Scope & Segmentation |
2.4 Research Methodology |
2.5 Assumptions |
3 Singapore Electronic parts Market Overview |
3.1 Singapore Country Macro Economic Indicators |
3.2 Singapore Electronic parts Market Revenues & Volume, 2022 & 2032F |
3.3 Singapore Electronic parts Market - Industry Life Cycle |
3.4 Singapore Electronic parts Market - Porter's Five Forces |
3.5 Singapore Electronic parts Market Revenues & Volume Share, By Type, 2022 & 2032F |
3.6 Singapore Electronic parts Market Revenues & Volume Share, By Application, 2022 & 2032F |
4 Singapore Electronic parts Market Dynamics |
4.1 Impact Analysis |
4.2 Market Drivers |
4.3 Market Restraints |
5 Singapore Electronic parts Market Trends |
6 Singapore Electronic parts Market, By Types |
6.1 Singapore Electronic parts Market, By Type |
6.1.1 Overview and Analysis |
6.1.2 Singapore Electronic parts Market Revenues & Volume, By Type, 2022-2032F |
6.1.3 Singapore Electronic parts Market Revenues & Volume, By Passive, 2022-2032F |
6.1.4 Singapore Electronic parts Market Revenues & Volume, By Active, 2022-2032F |
6.1.5 Singapore Electronic parts Market Revenues & Volume, By Electro Mechanic, 2022-2032F |
6.2 Singapore Electronic parts Market, By Application |
6.2.1 Overview and Analysis |
6.2.2 Singapore Electronic parts Market Revenues & Volume, By Automotive, 2022-2032F |
6.2.3 Singapore Electronic parts Market Revenues & Volume, By Communications, 2022-2032F |
6.2.4 Singapore Electronic parts Market Revenues & Volume, By Computing Applications, 2022-2032F |
6.2.5 Singapore Electronic parts Market Revenues & Volume, By Others, 2022-2032F |
7 Singapore Electronic parts Market Import-Export Trade Statistics |
7.1 Singapore Electronic parts Market Export to Major Countries |
7.2 Singapore Electronic parts Market Imports from Major Countries |
8 Singapore Electronic parts Market Key Performance Indicators |
9 Singapore Electronic parts Market - Opportunity Assessment |
9.1 Singapore Electronic parts Market Opportunity Assessment, By Type, 2022 & 2032F |
9.2 Singapore Electronic parts Market Opportunity Assessment, By Application, 2022 & 2032F |
10 Singapore Electronic parts Market - Competitive Landscape |
10.1 Singapore Electronic parts Market Revenue Share, By Companies, 2025 |
10.2 Singapore Electronic parts Market Competitive Benchmarking, By Operating and Technical Parameters |
11 Company Profiles |
12 Recommendations |
13 Disclaimer |
Global Go To Market Strategy - 2030
Export potential enables firms to identify high-growth global markets with greater confidence by combining advanced trade intelligence with a structured quantitative methodology. The framework analyzes emerging demand trends and country-level import patterns while integrating macroeconomic and trade datasets such as GDP and population forecasts, bilateral import–export flows, tariff structures, elasticity differentials between developed and developing economies, geographic distance, and import demand projections. Using weighted trade values from 2020–2024 as the base period to project country-to-country export potential for 2030, these inputs are operationalized through calculated drivers such as gravity model parameters, tariff impact factors, and projected GDP per-capita growth. Through an analysis of hidden potentials, demand hotspots, and market conditions that are most favorable to success, this method enables firms to focus on target countries, maximize returns, and global expansion with data, backed by accuracy.
By factoring in the projected importer demand gap that is currently unmet and could be potential opportunity, it identifies the potential for the Exporter (Country) among 190 countries, against the general trade analysis, which identifies the biggest importer or exporter.
To discover high-growth global markets and optimize your business strategy:
Click Here
Pricing
- Single User License$ 1,995
- Department License$ 2,400
- Site License$ 3,120
- Global License$ 3,795

Leadership Perspectives from Industry Events
Search
Thought Leadership and Analyst Meet


Our Clients
6WResearch In News
- India Air Conditioner Market Set for Strong Rebound in 2026 After Weather-Led Correction and GST-Driven Recovery: 6Wresearch
- ADAS in India: How Automatic Emergency Braking, Blind Spot Detection & Driver Monitoring are Transforming Road Safety
- Doha a strategic location for EV manufacturing hub: IPA Qatar
- Demand for luxury TVs surging in the GCC, says Samsung
- Empowering Growth: The Thriving Journey of Bangladesh’s Cable Industry
- Demand for luxury TVs surging in the GCC, says Samsung
Latest Reports
- Nicaragua RPG Gaming Market (2026-2032)
- New Zealand RPG Gaming Market (2026-2032)
- Netherlands RPG Gaming Market (2026-2032)
- Nauru RPG Gaming Market (2026-2032)
- Namibia RPG Gaming Market (2026-2032)
- Mozambique RPG Gaming Market (2026-2032)
- Montenegro RPG Gaming Market (2026-2032)
- Mongolia RPG Gaming Market (2026-2032)
- Monaco RPG Gaming Market (2026-2032)
- Micronesia RPG Gaming Market (2026-2032)
Industry Events and Analyst Meet

EV India Expo 2026

HIMTEX 2026

India Refining Summit 2026

India EV Show 2026

EV tech India Expo 2026
Whitepaper
- Middle East & Africa Commercial Security Market Click here to view more.
- Middle East & Africa Fire Safety Systems & Equipment Market Click here to view more.
- GCC Drone Market Click here to view more.
- Middle East Lighting Fixture Market Click here to view more.
- GCC Physical & Perimeter Security Market Click here to view more.