Singapore Halogenated Solvents Market (2026-2032) Outlook | Size, Companies, Value, Trends, Analysis, Forecast, Growth, Share, Revenue & Industry
Market Forecast By Product (Methylene Chloride, Perchloroethylene, Trichloroethylene), By End-use (Paint & Coatings, Printing Inks, Cosmetics & Toiletries, Other) And Competitive Landscape
| Product Code: ETC417143 | Publication Date: Oct 2022 | Updated Date: Mar 2026 | Product Type: Market Research Report | |
| Publisher: 6Wresearch | Author: Ravi Bhandari | No. of Pages: 75 | No. of Figures: 35 | No. of Tables: 20 |
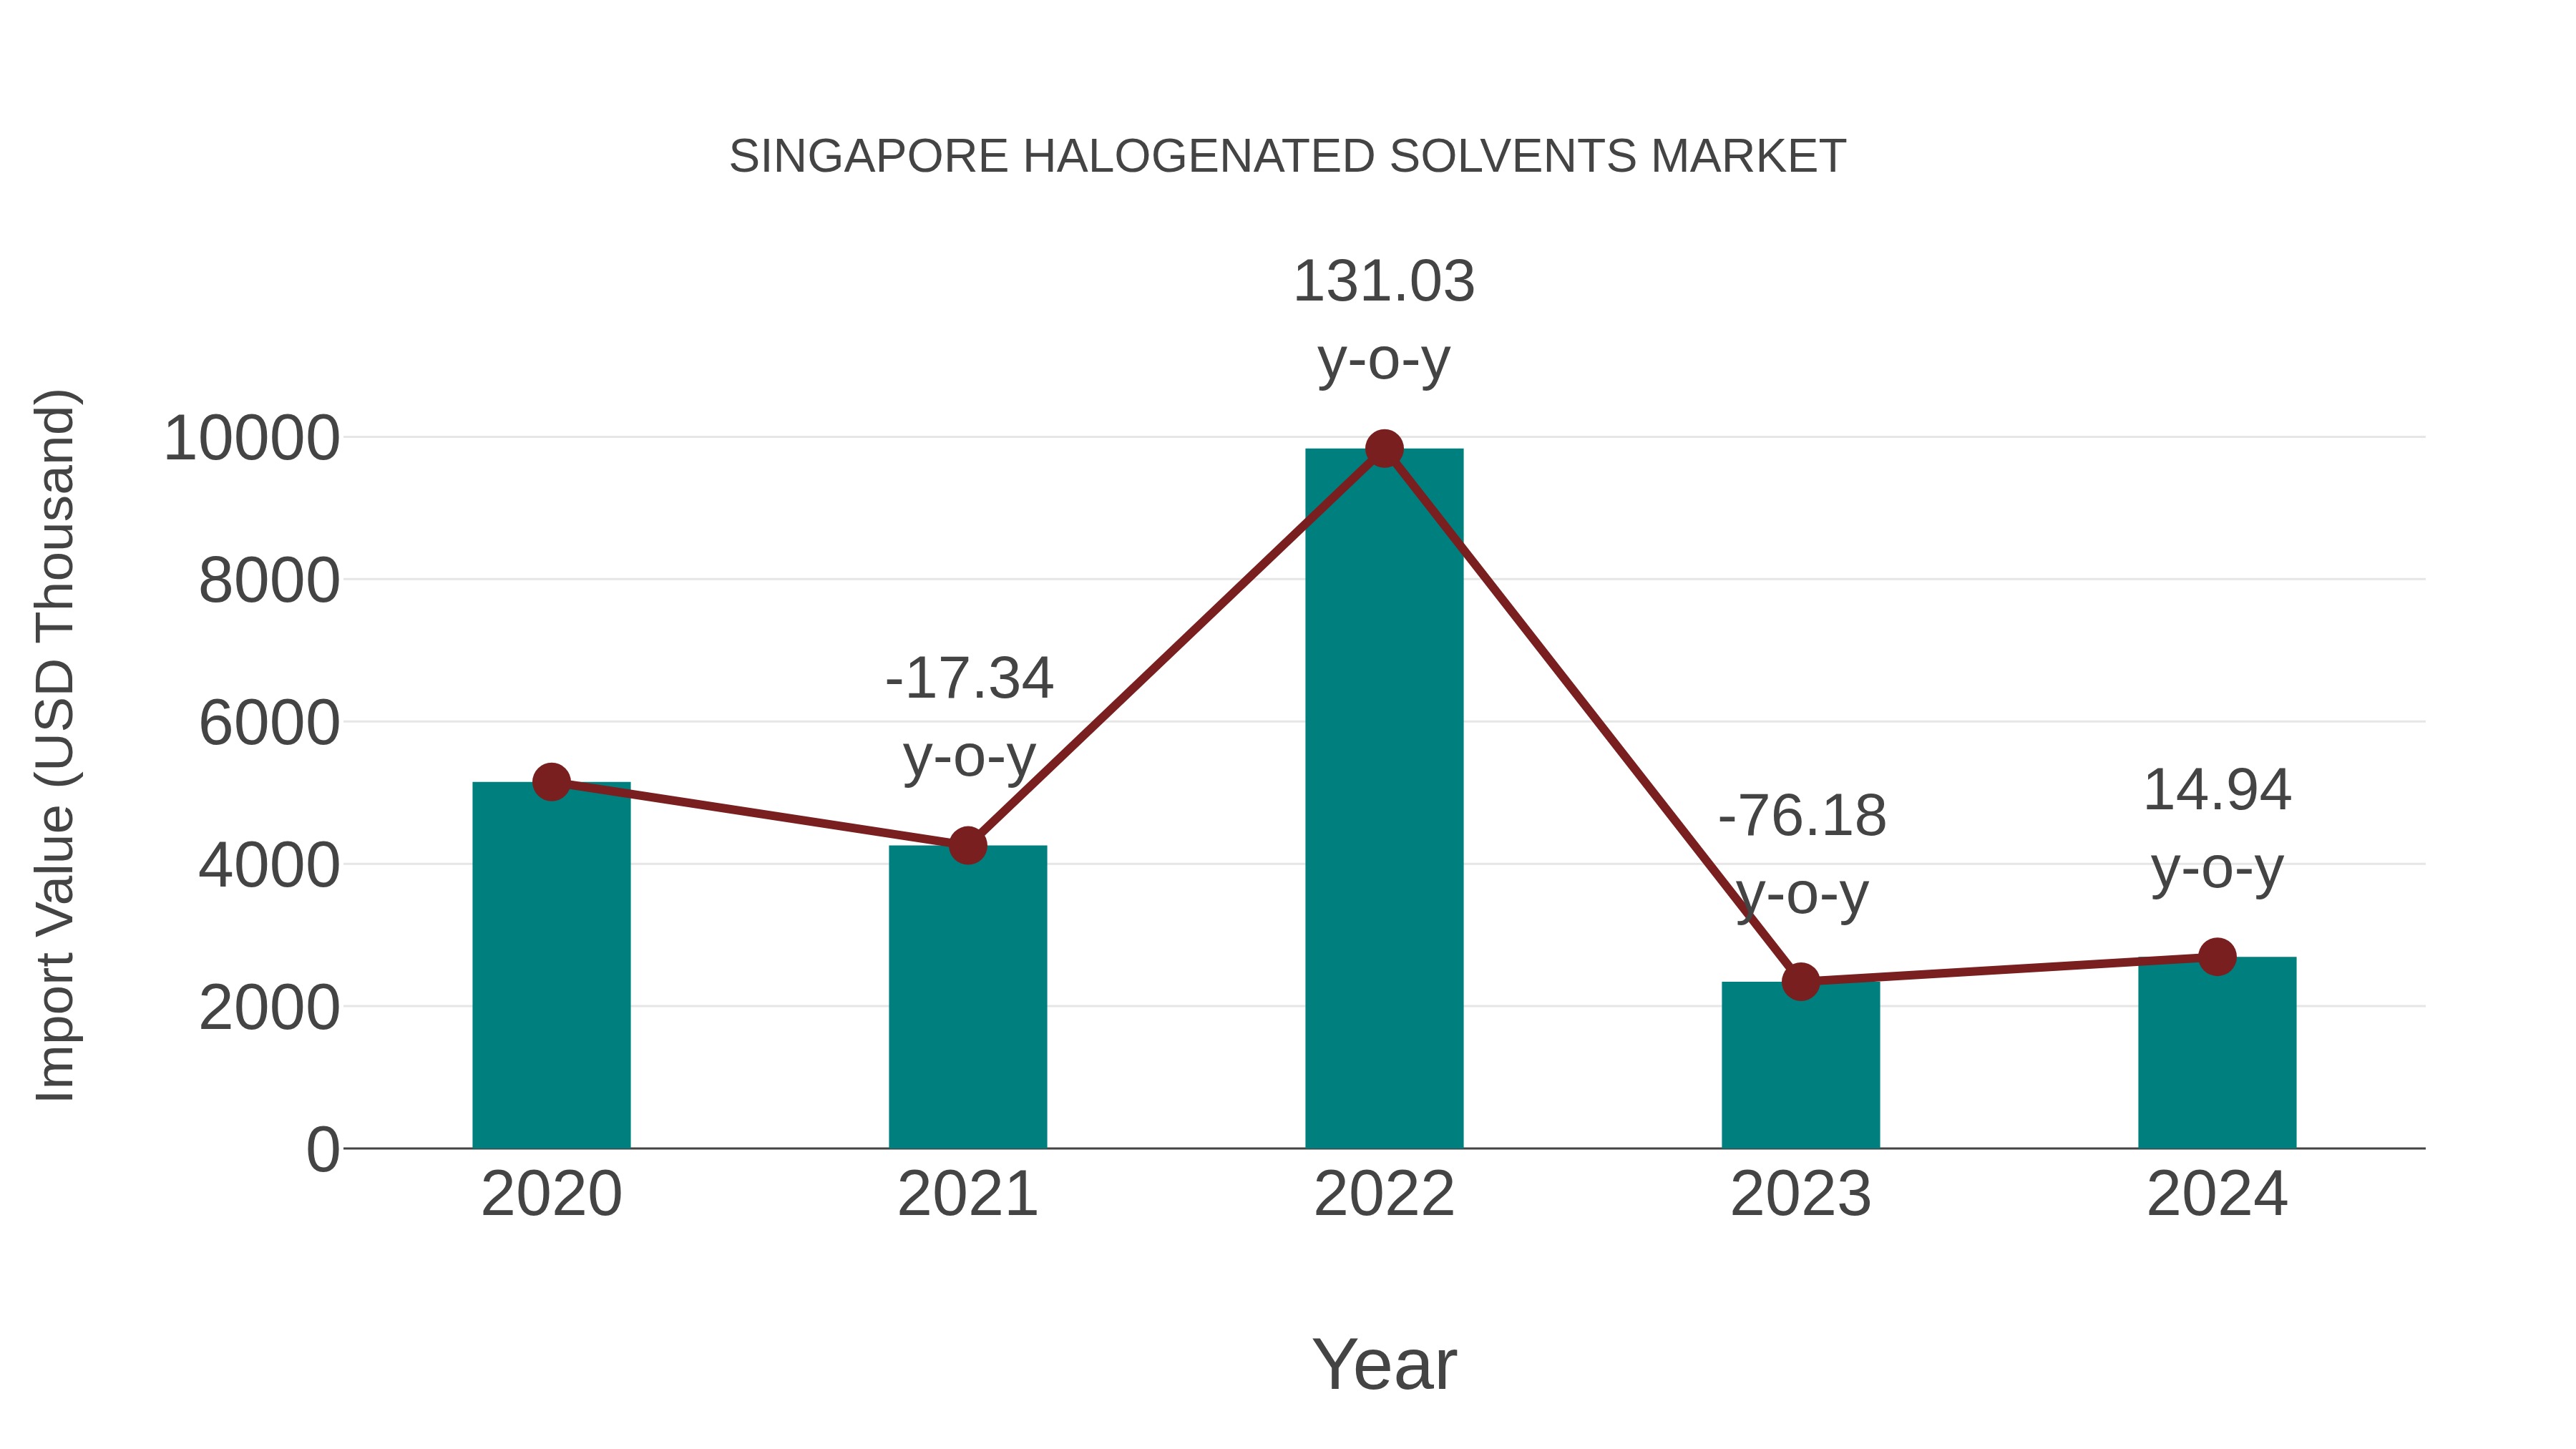
Singapore Halogenated Solvents Market: Import Trend Analysis
In 2024, Singapore`s import trend for halogenated solvents exhibited a growth rate of 14.94% compared to the previous year. However, the compound annual growth rate (CAGR) for the period 2020-2024 stood at -14.96%. This contrasting performance may be attributed to shifts in demand dynamics or changes in trade policies impacting market stability.
Singapore Halogenated Solvents Market Synopsis
The Singapore halogenated solvents market offers a range of chemicals used as solvents and intermediates in industries such as pharmaceuticals and electronics manufacturing. Market dynamics are influenced by product quality, safety standards, and compliance with environmental regulations to meet the diverse needs of industrial sectors.
Drivers of the Market
The Singapore halogenated solvents market may experience growth as these solvents find applications in the chemical and industrial sectors. Halogenated solvents serve as key ingredients in various chemical processes and formulations. As industries seek efficient and eco-friendly solutions, the demand for halogenated solvents is likely to increase, contributing to market growth.
Challenges of the Market
The halogenated solvents market in Singapore faces challenges concerning environmental regulations, sustainability, and market competition. Halogenated solvents are used in various industrial applications, and their environmental impact has raised concerns. Navigating environmental regulations, addressing sustainability issues, and competing in a dynamic market are key challenges for market competitiveness.
COVID-19 Impact on the Market
The halogenated solvents market in Singapore demonstrated resilience during the COVID-19 pandemic, with sustained demand in sectors like chemicals and electronics. Halogenated solvents continued to be crucial in various applications. Suppliers adapted by offering environmentally friendly solutions and ensuring supply chain reliability. The pandemic underscored the significance of these solvents in electronics manufacturing, influencing market strategies.
Key Players in the Market
Halogenated solvents are used in various industries. Key players include companies like 3M and Dow Chemical, as well as local chemical distributors.
Key Highlights of the Report:
- Singapore Halogenated Solvents Market Outlook
- Market Size of Singapore Halogenated Solvents Market, 2025
- Forecast of Singapore Halogenated Solvents Market, 2032
- Historical Data and Forecast of Singapore Halogenated Solvents Revenues & Volume for the Period 2022-2032F
- Singapore Halogenated Solvents Market Trend Evolution
- Singapore Halogenated Solvents Market Drivers and Challenges
- Singapore Halogenated Solvents Price Trends
- Singapore Halogenated Solvents Porter's Five Forces
- Singapore Halogenated Solvents Industry Life Cycle
- Historical Data and Forecast of Singapore Halogenated Solvents Market Revenues & Volume By Product for the Period 2022-2032F
- Historical Data and Forecast of Singapore Halogenated Solvents Market Revenues & Volume By Methylene Chloride for the Period 2022-2032F
- Historical Data and Forecast of Singapore Halogenated Solvents Market Revenues & Volume By Perchloroethylene for the Period 2022-2032F
- Historical Data and Forecast of Singapore Halogenated Solvents Market Revenues & Volume By Trichloroethylene for the Period 2022-2032F
- Historical Data and Forecast of Singapore Halogenated Solvents Market Revenues & Volume By End-use for the Period 2022-2032F
- Historical Data and Forecast of Singapore Halogenated Solvents Market Revenues & Volume By Paint & Coatings for the Period 2022-2032F
- Historical Data and Forecast of Singapore Halogenated Solvents Market Revenues & Volume By Printing Inks for the Period 2022-2032F
- Historical Data and Forecast of Singapore Halogenated Solvents Market Revenues & Volume By Cosmetics & Toiletries for the Period 2022-2032F
- Historical Data and Forecast of Singapore Halogenated Solvents Market Revenues & Volume By Other for the Period 2022-2032F
- Singapore Halogenated Solvents Import Export Trade Statistics
- Market Opportunity Assessment By Product
- Market Opportunity Assessment By End-use
- Singapore Halogenated Solvents Top Companies Market Share
- Singapore Halogenated Solvents Competitive Benchmarking By Technical and Operational Parameters
- Singapore Halogenated Solvents Company Profiles
- Singapore Halogenated Solvents Key Strategic Recommendations
Singapore Halogenated Solvents Market (2026-2032): FAQs
6Wresearch actively monitors the Singapore Halogenated Solvents Market and publishes its comprehensive annual report, highlighting emerging trends, growth drivers, revenue analysis, and forecast outlook. Our insights help businesses to make data-backed strategic decisions with ongoing market dynamics. Our analysts track relevent industries related to the Singapore Halogenated Solvents Market, allowing our clients with actionable intelligence and reliable forecasts tailored to emerging regional needs.
Yes, we provide customisation as per your requirements. To learn more, feel free to contact us on sales@6wresearch.com
1 Executive Summary |
2 Introduction |
2.1 Key Highlights of the Report |
2.2 Report Description |
2.3 Market Scope & Segmentation |
2.4 Research Methodology |
2.5 Assumptions |
3 Singapore Halogenated Solvents Market Overview |
3.1 Singapore Country Macro Economic Indicators |
3.2 Singapore Halogenated Solvents Market Revenues & Volume, 2022 & 2032F |
3.3 Singapore Halogenated Solvents Market - Industry Life Cycle |
3.4 Singapore Halogenated Solvents Market - Porter's Five Forces |
3.5 Singapore Halogenated Solvents Market Revenues & Volume Share, By Product, 2022 & 2032F |
3.6 Singapore Halogenated Solvents Market Revenues & Volume Share, By End-use, 2022 & 2032F |
4 Singapore Halogenated Solvents Market Dynamics |
4.1 Impact Analysis |
4.2 Market Drivers |
4.2.1 Growing demand for halogenated solvents in various industries in Singapore such as electronics, pharmaceuticals, and chemical manufacturing. |
4.2.2 Increasing investments in research and development activities to develop innovative halogenated solvents with improved properties. |
4.2.3 Stringent regulations and policies promoting the use of halogenated solvents for specific applications in Singapore. |
4.3 Market Restraints |
4.3.1 Environmental concerns regarding the use of halogenated solvents leading to increased scrutiny and potential bans. |
4.3.2 Fluctuating prices of raw materials used in the production of halogenated solvents impacting the overall market. |
4.3.3 Competition from alternative solvents that are considered safer and more environmentally friendly. |
5 Singapore Halogenated Solvents Market Trends |
6 Singapore Halogenated Solvents Market, By Types |
6.1 Singapore Halogenated Solvents Market, By Product |
6.1.1 Overview and Analysis |
6.1.2 Singapore Halogenated Solvents Market Revenues & Volume, By Product, 2022-2032F |
6.1.3 Singapore Halogenated Solvents Market Revenues & Volume, By Methylene Chloride, 2022-2032F |
6.1.4 Singapore Halogenated Solvents Market Revenues & Volume, By Perchloroethylene, 2022-2032F |
6.1.5 Singapore Halogenated Solvents Market Revenues & Volume, By Trichloroethylene, 2022-2032F |
6.2 Singapore Halogenated Solvents Market, By End-use |
6.2.1 Overview and Analysis |
6.2.2 Singapore Halogenated Solvents Market Revenues & Volume, By Paint & Coatings, 2022-2032F |
6.2.3 Singapore Halogenated Solvents Market Revenues & Volume, By Printing Inks, 2022-2032F |
6.2.4 Singapore Halogenated Solvents Market Revenues & Volume, By Cosmetics & Toiletries, 2022-2032F |
6.2.5 Singapore Halogenated Solvents Market Revenues & Volume, By Other, 2022-2032F |
7 Singapore Halogenated Solvents Market Import-Export Trade Statistics |
7.1 Singapore Halogenated Solvents Market Export to Major Countries |
7.2 Singapore Halogenated Solvents Market Imports from Major Countries |
8 Singapore Halogenated Solvents Market Key Performance Indicators |
8.1 Adoption rate of halogenated solvents in key industries in Singapore. |
8.2 Rate of technological advancements and innovations in halogenated solvents. |
8.3 Compliance rate with environmental regulations and standards related to the use of halogenated solvents. |
8.4 Availability of substitutes and their market penetration in Singapore. |
8.5 Investment trends in halogenated solvent production and research in the Singapore market. |
9 Singapore Halogenated Solvents Market - Opportunity Assessment |
9.1 Singapore Halogenated Solvents Market Opportunity Assessment, By Product, 2022 & 2032F |
9.2 Singapore Halogenated Solvents Market Opportunity Assessment, By End-use, 2022 & 2032F |
10 Singapore Halogenated Solvents Market - Competitive Landscape |
10.1 Singapore Halogenated Solvents Market Revenue Share, By Companies, 2025 |
10.2 Singapore Halogenated Solvents Market Competitive Benchmarking, By Operating and Technical Parameters |
11 Company Profiles |
12 Recommendations |
13 Disclaimer |
Global Go To Market Strategy - 2030
Export potential enables firms to identify high-growth global markets with greater confidence by combining advanced trade intelligence with a structured quantitative methodology. The framework analyzes emerging demand trends and country-level import patterns while integrating macroeconomic and trade datasets such as GDP and population forecasts, bilateral import–export flows, tariff structures, elasticity differentials between developed and developing economies, geographic distance, and import demand projections. Using weighted trade values from 2020–2024 as the base period to project country-to-country export potential for 2030, these inputs are operationalized through calculated drivers such as gravity model parameters, tariff impact factors, and projected GDP per-capita growth. Through an analysis of hidden potentials, demand hotspots, and market conditions that are most favorable to success, this method enables firms to focus on target countries, maximize returns, and global expansion with data, backed by accuracy.
By factoring in the projected importer demand gap that is currently unmet and could be potential opportunity, it identifies the potential for the Exporter (Country) among 190 countries, against the general trade analysis, which identifies the biggest importer or exporter.
To discover high-growth global markets and optimize your business strategy:
Click Here
Pricing
- Single User License$ 1,995
- Department License$ 2,400
- Site License$ 3,120
- Global License$ 3,795

Leadership Perspectives from Industry Events
Search
Thought Leadership and Analyst Meet


Our Clients
6WResearch In News
- India Air Conditioner Market Set for Strong Rebound in 2026 After Weather-Led Correction and GST-Driven Recovery: 6Wresearch
- ADAS in India: How Automatic Emergency Braking, Blind Spot Detection & Driver Monitoring are Transforming Road Safety
- Doha a strategic location for EV manufacturing hub: IPA Qatar
- Demand for luxury TVs surging in the GCC, says Samsung
- Empowering Growth: The Thriving Journey of Bangladesh’s Cable Industry
- Demand for luxury TVs surging in the GCC, says Samsung
Latest Reports
- Nicaragua RPG Gaming Market (2026-2032)
- New Zealand RPG Gaming Market (2026-2032)
- Netherlands RPG Gaming Market (2026-2032)
- Nauru RPG Gaming Market (2026-2032)
- Namibia RPG Gaming Market (2026-2032)
- Mozambique RPG Gaming Market (2026-2032)
- Montenegro RPG Gaming Market (2026-2032)
- Mongolia RPG Gaming Market (2026-2032)
- Monaco RPG Gaming Market (2026-2032)
- Micronesia RPG Gaming Market (2026-2032)
Industry Events and Analyst Meet

HIMTEX 2026

India Refining Summit 2026

India EV Show 2026

EV tech India Expo 2026

Auto Tech Asia 2026
Whitepaper
- Middle East & Africa Commercial Security Market Click here to view more.
- Middle East & Africa Fire Safety Systems & Equipment Market Click here to view more.
- GCC Drone Market Click here to view more.
- Middle East Lighting Fixture Market Click here to view more.
- GCC Physical & Perimeter Security Market Click here to view more.