Singapore IoT Connectivity Market Size & Growth Rate (2026-2032)
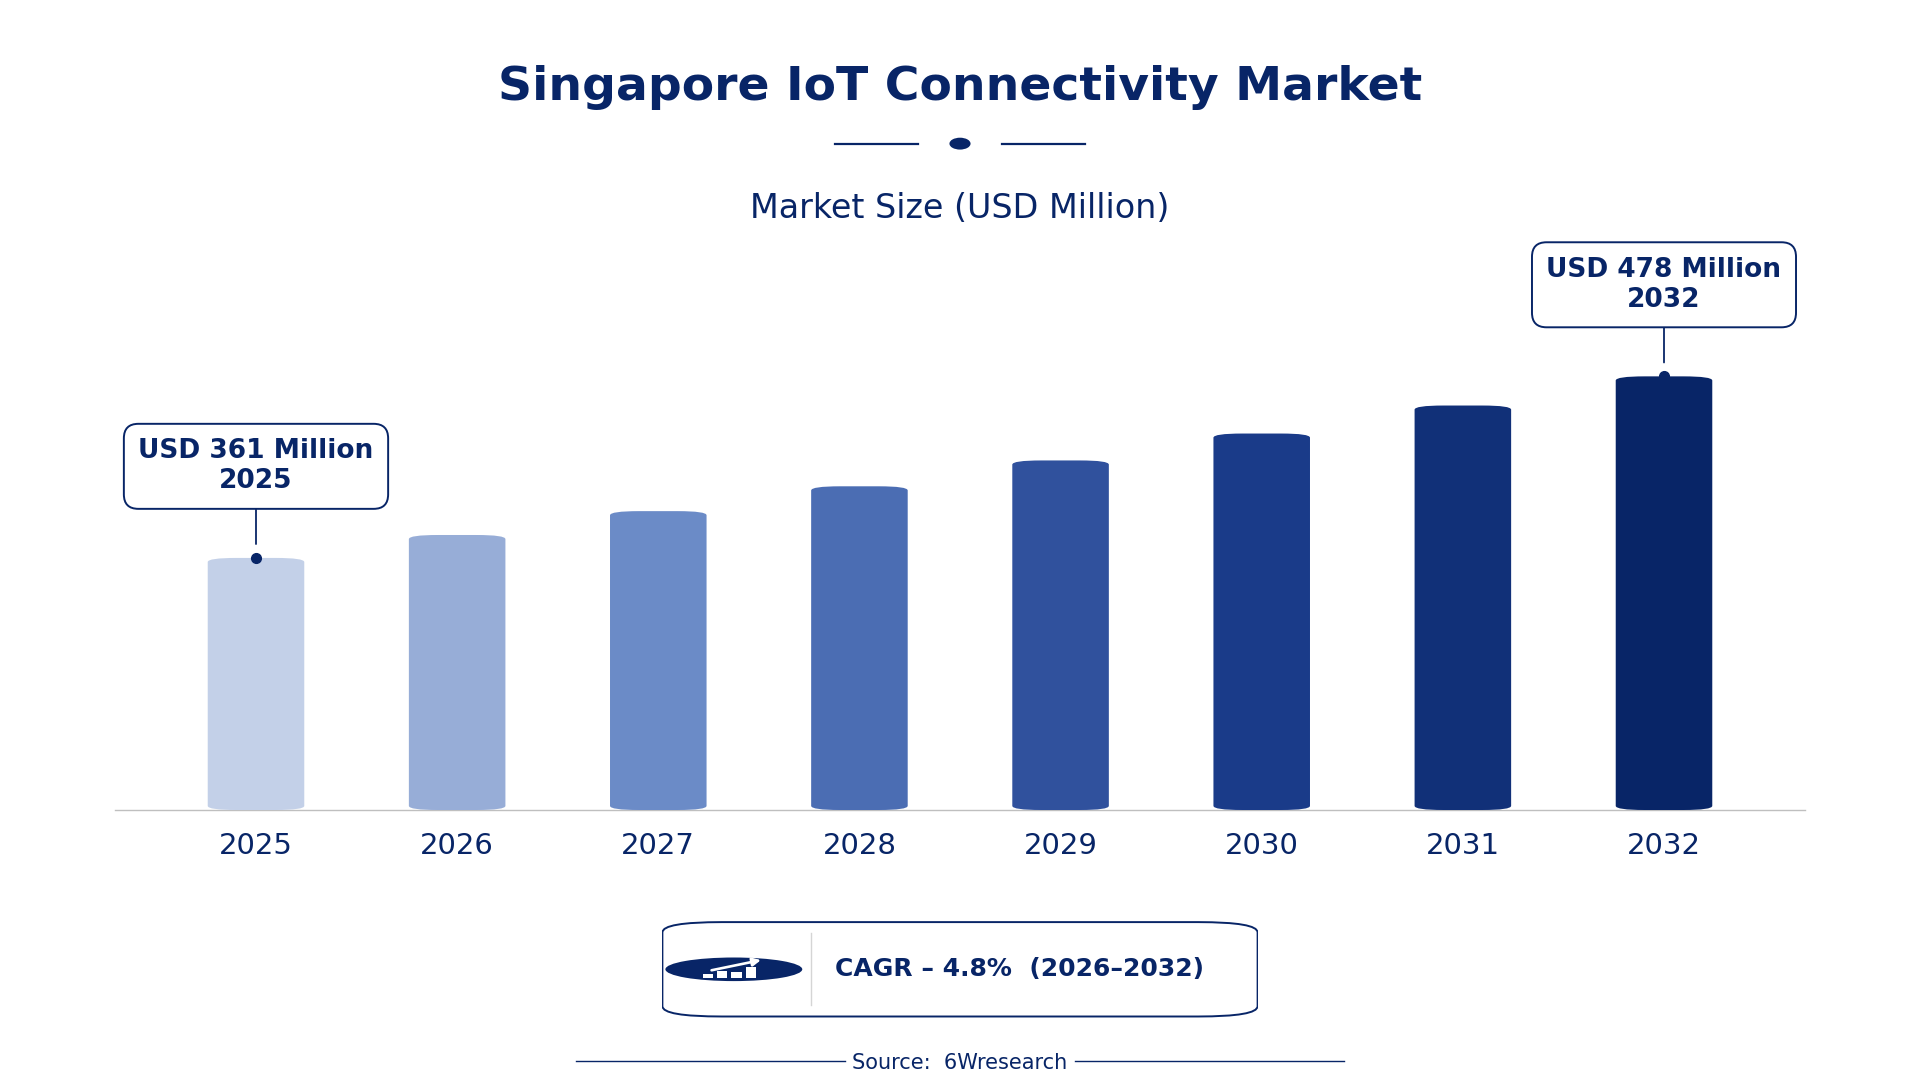
The Singapore IoT Connectivity Market was estimated at USD 361 Million in 2025 and is projected to reach USD 478 Million by 2032, growing at a CAGR of 4.8% from 2026 to 2032.
Singapore IoT Connectivity Market Synopsis
The Singapore IoT Connectivity Market is primarily shaped by the increasing demand for high-speed and reliable connectivity solutions. This surge is driven by a proliferation of IoT devices across various sectors, including healthcare, manufacturing, and smart city initiatives. As Singapore positions itself as a digital leader, the need for enhanced connectivity is becoming imperative.
Beyond just connectivity, the market is evolving into a sophisticated network of data-driven services. This transition enables organizations to make informed decisions, optimize operations, and improve user experiences. The interplay between diverse technologies and applications highlights the market's potential for innovation and growth.
Singapore IoT Connectivity Market Year-wise Growth Rate and Key Drivers
This graph illustrates the annual growth rates of the Singapore IoT Connectivity Market from 2021 to 2032, highlighting a steady upward trajectory and projected expansion over the forecast period.
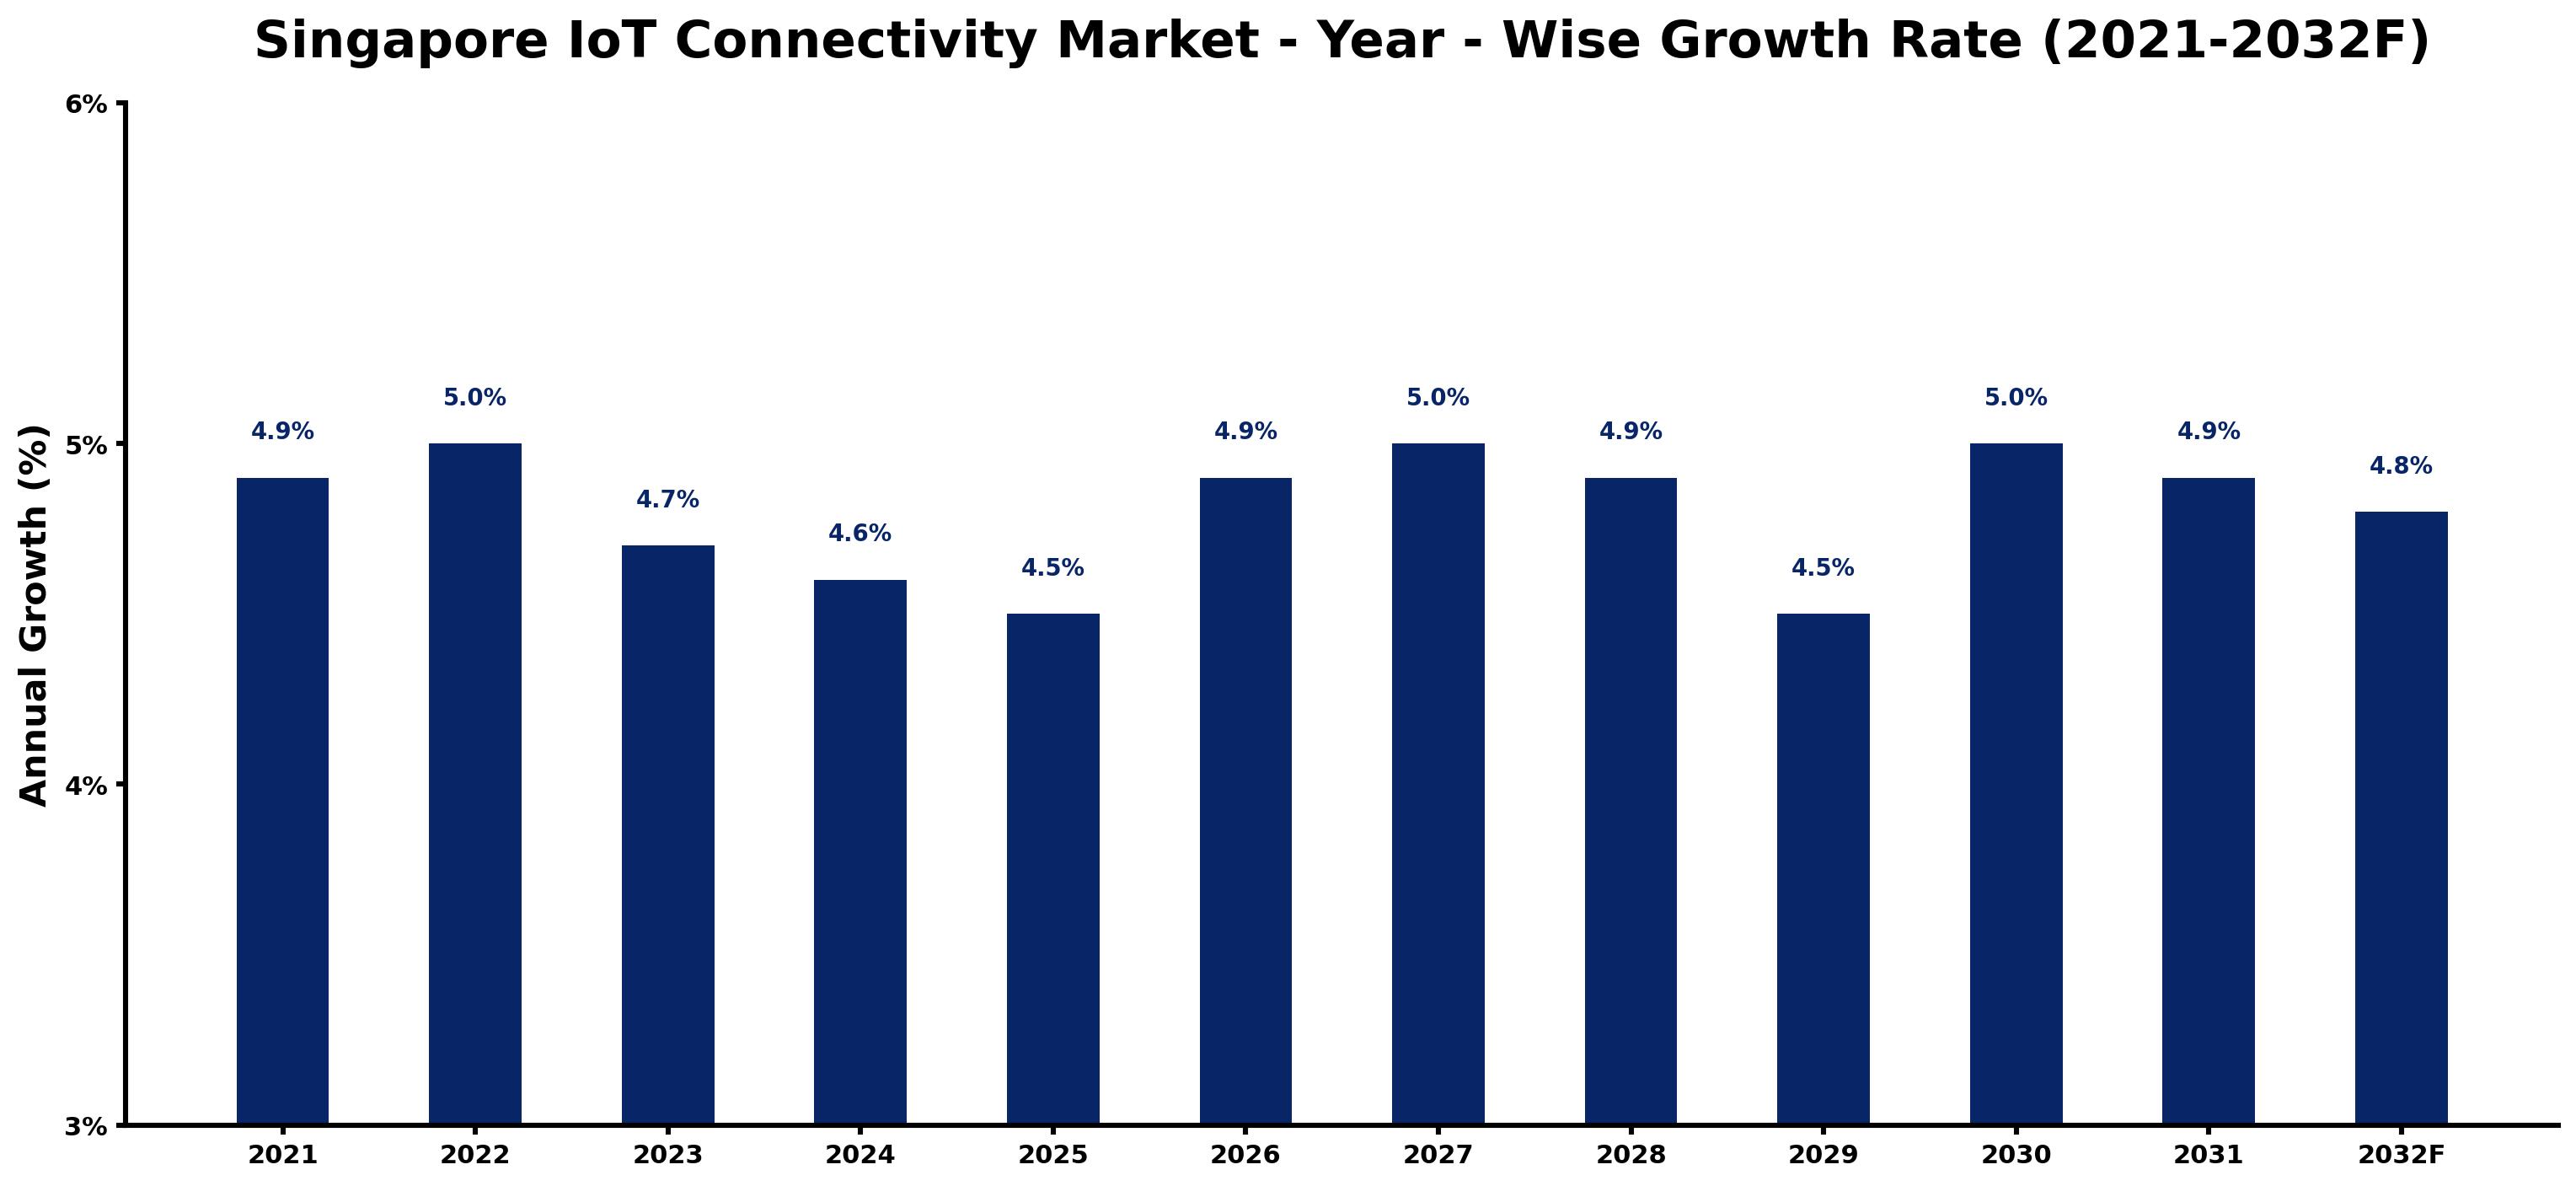
The table below presents the year‑wise growth rates along with the key drivers influencing the market
| Year | Growth Rate | Major Drivers |
| 2021 | 4.9% | Smart Nation initiative promoting IoT adoption across sectors. |
| 2022 | 5.0% | Ecosystem of local startups enhancing IoT service innovation. |
| 2023 | 4.7% | Regulatory bodies streamlining IoT project approval processes. |
| 2024 | 4.6% | Government incentives for IoT in healthcare advancements. |
| 2025 | 4.5% | Increased foreign investments in IoT technology ventures. |
| 2026 | 4.9% | Demand for smart agriculture solutions boosting IoT connectivity. |
| 2027 | 5.0% | Public-private partnerships accelerating IoT research and development. |
| 2028 | 4.9% | Rise in remote working driving IoT home solutions. |
| 2029 | 4.5% | Focus on environmental sustainability fueling smart city projects. |
| 2030 | 5.0% | Education initiatives promoting IoT skills among workforce. |
| 2031 | 4.9% | Growth in logistics sector enhancing IoT fleet tracking. |
| 2032 | 4.8% | Enhanced cybersecurity regulations encouraging secure IoT deployments. |
Note: Market size estimations and growth projections presented in this report are based on 6Wresearch's proprietary forecasting methodology, utilizing the latest available industry data, government publications, and primary research inputs.
Singapore IoT Connectivity Market Key Takeaways
Below are some of the specific key takeaways from the market, including:
- The demand for IoT connectivity solutions is being driven by a surge in device adoption across multiple industries.
- Telecom operators are expanding their offerings to support various IoT applications with diverse connectivity needs.
- Data security and interoperability challenges are pressing issues that must be addressed for sustained market growth.
- The COVID-19 pandemic accelerated the adoption of advanced connectivity solutions, particularly 5G technologies.
- Government initiatives aimed at fostering digital infrastructure are critical to the market's long-term success.
Evaluation of Restraints in Singapore IoT Connectivity Market
Despite its promising trajectory, the Singapore IoT Connectivity Market is not without its challenges. Ensuring consistent and reliable connectivity is a fundamental concern, especially as the volume of data traffic continues to rise. Security vulnerabilities present a major obstacle, as organizations must protect sensitive data from breaches. Additionally, the need for interoperability among various devices and platforms complicates integration efforts, potentially stalling widespread adoption. As these challenges persist, stakeholders will need to invest in advanced solutions and collaborative frameworks to ensure the market's resilience.
Singapore IoT Connectivity Market Trends
Several trends are currently influencing the Singapore IoT Connectivity Market. First, the rollout of 5G networks is transforming connectivity capabilities, allowing for lower latency and higher data transfer speeds. This is particularly vital for applications requiring real-time processing, such as autonomous vehicles and smart healthcare solutions. Second, the growth of edge computing is enabling data processing closer to the source, enhancing response times and reducing bandwidth strain. on top of that, the rise of artificial intelligence and machine learning in data analytics is shaping how businesses leverage IoT data for operational efficiency.
Singapore IoT Connectivity Market Opportunities
The market is brimming with growth opportunities, particularly in sectors like smart cities and healthcare. Investments in smart infrastructure can lead to improved urban management and resource efficiency. Additionally, the increasing focus on sustainability presents avenues for IoT solutions that monitor environmental conditions and optimize energy consumption. As organizations continue to pursue digital transformation, there will be a growing demand for customized connectivity solutions that cater to specific industry needs.
Government Initiatives in the Singapore IoT Connectivity Market
The Singapore government plays a crucial role in shaping the IoT Connectivity Market through strategic initiatives aimed at enhancing the digital landscape. With a focus on infrastructure and regulatory frameworks, the government is actively promoting innovation and investment in this sector. Such policies are vital as they not only foster collaboration among stakeholders but also ensure that Singapore remains competitive on the global stage.
- A national digital infrastructure upgrade programme was recently completed to enhance connectivity across urban areas.
- Ongoing initiatives include the Smart Nation programme, which aims to integrate IoT technologies into public services and urban planning.
- A regulatory framework introduced in 2025 mandates enhanced data security protocols for IoT devices to protect user information.
- Planned public-private partnerships are set to expand telecom infrastructure access by 2028, fostering greater connectivity.
Future Insights of the Singapore IoT Connectivity Market
Looking ahead to 2026-2032, the Singapore IoT Connectivity Market is expected to continue its upward momentum. The increasing integration of IoT across various sectors will drive demand for advanced connectivity solutions. As technologies like 5G become more prevalent, businesses will capitalize on enhanced capabilities to innovate and optimize operations. on top of that, the focus on data security and interoperability will shape investment decisions, ensuring that the market evolves in alignment with emerging challenges and opportunities.
Singapore IoT Connectivity Market Latest Developments
In the past year, the Singapore IoT Connectivity Market has seen significant activity, marked by technological advancements and strategic partnerships. The emphasis on improving infrastructure and connectivity solutions has driven both public and private sector initiatives. As organizations strive to enhance their digital capabilities, recent developments reflect a concerted effort to position Singapore as a leader in IoT connectivity.
- A major technology vendor launched a new IoT connectivity platform in early 2025, aimed at simplifying device integration for businesses.
- A partnership formed between leading telecom operators in Q3 2025 to enhance 5G coverage across key urban areas.
- Currently ongoing is an initiative that began in mid-2025 to upgrade existing IoT infrastructure for better reliability.
- A rollout of new low-power, wide-area network solutions is planned for late 2026 to cater to the growing demand for smart city applications.
Singapore IoT Connectivity Market - Key Attractiveness of the Report
- 10 Years of Market Numbers
- Historical Data Starting from 2022 to 2025
- Base Year: 2025
- Forecast Data until 2032
- Key Performance Indicators Impacting the Market
- Major Upcoming Developments and Projects
Key Highlights of the Report:
- Singapore IoT Connectivity Market Outlook
- Market Size of Singapore IoT Connectivity Market, 2025
- Forecast of Singapore IoT Connectivity Market, 2032
- Historical Data and Forecast of Singapore IoT Connectivity Revenues & Volume for the Period 2022-2032F
- Singapore IoT Connectivity Market Trend Evolution
- Singapore IoT Connectivity Market Drivers and Challenges
- Singapore IoT Connectivity Price Trends
- Singapore IoT Connectivity Porter's Five Forces
- Singapore IoT Connectivity Industry Life Cycle
- Historical Data and Forecast of Singapore IoT Connectivity Market Revenues & Volume By Component for the Period 2022-2032F
- Historical Data and Forecast of Singapore IoT Connectivity Market Revenues & Volume By Platform for the Period 2022-2032F
- Historical Data and Forecast of Singapore IoT Connectivity Market Revenues & Volume By Services for the Period 2022-2032F
- Historical Data and Forecast of Singapore IoT Connectivity Market Revenues & Volume By Application Areas for the Period 2022-2032F
- Historical Data and Forecast of Singapore IoT Connectivity Market Revenues & Volume By Building & Home Automation for the Period 2022-2032F
- Historical Data and Forecast of Singapore IoT Connectivity Market Revenues & Volume By Smart Energy & Utility for the Period 2022-2032F
- Historical Data and Forecast of Singapore IoT Connectivity Market Revenues & Volume By Smart Manufacturing for the Period 2022-2032F
- Historical Data and Forecast of Singapore IoT Connectivity Market Revenues & Volume By Connected Health for the Period 2022-2032F
- Historical Data and Forecast of Singapore IoT Connectivity Market Revenues & Volume By Smart Retail for the Period 2022-2032F
- Historical Data and Forecast of Singapore IoT Connectivity Market Revenues & Volume By Smart Transportation for the Period 2022-2032F
- Historical Data and Forecast of Singapore IoT Connectivity Market Revenues & Volume By Others (Education and Agriculture) for the Period 2022-2032F
- Historical Data and Forecast of Singapore IoT Connectivity Market Revenues & Volume By Organization Size for the Period 2022-2032F
- Historical Data and Forecast of Singapore IoT Connectivity Market Revenues & Volume By Large Enterprises for the Period 2022-2032F
- Historical Data and Forecast of Singapore IoT Connectivity Market Revenues & Volume By SMEs for the Period 2022-2032F
- Singapore IoT Connectivity Import Export Trade Statistics
- Market Opportunity Assessment By Component
- Market Opportunity Assessment By Application Areas
- Market Opportunity Assessment By Organization Size
- Singapore IoT Connectivity Top Companies Market Share
- Singapore IoT Connectivity Competitive Benchmarking By Technical and Operational Parameters
- Singapore IoT Connectivity Company Profiles
- Singapore IoT Connectivity Key Strategic Recommendations






































