Singapore Iron Oxides and Hydroxides Market (2026-2032) Outlook | Industry, Share, Value, Size, Analysis, Trends, Companies, Forecast, Growth & Revenue
Market Forecast By Color (Black, Brown, Red, Yellow, Others), By End Use Industries (Construction, Paper, Plastics, Paints and coatings, Automobiles), By Type (Natural, Synthetic), By Applications (Cosmetic, Healthcare, Pharmaceutical, Manufacturing, Mining and mineral processing) And Competitive Landscape
| Product Code: ETC197019 | Publication Date: May 2022 | Updated Date: Jun 2026 | Product Type: Market Research Report | |
| Publisher: 6Wresearch | Author: Ravi Bhandari | No. of Pages: 60 | No. of Figures: 40 | No. of Tables: 7 |
Singapore Iron Oxides and Hydroxides Market Size, Share & Growth Rate
The Singapore Iron Oxides and Hydroxides Market was estimated at USD 354 Million in 2025 and is projected to reach USD 467 Million by 2032, growing at a CAGR of 4.0% from 2026 to 2032. This growth trajectory is fueled primarily by the ongoing expansion of the construction sector in Singapore, as well as the rising demand for quality pigments in various industries. Additionally, the cosmetics and pharmaceuticals sectors are increasingly prioritizing safe and effective formulations, thereby stimulating demand for these compounds.
Singapore Iron Oxides and Hydroxides Market Year-wise Growth Rate and Key Drivers
This graph highlights how the Singapore Iron Oxides and Hydroxides Market has steadily grown over the years, supported by major growth factors.
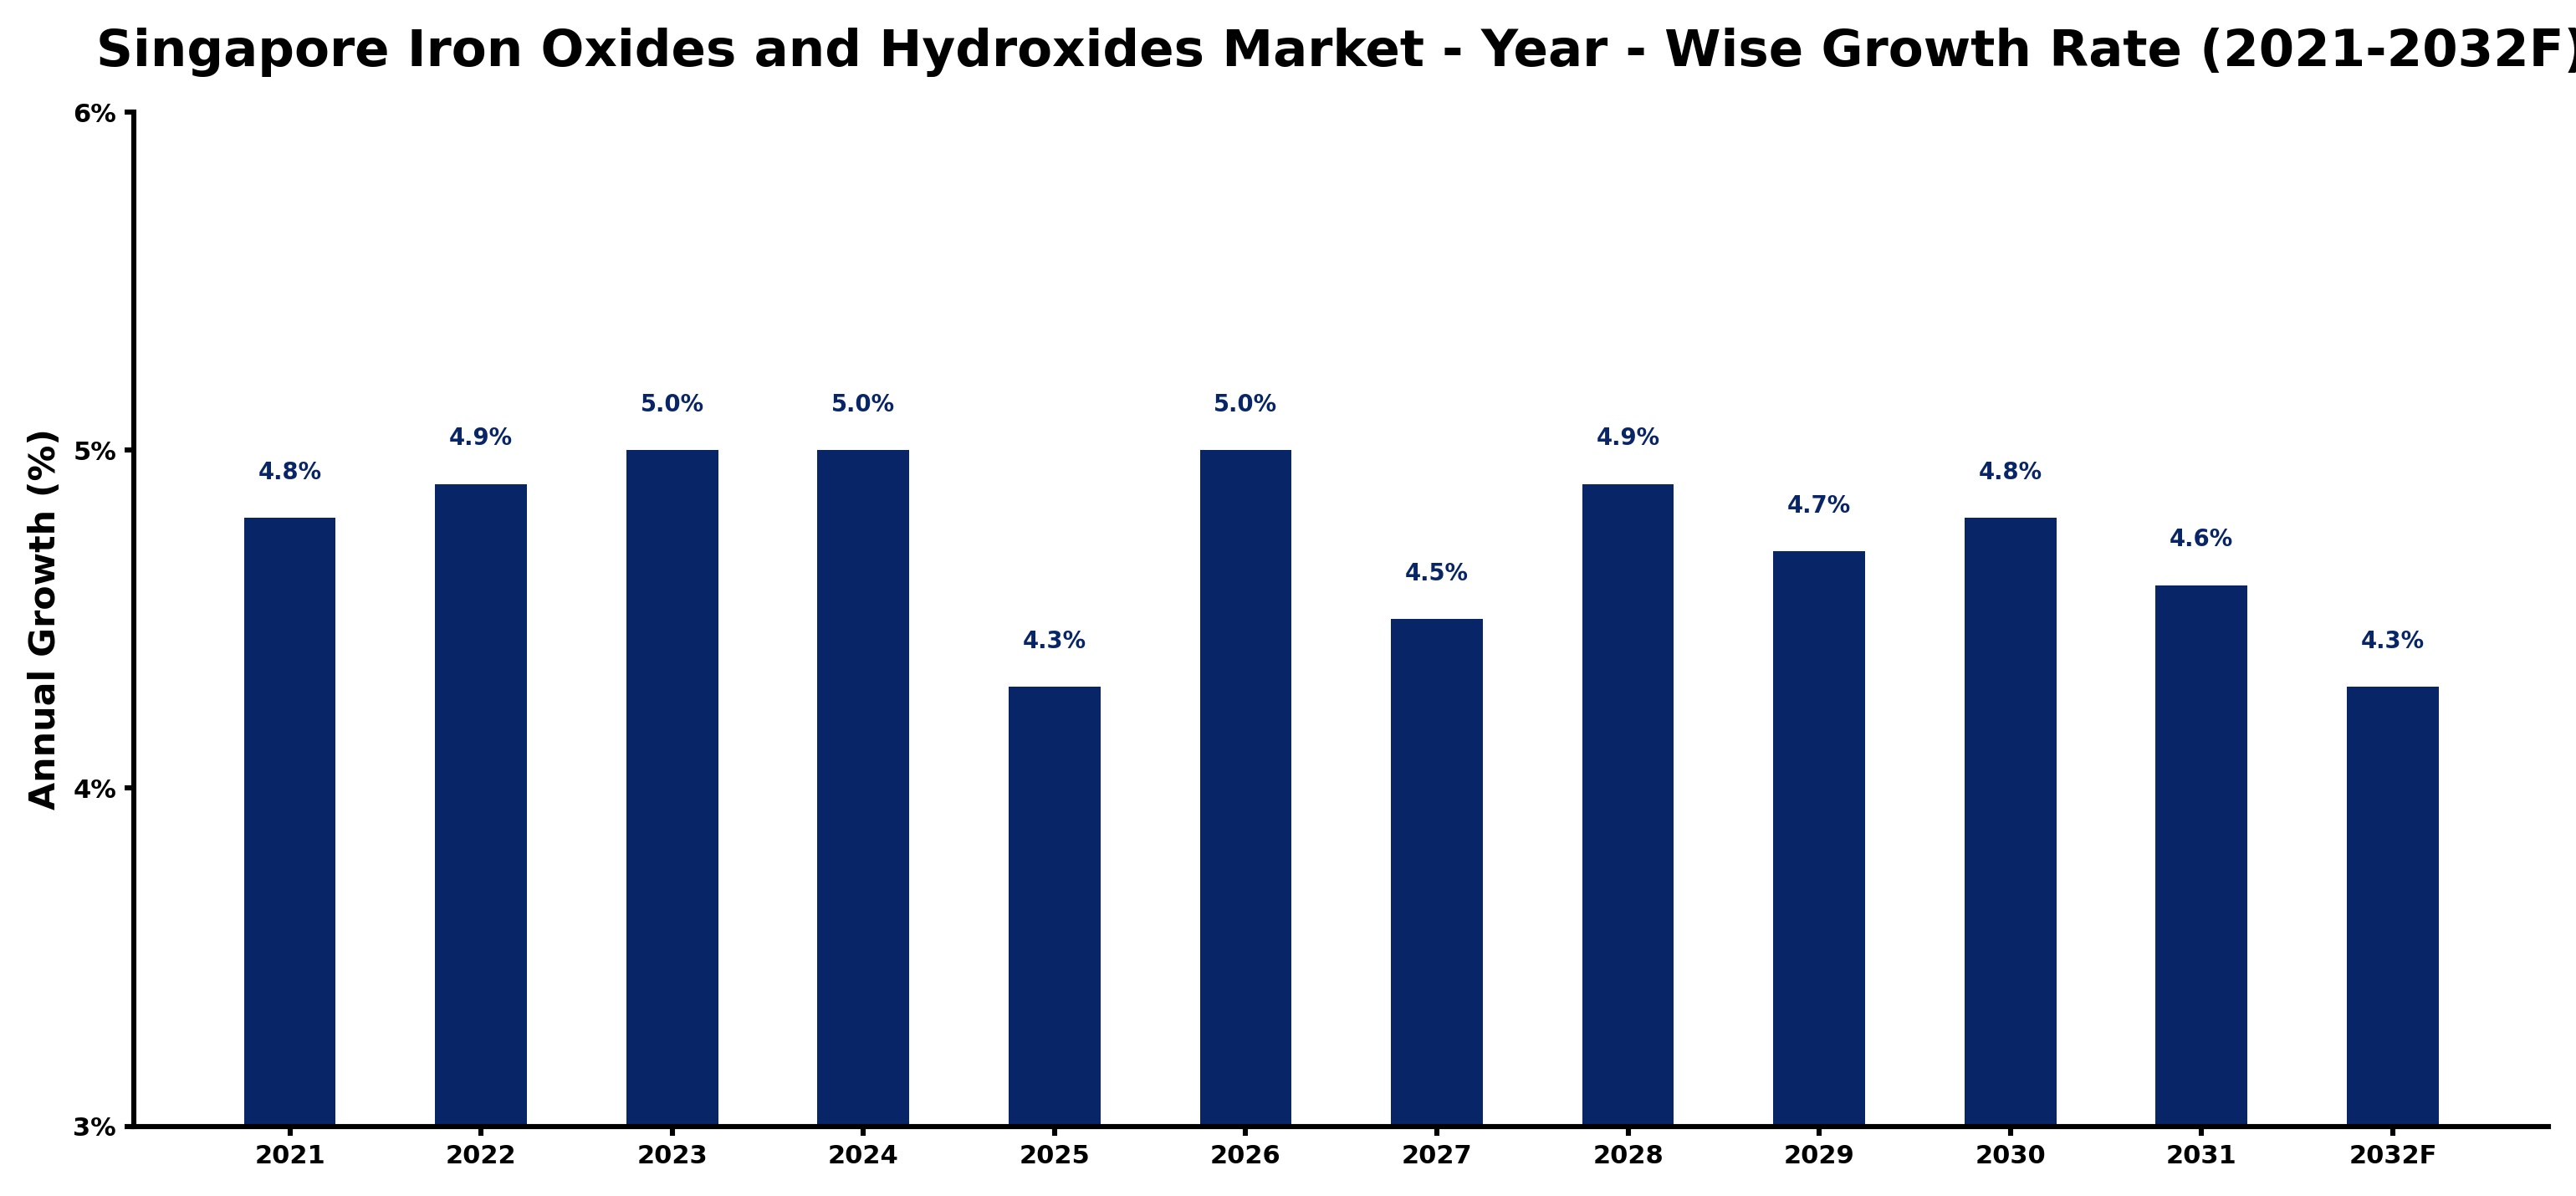
The table below presents the year‑wise growth rates along with the key drivers influencing the market
| Year | Growth Rate | Major Drivers |
| 2021 | 4.8% | Increased construction activities boosted demand |
| 2022 | 4.9% | Automotive sector growth enhanced usage |
| 2023 | 5.0% | Paint and coatings market expanded |
| 2024 | 5.0% | Infrastructure projects drove consumption |
| 2025 | 4.3% | Electronics manufacturing increased requirements |
| 2026 | 5.0% | Renewable energy projects stimulated growth |
| 2027 | 4.5% | Cosmetics industry demand rose significantly |
| 2028 | 4.9% | Agricultural applications expanded usage |
| 2029 | 4.7% | Textile industry growth increased demand |
| 2030 | 4.8% | Pharmaceutical applications drove innovation |
| 2031 | 4.6% | Environmental regulations enhanced product adoption |
| 2032 | 4.3% | Recycling initiatives increased material usage |
Note - Market size estimations and growth projections presented in this report are based on 6Wresearch’s advanced forecasting approach, validated with industry datasets as of June 2026.
Singapore Iron Oxides and Hydroxides Market Synopsis
Recent observations reveal a robust landscape for iron oxides and hydroxides in Singapore, driven by their versatile applications as pigments, catalysts, and additives. The construction industry's flourishing growth, coupled with an increasing emphasis on sustainability in material sourcing, is reshaping market dynamics.
Moreover, regulatory standards concerning product quality are enhancing opportunities for manufacturers to innovate and adopt greener production methods. As demand rises across sectors, the focus on durability and aesthetic appeal in materials is further solidifying the role of iron oxides and hydroxides in Singapore's market.
Singapore Iron Oxides and Hydroxides Market Key Takeaways
- The market is driven by growth in the construction and automotive sectors.
- Strong demand for high-quality pigments in cosmetics and pharmaceuticals is emerging.
- Sustainability initiatives are shaping production practices and consumer preferences.
- Manufacturers face the challenge of adhering to stringent environmental regulations.
- The recovery from COVID-19 is gradually revitalizing demand across various sectors.
Evaluation of Restraints in Singapore Iron Oxides and Hydroxides Market
Despite its growth potential, the Singapore Iron Oxides and Hydroxides Market encounters several restraints. Key among these is the challenge of maintaining consistent product quality in alignment with environmental regulations. The need for manufacturers to adapt to waste disposal and emissions mandates can limit operational efficiencies. This situation necessitates a strategic focus on innovative solutions and investment in sustainable technologies to mitigate environmental impacts while meeting quality standards.
Singapore Iron Oxides and Hydroxides Market Trends
Current trends indicate a noticeable shift towards the use of eco-friendly iron oxide pigments, particularly in paints and coatings. As consumer awareness regarding sustainability increases, manufacturers are compelled to align their products with green certifications. Additionally, advancements in technology are enhancing the quality and versatility of these compounds, making them more appealing across diverse applications.
Singapore Iron Oxides and Hydroxides Market Opportunities
Significant opportunities exist for investment in sustainable production methods, particularly in light of global shifts toward environmentally friendly practices. The increasing emphasis on high-quality, safe products in cosmetics and pharmaceuticals also presents avenues for growth. Furthermore, as Singapore positions itself as a regional hub for construction and manufacturing, the potential for export and collaboration across Southeast Asia is an avenue worth exploring.
Government Initiatives in the Singapore Iron Oxides and Hydroxides Market
The Singapore government has been proactive in promoting sustainable practices and innovation within various industries, including the iron oxides and hydroxides sector. Initiatives aimed at enhancing industrial sustainability, such as grants for research and development in green technologies, are influencing market dynamics. Additionally, public spending on infrastructure projects supports growth in the construction sector, further stimulating demand for these compounds.
Future Insights of the Singapore Iron Oxides and Hydroxides Market
Looking forward to 2026-2032, the Singapore Iron Oxides and Hydroxides Market is set to thrive amid a backdrop of continuous urbanization and infrastructural development. Innovations in product formulations aimed at sustainability will likely reshape market offerings. Furthermore, as consumer expectations evolve towards higher quality and safer materials, companies will need to adapt swiftly to maintain competitive advantage.
Singapore Iron Oxides and Hydroxides Market Latest Developments (May 2025 - June 2026)
Recent industry movements indicate a focused effort on enhancing the sustainability of iron oxide pigments. Companies are investing in technologies that minimize waste and improve production efficiency, while partnerships between manufacturers and research institutions are emerging to foster innovation. Moreover, an uptick in infrastructure projects within Singapore is expected to further boost demand for these essential compounds.
Singapore Iron Oxides and Hydroxides Market - Key Attractiveness of the Report
- 10 Years of Market Numbers
- Historical Data Starting from 2022 to 2025
- Base Year: 2025
- Forecast Data until 2032
- Key Performance Indicators Impacting the Market
- Major Upcoming Developments and Projects
Key Highlights of the Report:
- Singapore Iron Oxides and Hydroxides Market Outlook
- Market Size of Singapore Iron Oxides and Hydroxides Market, 2025
- Forecast of Singapore Iron Oxides and Hydroxides Market, 2032
- Historical Data and Forecast of Singapore Iron Oxides and Hydroxides Revenues & Volume for the Period 2022-2032F
- Singapore Iron Oxides and Hydroxides Market Trend Evolution
- Singapore Iron Oxides and Hydroxides Market Drivers and Challenges
- Singapore Iron Oxides and Hydroxides Price Trends
- Singapore Iron Oxides and Hydroxides Porter's Five Forces
- Singapore Iron Oxides and Hydroxides Industry Life Cycle
- Historical Data and Forecast of Singapore Iron Oxides and Hydroxides Market Revenues & Volume By Color for the Period 2022-2032F
- Historical Data and Forecast of Singapore Iron Oxides and Hydroxides Market Revenues & Volume By Black for the Period 2022-2032F
- Historical Data and Forecast of Singapore Iron Oxides and Hydroxides Market Revenues & Volume By Brown for the Period 2022-2032F
- Historical Data and Forecast of Singapore Iron Oxides and Hydroxides Market Revenues & Volume By Red for the Period 2022-2032F
- Historical Data and Forecast of Singapore Iron Oxides and Hydroxides Market Revenues & Volume By Yellow for the Period 2022-2032F
- Historical Data and Forecast of Singapore Iron Oxides and Hydroxides Market Revenues & Volume By Others for the Period 2022-2032F
- Historical Data and Forecast of Singapore Iron Oxides and Hydroxides Market Revenues & Volume By End Use Industries for the Period 2022-2032F
- Historical Data and Forecast of Singapore Iron Oxides and Hydroxides Market Revenues & Volume By Construction for the Period 2022-2032F
- Historical Data and Forecast of Singapore Iron Oxides and Hydroxides Market Revenues & Volume By Paper for the Period 2022-2032F
- Historical Data and Forecast of Singapore Iron Oxides and Hydroxides Market Revenues & Volume By Plastics for the Period 2022-2032F
- Historical Data and Forecast of Singapore Iron Oxides and Hydroxides Market Revenues & Volume By Paints and coatings for the Period 2022-2032F
- Historical Data and Forecast of Singapore Iron Oxides and Hydroxides Market Revenues & Volume By Automobiles for the Period 2022-2032F
- Historical Data and Forecast of Singapore Iron Oxides and Hydroxides Market Revenues & Volume By Type for the Period 2022-2032F
- Historical Data and Forecast of Singapore Iron Oxides and Hydroxides Market Revenues & Volume By Natural for the Period 2022-2032F
- Historical Data and Forecast of Singapore Iron Oxides and Hydroxides Market Revenues & Volume By Synthetic for the Period 2022-2032F
- Historical Data and Forecast of Singapore Iron Oxides and Hydroxides Market Revenues & Volume By Applications for the Period 2022-2032F
- Historical Data and Forecast of Singapore Iron Oxides and Hydroxides Market Revenues & Volume By Cosmetic for the Period 2022-2032F
- Historical Data and Forecast of Singapore Iron Oxides and Hydroxides Market Revenues & Volume By Healthcare for the Period 2022-2032F
- Historical Data and Forecast of Singapore Iron Oxides and Hydroxides Market Revenues & Volume By Pharmaceutical for the Period 2022-2032F
- Historical Data and Forecast of Singapore Iron Oxides and Hydroxides Market Revenues & Volume By Manufacturing for the Period 2022-2032F
- Historical Data and Forecast of Singapore Iron Oxides and Hydroxides Market Revenues & Volume By Mining and mineral processing for the Period 2022-2032F
- Singapore Iron Oxides and Hydroxides Import Export Trade Statistics
- Market Opportunity Assessment By Color
- Market Opportunity Assessment By End Use Industries
- Market Opportunity Assessment By Type
- Market Opportunity Assessment By Applications
- Singapore Iron Oxides and Hydroxides Top Companies Market Share
- Singapore Iron Oxides and Hydroxides Competitive Benchmarking By Technical and Operational Parameters
- Singapore Iron Oxides and Hydroxides Company Profiles
- Singapore Iron Oxides and Hydroxides Key Strategic Recommendations
Singapore Iron Oxides and Hydroxides Market - Frequently Asked Questions
The growth is primarily driven by the expansion of the construction sector and increasing demand for high-quality pigments in cosmetics and pharmaceuticals.
The pandemic led to a temporary slowdown in construction and automotive sectors, impacting demand. However, sectors like pharmaceuticals maintained some level of stability during this period.
The market size was estimated at USD 354 Million in 2025 and is projected to reach USD 467 Million by 2032, growing at a CAGR of 4.0% from 2026 to 2032.
Sustainability initiatives are significantly influencing production practices, with a focus on eco-friendly methods for manufacturing iron oxide pigments.
The largest consumers include the construction sector, automotive industry, and the cosmetics and pharmaceuticals sectors, reflecting the versatility of these compounds.
6Wresearch actively monitors the Singapore Iron Oxides and Hydroxides Market and publishes its comprehensive annual report, highlighting emerging trends, growth drivers, revenue analysis, and forecast outlook. Our insights help businesses to make data-backed strategic decisions with ongoing market dynamics. Our analysts track relevent industries related to the Singapore Iron Oxides and Hydroxides Market, allowing our clients with actionable intelligence and reliable forecasts tailored to emerging regional needs.
Yes, we provide customisation as per your requirements. To learn more, feel free to contact us on sales@6wresearch.com
1 Executive Summary |
2 Introduction |
2.1 Key Highlights of the Report |
2.2 Report Description |
2.3 Market Scope & Segmentation |
2.4 Research Methodology |
2.5 Assumptions |
3 Singapore Iron Oxides and Hydroxides Market Overview |
3.1 Singapore Country Macro Economic Indicators |
3.2 Singapore Iron Oxides and Hydroxides Market Revenues & Volume, 2022 & 2032F |
3.3 Singapore Iron Oxides and Hydroxides Market - Industry Life Cycle |
3.4 Singapore Iron Oxides and Hydroxides Market - Porter's Five Forces |
3.5 Singapore Iron Oxides and Hydroxides Market Revenues & Volume Share, By Color, 2022 & 2032F |
3.6 Singapore Iron Oxides and Hydroxides Market Revenues & Volume Share, By End Use Industries, 2022 & 2032F |
3.7 Singapore Iron Oxides and Hydroxides Market Revenues & Volume Share, By Type, 2022 & 2032F |
3.8 Singapore Iron Oxides and Hydroxides Market Revenues & Volume Share, By Applications, 2022 & 2032F |
4 Singapore Iron Oxides and Hydroxides Market Dynamics |
4.1 Impact Analysis |
4.2 Market Drivers |
4.2.1 Increasing demand for iron oxides and hydroxides in construction and infrastructure projects in Singapore |
4.2.2 Growing adoption of iron oxides and hydroxides in the manufacturing of pigments and coatings |
4.2.3 Rise in investments in research and development to enhance the quality and applications of iron oxides and hydroxides |
4.3 Market Restraints |
4.3.1 Fluctuating prices of raw materials used in the production of iron oxides and hydroxides |
4.3.2 Stringent regulations and environmental concerns related to the manufacturing process of iron oxides and hydroxides |
4.3.3 Competition from alternative materials and substitutes impacting the market growth |
5 Singapore Iron Oxides and Hydroxides Market Trends |
6 Singapore Iron Oxides and Hydroxides Market, By Types |
6.1 Singapore Iron Oxides and Hydroxides Market, By Color |
6.1.1 Overview and Analysis |
6.1.2 Singapore Iron Oxides and Hydroxides Market Revenues & Volume, By Color, 2022-2032F |
6.1.3 Singapore Iron Oxides and Hydroxides Market Revenues & Volume, By Black, 2022-2032F |
6.1.4 Singapore Iron Oxides and Hydroxides Market Revenues & Volume, By Brown, 2022-2032F |
6.1.5 Singapore Iron Oxides and Hydroxides Market Revenues & Volume, By Red, 2022-2032F |
6.1.6 Singapore Iron Oxides and Hydroxides Market Revenues & Volume, By Yellow, 2022-2032F |
6.1.7 Singapore Iron Oxides and Hydroxides Market Revenues & Volume, By Others, 2022-2032F |
6.2 Singapore Iron Oxides and Hydroxides Market, By End Use Industries |
6.2.1 Overview and Analysis |
6.2.2 Singapore Iron Oxides and Hydroxides Market Revenues & Volume, By Construction, 2022-2032F |
6.2.3 Singapore Iron Oxides and Hydroxides Market Revenues & Volume, By Paper, 2022-2032F |
6.2.4 Singapore Iron Oxides and Hydroxides Market Revenues & Volume, By Plastics, 2022-2032F |
6.2.5 Singapore Iron Oxides and Hydroxides Market Revenues & Volume, By Paints and coatings, 2022-2032F |
6.2.6 Singapore Iron Oxides and Hydroxides Market Revenues & Volume, By Automobiles, 2022-2032F |
6.3 Singapore Iron Oxides and Hydroxides Market, By Type |
6.3.1 Overview and Analysis |
6.3.2 Singapore Iron Oxides and Hydroxides Market Revenues & Volume, By Natural, 2022-2032F |
6.3.3 Singapore Iron Oxides and Hydroxides Market Revenues & Volume, By Synthetic, 2022-2032F |
6.4 Singapore Iron Oxides and Hydroxides Market, By Applications |
6.4.1 Overview and Analysis |
6.4.2 Singapore Iron Oxides and Hydroxides Market Revenues & Volume, By Cosmetic, 2022-2032F |
6.4.3 Singapore Iron Oxides and Hydroxides Market Revenues & Volume, By Healthcare, 2022-2032F |
6.4.4 Singapore Iron Oxides and Hydroxides Market Revenues & Volume, By Pharmaceutical, 2022-2032F |
6.4.5 Singapore Iron Oxides and Hydroxides Market Revenues & Volume, By Manufacturing, 2022-2032F |
6.4.6 Singapore Iron Oxides and Hydroxides Market Revenues & Volume, By Mining and mineral processing, 2022-2032F |
7 Singapore Iron Oxides and Hydroxides Market Import-Export Trade Statistics |
7.1 Singapore Iron Oxides and Hydroxides Market Export to Major Countries |
7.2 Singapore Iron Oxides and Hydroxides Market Imports from Major Countries |
8 Singapore Iron Oxides and Hydroxides Market Key Performance Indicators |
8.1 Number of new construction projects utilizing iron oxides and hydroxides |
8.2 Percentage of market share captured by iron oxides and hydroxides in the pigment and coating industry |
8.3 Research and development investment in innovative applications for iron oxides and hydroxides |
9 Singapore Iron Oxides and Hydroxides Market - Opportunity Assessment |
9.1 Singapore Iron Oxides and Hydroxides Market Opportunity Assessment, By Color, 2022 & 2032F |
9.2 Singapore Iron Oxides and Hydroxides Market Opportunity Assessment, By End Use Industries, 2022 & 2032F |
9.3 Singapore Iron Oxides and Hydroxides Market Opportunity Assessment, By Type, 2022 & 2032F |
9.4 Singapore Iron Oxides and Hydroxides Market Opportunity Assessment, By Applications, 2022 & 2032F |
10 Singapore Iron Oxides and Hydroxides Market - Competitive Landscape |
10.1 Singapore Iron Oxides and Hydroxides Market Revenue Share, By Companies, 2025 |
10.2 Singapore Iron Oxides and Hydroxides Market Competitive Benchmarking, By Operating and Technical Parameters |
11 Company Profiles |
12 Recommendations |
13 Disclaimer |
Global Go To Market Strategy - 2030
Export potential enables firms to identify high-growth global markets with greater confidence by combining advanced trade intelligence with a structured quantitative methodology. The framework analyzes emerging demand trends and country-level import patterns while integrating macroeconomic and trade datasets such as GDP and population forecasts, bilateral import–export flows, tariff structures, elasticity differentials between developed and developing economies, geographic distance, and import demand projections. Using weighted trade values from 2020–2024 as the base period to project country-to-country export potential for 2030, these inputs are operationalized through calculated drivers such as gravity model parameters, tariff impact factors, and projected GDP per-capita growth. Through an analysis of hidden potentials, demand hotspots, and market conditions that are most favorable to success, this method enables firms to focus on target countries, maximize returns, and global expansion with data, backed by accuracy.
By factoring in the projected importer demand gap that is currently unmet and could be potential opportunity, it identifies the potential for the Exporter (Country) among 190 countries, against the general trade analysis, which identifies the biggest importer or exporter.
To discover high-growth global markets and optimize your business strategy:
Click Here
Pricing
- Single User License$ 1,995
- Department License$ 2,400
- Site License$ 3,120
- Global License$ 3,795

Leadership Perspectives from Industry Events
Search
Thought Leadership and Analyst Meet


Our Clients
6WResearch In News
- India Air Conditioner Market Set for Strong Rebound in 2026 After Weather-Led Correction and GST-Driven Recovery: 6Wresearch
- ADAS in India: How Automatic Emergency Braking, Blind Spot Detection & Driver Monitoring are Transforming Road Safety
- Doha a strategic location for EV manufacturing hub: IPA Qatar
- Demand for luxury TVs surging in the GCC, says Samsung
- Empowering Growth: The Thriving Journey of Bangladesh’s Cable Industry
- Demand for luxury TVs surging in the GCC, says Samsung
Latest Reports
- Nicaragua RPG Gaming Market (2026-2032)
- New Zealand RPG Gaming Market (2026-2032)
- Netherlands RPG Gaming Market (2026-2032)
- Nauru RPG Gaming Market (2026-2032)
- Namibia RPG Gaming Market (2026-2032)
- Mozambique RPG Gaming Market (2026-2032)
- Montenegro RPG Gaming Market (2026-2032)
- Mongolia RPG Gaming Market (2026-2032)
- Monaco RPG Gaming Market (2026-2032)
- Micronesia RPG Gaming Market (2026-2032)
Industry Events and Analyst Meet

EV India Expo 2026

HIMTEX 2026

India Refining Summit 2026

India EV Show 2026

EV tech India Expo 2026
Whitepaper
- Middle East & Africa Commercial Security Market Click here to view more.
- Middle East & Africa Fire Safety Systems & Equipment Market Click here to view more.
- GCC Drone Market Click here to view more.
- Middle East Lighting Fixture Market Click here to view more.
- GCC Physical & Perimeter Security Market Click here to view more.