Singapore Kaolin Market (2026-2032) Outlook | Share, Size, Growth, Industry, Value, Revenue, Companies, Analysis, Trends & Forecast
Market Forecast By Process (Water-washed, Airfloat, Calcined, Delaminated, Surface-modified & Unprocessed), By End-users (Ceramics & Sanitarywares, Fiberglass, Paints & Coatings, Rubber, Adhesives & Sealants, Plastics, Others) And Competitive Landscape
| Product Code: ETC087826 | Publication Date: Jun 2021 | Updated Date: Mar 2026 | Product Type: Report | |
| Publisher: 6Wresearch | Author: Ravi Bhandari | No. of Pages: 70 | No. of Figures: 35 | No. of Tables: 5 |
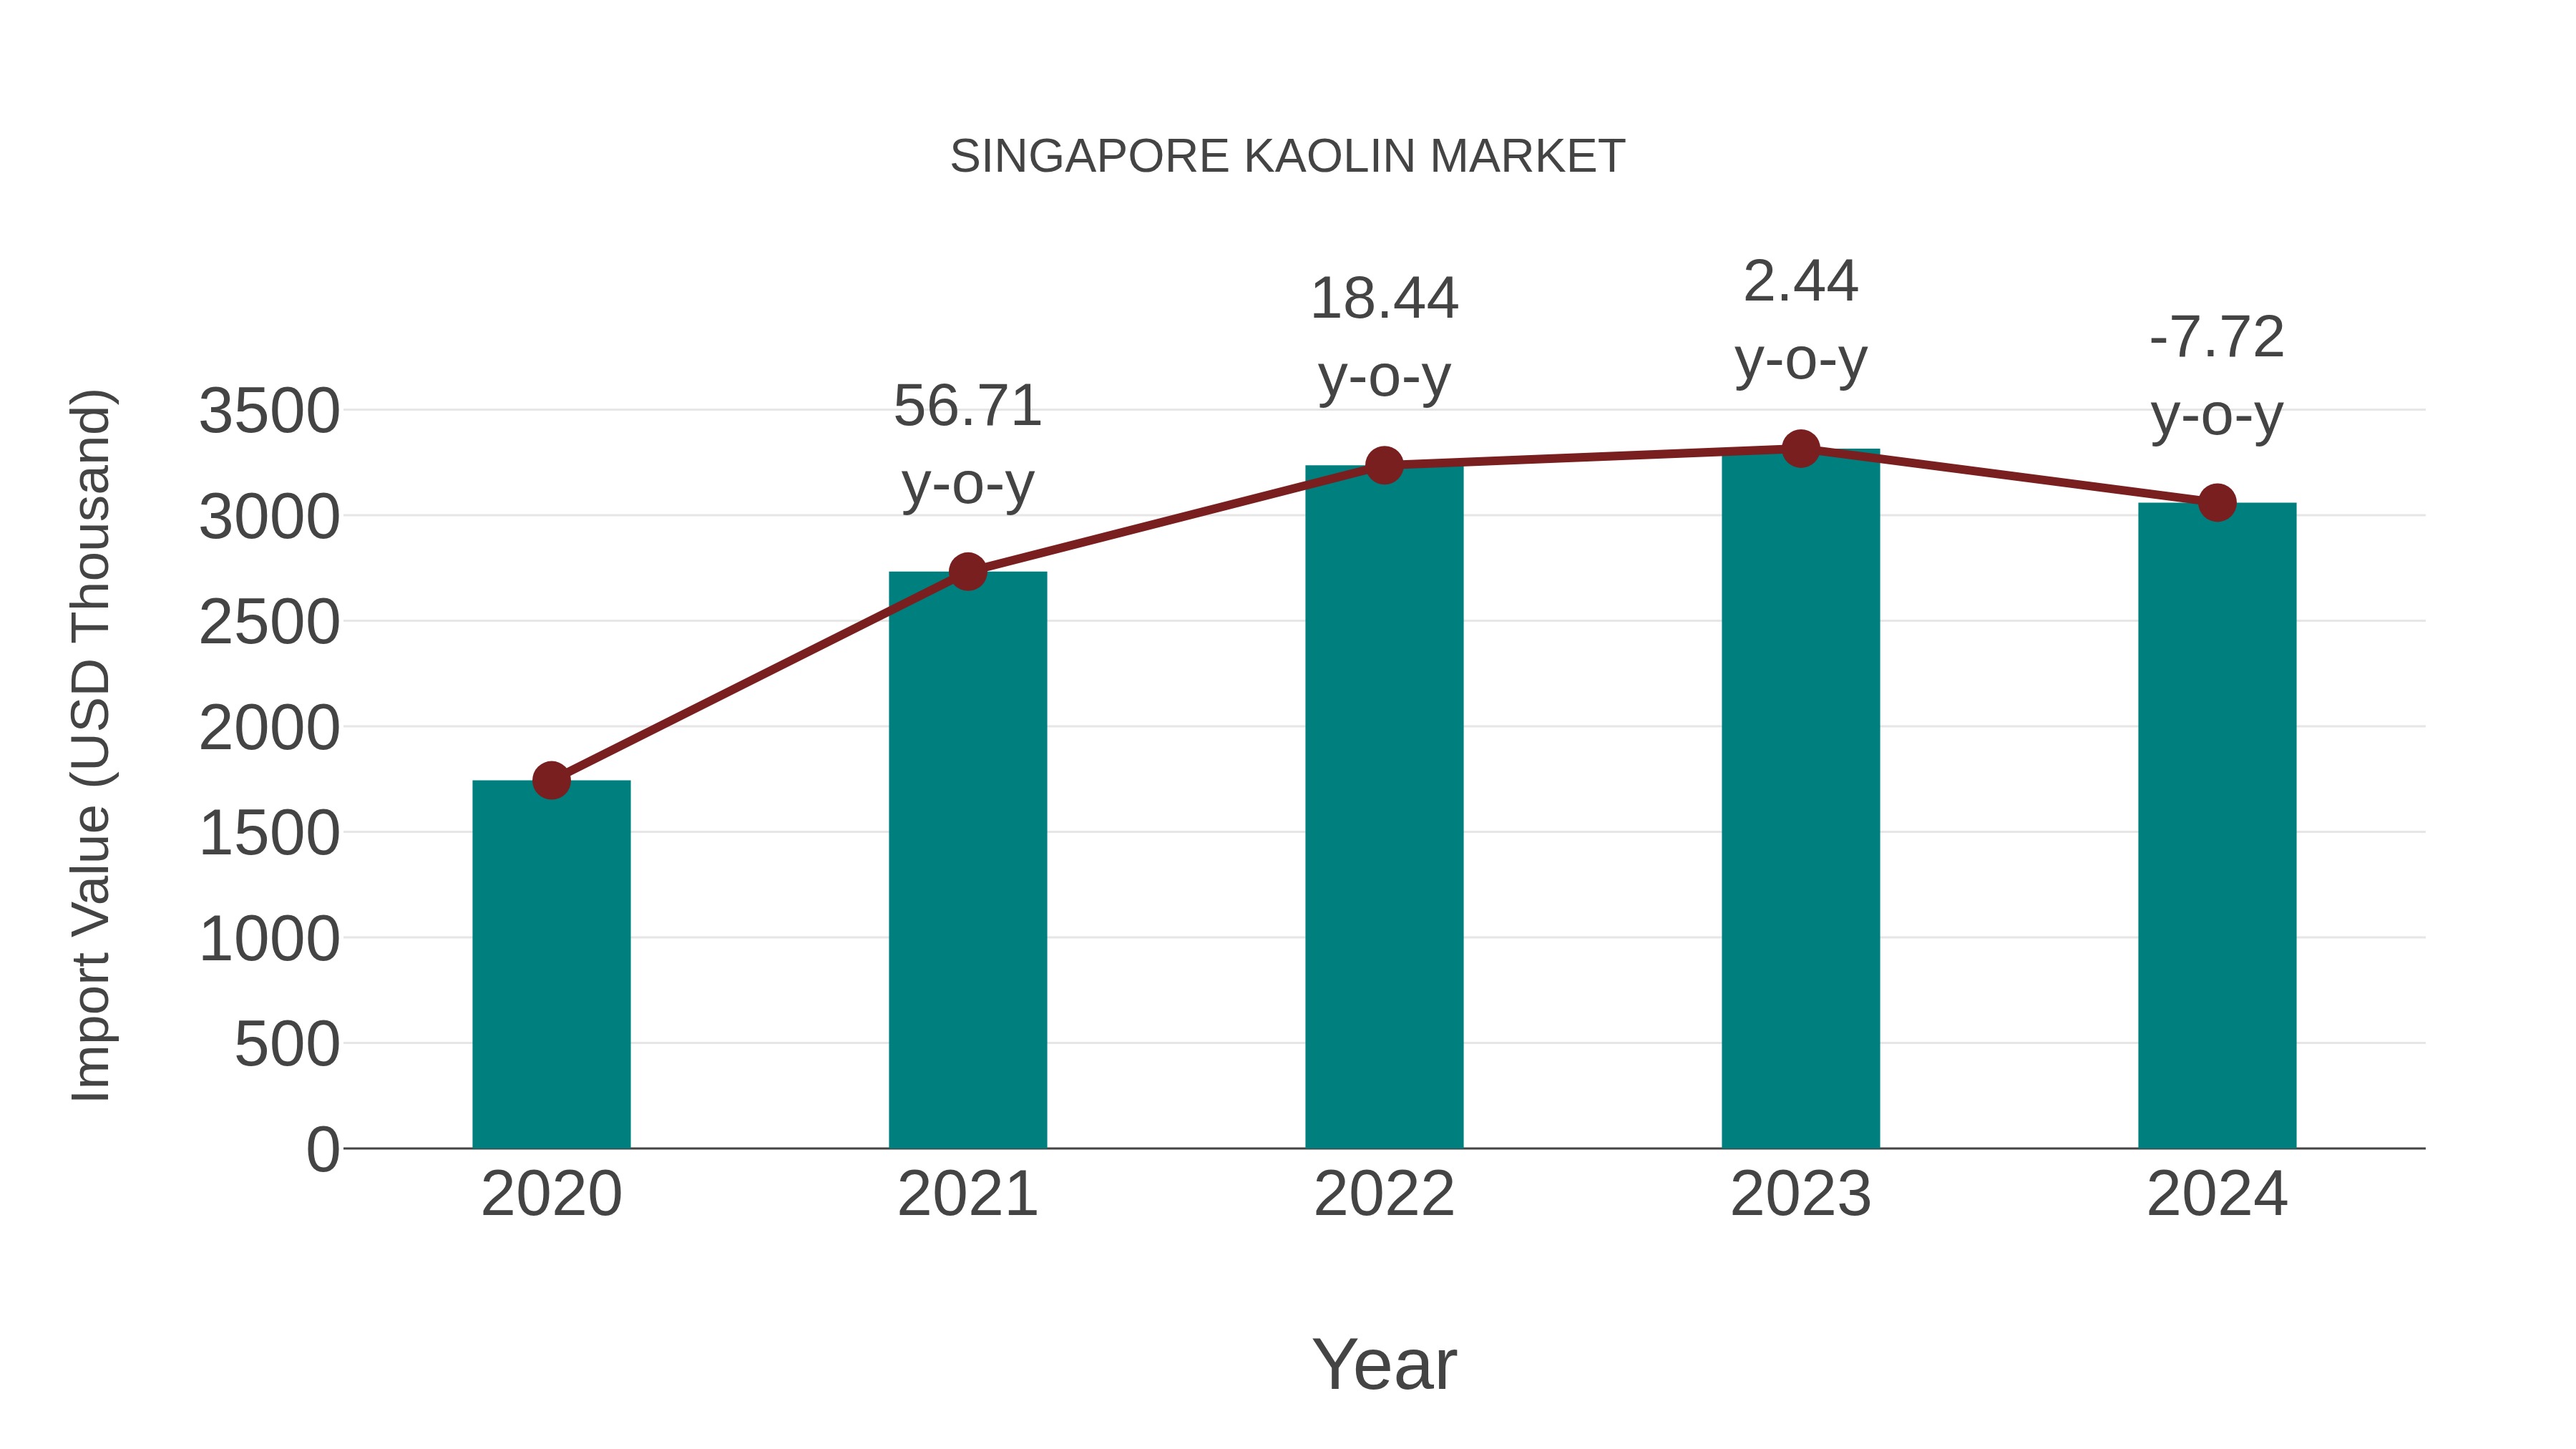
Singapore Kaolin Market: Import Trend Analysis
In the Singapore kaolin market, the import trend experienced a decline from 2023 to 2024, with a growth rate of -7.72%. However, the compound annual growth rate (CAGR) for the period 2020-2024 stood at a positive 15.09%. This fluctuation could be attributed to shifts in global demand dynamics or changes in trade policies impacting import momentum.
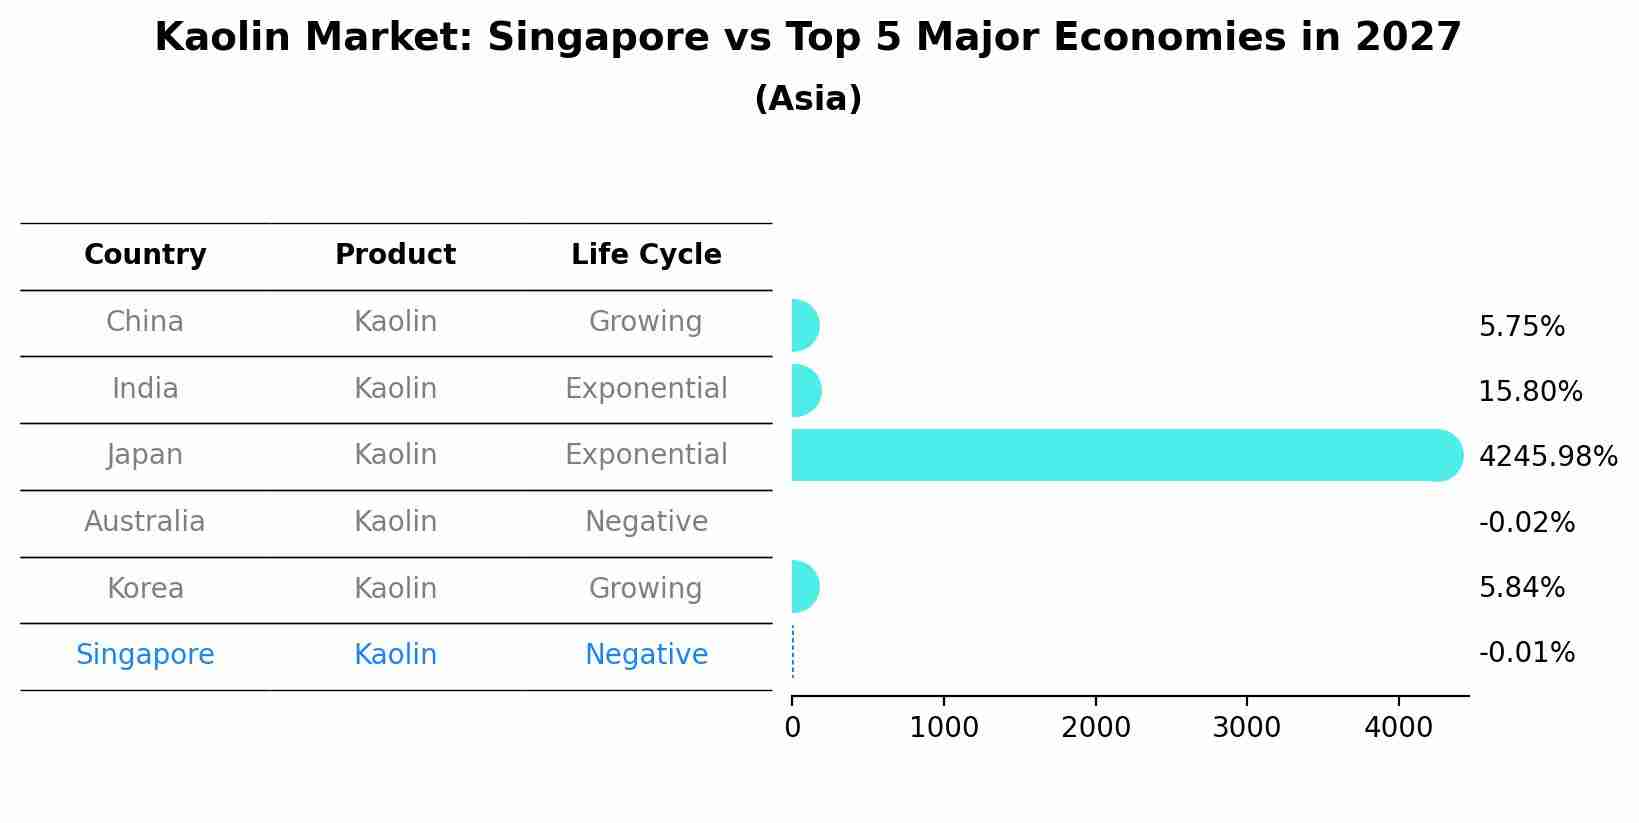
Kaolin Market: Singapore vs Top 5 Major Economies in 2027 (Asia)
By 2027, Singapore's Kaolin market is forecasted to achieve a negative growth rate of -0.01%, with China leading the Asia region, followed by India, Japan, Australia and South Korea.
Singapore Kaolin Market Synopsis
Kaolin, a clay mineral, is used in various industries, including ceramics, paper, and cosmetics. The Singapore kaolin market is influenced by global demand for these products and advancements in kaolin processing technology. Market outlook depends on factors like shifts in consumer preferences for eco-friendly products, developments in cosmetic formulations, and changes in paper manufacturing practices. Companies in the kaolin sector should adapt to changing market dynamics and maintain quality standards to meet industry needs.
Drivers of the Market
The kaolin market in Singapore is poised for growth due to its extensive applications across various industries. One of the primary drivers is the construction sector, where kaolin is used in the production of high-quality ceramics, tiles, and concrete. Singapore construction industry remains vibrant, with numerous residential and commercial projects underway. Moreover, kaolin`s use in the paper and packaging industry as a coating material for improved print quality and moisture resistance contributes to its growing demand. As e-commerce and packaging industries continue to expand, the kaolin market is expected to thrive.
Challenges of the Market
The kaolin market in Singapore encounters challenges related to its reliance on imports. Singapore lacks domestic kaolin deposits, making it heavily reliant on foreign suppliers. This dependence exposes the industry to supply chain disruptions and price fluctuations in the global market. Additionally, the kaolin market faces competition from alternative materials used in industries such as ceramics and paper manufacturing. To thrive in this market, Singaporean businesses must focus on securing stable supply chains and developing unique value propositions for their kaolin products.
COVID-19 Impact on the Market
The Singapore Kaolin market faced challenges during the pandemic as the construction and ceramics industries experienced slowdowns. With social distancing measures and restrictions on gatherings, construction projects were delayed or canceled, leading to reduced demand for kaolin. Companies in this sector had to explore new applications and export opportunities to mitigate the impact. As the construction sector gradually resumes activity, the market is expected to recover, but uncertainties persist, impacting the overall outlook.
Key Players in the Market
The Singapore kaolin market is projected to grow steadily due to its widespread use in various applications, including ceramics and paints. Leading companies operating in this market are BASF SE, Imerys S.A., and Thiele Kaolin Company, known for their high-quality kaolin products and strong global presence.
Key Highlights of the Report:
- Singapore Kaolin Market Outlook
- Market Size of Singapore Kaolin Market, 2025
- Forecast of Singapore Kaolin Market, 2032
- Historical Data and Forecast of Singapore Kaolin Revenues & Volume for the Period 2022-2032F
- Singapore Kaolin Market Trend Evolution
- Singapore Kaolin Market Drivers and Challenges
- Singapore Kaolin Price Trends
- Singapore Kaolin Porter's Five Forces
- Singapore Kaolin Industry Life Cycle
- Historical Data and Forecast of Singapore Kaolin Market Revenues & Volume By Process for the Period 2022-2032F
- Historical Data and Forecast of Singapore Kaolin Market Revenues & Volume By Water-washed for the Period 2022-2032F
- Historical Data and Forecast of Singapore Kaolin Market Revenues & Volume By Airfloat for the Period 2022-2032F
- Historical Data and Forecast of Singapore Kaolin Market Revenues & Volume By Calcined for the Period 2022-2032F
- Historical Data and Forecast of Singapore Kaolin Market Revenues & Volume By Delaminated for the Period 2022-2032F
- Historical Data and Forecast of Singapore Kaolin Market Revenues & Volume By Surface-modified & Unprocessed for the Period 2022-2032F
- Historical Data and Forecast of Singapore Kaolin Market Revenues & Volume By End-users for the Period 2022-2032F
- Historical Data and Forecast of Singapore Kaolin Market Revenues & Volume By Ceramics & Sanitarywares for the Period 2022-2032F
- Historical Data and Forecast of Singapore Kaolin Market Revenues & Volume By Fiberglass for the Period 2022-2032F
- Historical Data and Forecast of Singapore Kaolin Market Revenues & Volume By Paints & Coatings for the Period 2022-2032F
- Historical Data and Forecast of Singapore Kaolin Market Revenues & Volume By Rubber for the Period 2022-2032F
- Historical Data and Forecast of Singapore Kaolin Market Revenues & Volume By Adhesives & Sealants for the Period 2022-2032F
- Historical Data and Forecast of Singapore Kaolin Market Revenues & Volume By Plastics for the Period 2022-2032F
- Historical Data and Forecast of Singapore Kaolin Market Revenues & Volume By Others for the Period 2022-2032F
- Singapore Kaolin Import Export Trade Statistics
- Market Opportunity Assessment By Process
- Market Opportunity Assessment By End-users
- Singapore Kaolin Top Companies Market Share
- Singapore Kaolin Competitive Benchmarking By Technical and Operational Parameters
- Singapore Kaolin Company Profiles
- Singapore Kaolin Key Strategic Recommendations
Singapore Kaolin Market (2026-2032): FAQs
6Wresearch actively monitors the Singapore Kaolin Market and publishes its comprehensive annual report, highlighting emerging trends, growth drivers, revenue analysis, and forecast outlook. Our insights help businesses to make data-backed strategic decisions with ongoing market dynamics. Our analysts track relevent industries related to the Singapore Kaolin Market, allowing our clients with actionable intelligence and reliable forecasts tailored to emerging regional needs.
Yes, we provide customisation as per your requirements. To learn more, feel free to contact us on sales@6wresearch.com
1 Executive Summary |
2 Introduction |
2.1 Key Highlights of the Report |
2.2 Report Description |
2.3 Market Scope & Segmentation |
2.4 Research Methodology |
2.5 Assumptions |
3 Singapore Kaolin Market Overview |
3.1 Singapore Country Macro Economic Indicators |
3.2 Singapore Kaolin Market Revenues & Volume, 2022 & 2032F |
3.3 Singapore Kaolin Market - Industry Life Cycle |
3.4 Singapore Kaolin Market - Porter's Five Forces |
3.5 Singapore Kaolin Market Revenues & Volume Share, By Process, 2022 & 2032F |
3.6 Singapore Kaolin Market Revenues & Volume Share, By End-users, 2022 & 2032F |
4 Singapore Kaolin Market Dynamics |
4.1 Impact Analysis |
4.2 Market Drivers |
4.3 Market Restraints |
5 Singapore Kaolin Market Trends |
6 Singapore Kaolin Market, By Types |
6.1 Singapore Kaolin Market, By Process |
6.1.1 Overview and Analysis |
6.1.2 Singapore Kaolin Market Revenues & Volume, By Process, 2022-2032F |
6.1.3 Singapore Kaolin Market Revenues & Volume, By Water-washed, 2022-2032F |
6.1.4 Singapore Kaolin Market Revenues & Volume, By Airfloat, 2022-2032F |
6.1.5 Singapore Kaolin Market Revenues & Volume, By Calcined, 2022-2032F |
6.1.6 Singapore Kaolin Market Revenues & Volume, By Delaminated, 2022-2032F |
6.1.7 Singapore Kaolin Market Revenues & Volume, By Surface-modified & Unprocessed, 2022-2032F |
6.2 Singapore Kaolin Market, By End-users |
6.2.1 Overview and Analysis |
6.2.2 Singapore Kaolin Market Revenues & Volume, By Ceramics & Sanitarywares, 2022-2032F |
6.2.3 Singapore Kaolin Market Revenues & Volume, By Fiberglass, 2022-2032F |
6.2.4 Singapore Kaolin Market Revenues & Volume, By Paints & Coatings, 2022-2032F |
6.2.5 Singapore Kaolin Market Revenues & Volume, By Rubber, 2022-2032F |
6.2.6 Singapore Kaolin Market Revenues & Volume, By Adhesives & Sealants, 2022-2032F |
6.2.7 Singapore Kaolin Market Revenues & Volume, By Plastics, 2022-2032F |
7 Singapore Kaolin Market Import-Export Trade Statistics |
7.1 Singapore Kaolin Market Export to Major Countries |
7.2 Singapore Kaolin Market Imports from Major Countries |
8 Singapore Kaolin Market Key Performance Indicators |
9 Singapore Kaolin Market - Opportunity Assessment |
9.1 Singapore Kaolin Market Opportunity Assessment, By Process, 2022 & 2032F |
9.2 Singapore Kaolin Market Opportunity Assessment, By End-users, 2022 & 2032F |
10 Singapore Kaolin Market - Competitive Landscape |
10.1 Singapore Kaolin Market Revenue Share, By Companies, 2025 |
10.2 Singapore Kaolin Market Competitive Benchmarking, By Operating and Technical Parameters |
11 Company Profiles |
12 Recommendations |
13 Disclaimer |
Global Go To Market Strategy - 2030
Export potential enables firms to identify high-growth global markets with greater confidence by combining advanced trade intelligence with a structured quantitative methodology. The framework analyzes emerging demand trends and country-level import patterns while integrating macroeconomic and trade datasets such as GDP and population forecasts, bilateral import–export flows, tariff structures, elasticity differentials between developed and developing economies, geographic distance, and import demand projections. Using weighted trade values from 2020–2024 as the base period to project country-to-country export potential for 2030, these inputs are operationalized through calculated drivers such as gravity model parameters, tariff impact factors, and projected GDP per-capita growth. Through an analysis of hidden potentials, demand hotspots, and market conditions that are most favorable to success, this method enables firms to focus on target countries, maximize returns, and global expansion with data, backed by accuracy.
By factoring in the projected importer demand gap that is currently unmet and could be potential opportunity, it identifies the potential for the Exporter (Country) among 190 countries, against the general trade analysis, which identifies the biggest importer or exporter.
To discover high-growth global markets and optimize your business strategy:
Click Here
Pricing
- Single User License$ 1,995
- Department License$ 2,400
- Site License$ 3,120
- Global License$ 3,795

Leadership Perspectives from Industry Events
Search
Thought Leadership and Analyst Meet


Our Clients
6WResearch In News
- India Air Conditioner Market Set for Strong Rebound in 2026 After Weather-Led Correction and GST-Driven Recovery: 6Wresearch
- ADAS in India: How Automatic Emergency Braking, Blind Spot Detection & Driver Monitoring are Transforming Road Safety
- Doha a strategic location for EV manufacturing hub: IPA Qatar
- Demand for luxury TVs surging in the GCC, says Samsung
- Empowering Growth: The Thriving Journey of Bangladesh’s Cable Industry
- Demand for luxury TVs surging in the GCC, says Samsung
Latest Reports
- Poland Fire Protection Systems Market (2026-2032)
- Cape Verde Portable Hand-Thrown Extinguisher Market (2026-2032)
- Canada Portable Hand-Thrown Extinguisher Market (2026-2032)
- Cameroon Portable Hand-Thrown Extinguisher Market (2026-2032)
- Burundi Portable Hand-Thrown Extinguisher Market (2026-2032)
- Burkina Faso Portable Hand-Thrown Extinguisher Market (2026-2032)
- Bulgaria Portable Hand-Thrown Extinguisher Market (2026-2032)
- Brunei Portable Hand-Thrown Extinguisher Market (2026-2032)
- Botswana Portable Hand-Thrown Extinguisher Market (2026-2032)
- Bosnia and Herzegovina Portable Hand-Thrown Extinguisher Market (2026-2032)
Industry Events and Analyst Meet

HIMTEX 2026

India Refining Summit 2026

India EV Show 2026

EV tech India Expo 2026

Auto Tech Asia 2026
Whitepaper
- Middle East & Africa Commercial Security Market Click here to view more.
- Middle East & Africa Fire Safety Systems & Equipment Market Click here to view more.
- GCC Drone Market Click here to view more.
- Middle East Lighting Fixture Market Click here to view more.
- GCC Physical & Perimeter Security Market Click here to view more.