Singapore Pet Care Products Market (2020-2026) | Companies, Value, Revenue, Growth, Industry, Forecast, Size, Share, COVID-19 IMPACT, Trends, Analysis & Outlook
Market Forecast By Pet Types (Dog, Cat, Fish , Bird, Horse, Others), By Product Types (Pet Food, Veterinary Care, Pet Grooming Products, Others), By Ingredient Type (Synthetic, Organic), By Distribution Channels (Stores, E-Commerce) And Competitive Landscape
| Product Code: ETC006167 | Publication Date: Jun 2023 | Updated Date: Feb 2026 | Product Type: Report | |
| Publisher: 6Wresearch | Author: Ravi Bhandari | No. of Pages: 70 | No. of Figures: 35 | No. of Tables: 5 |
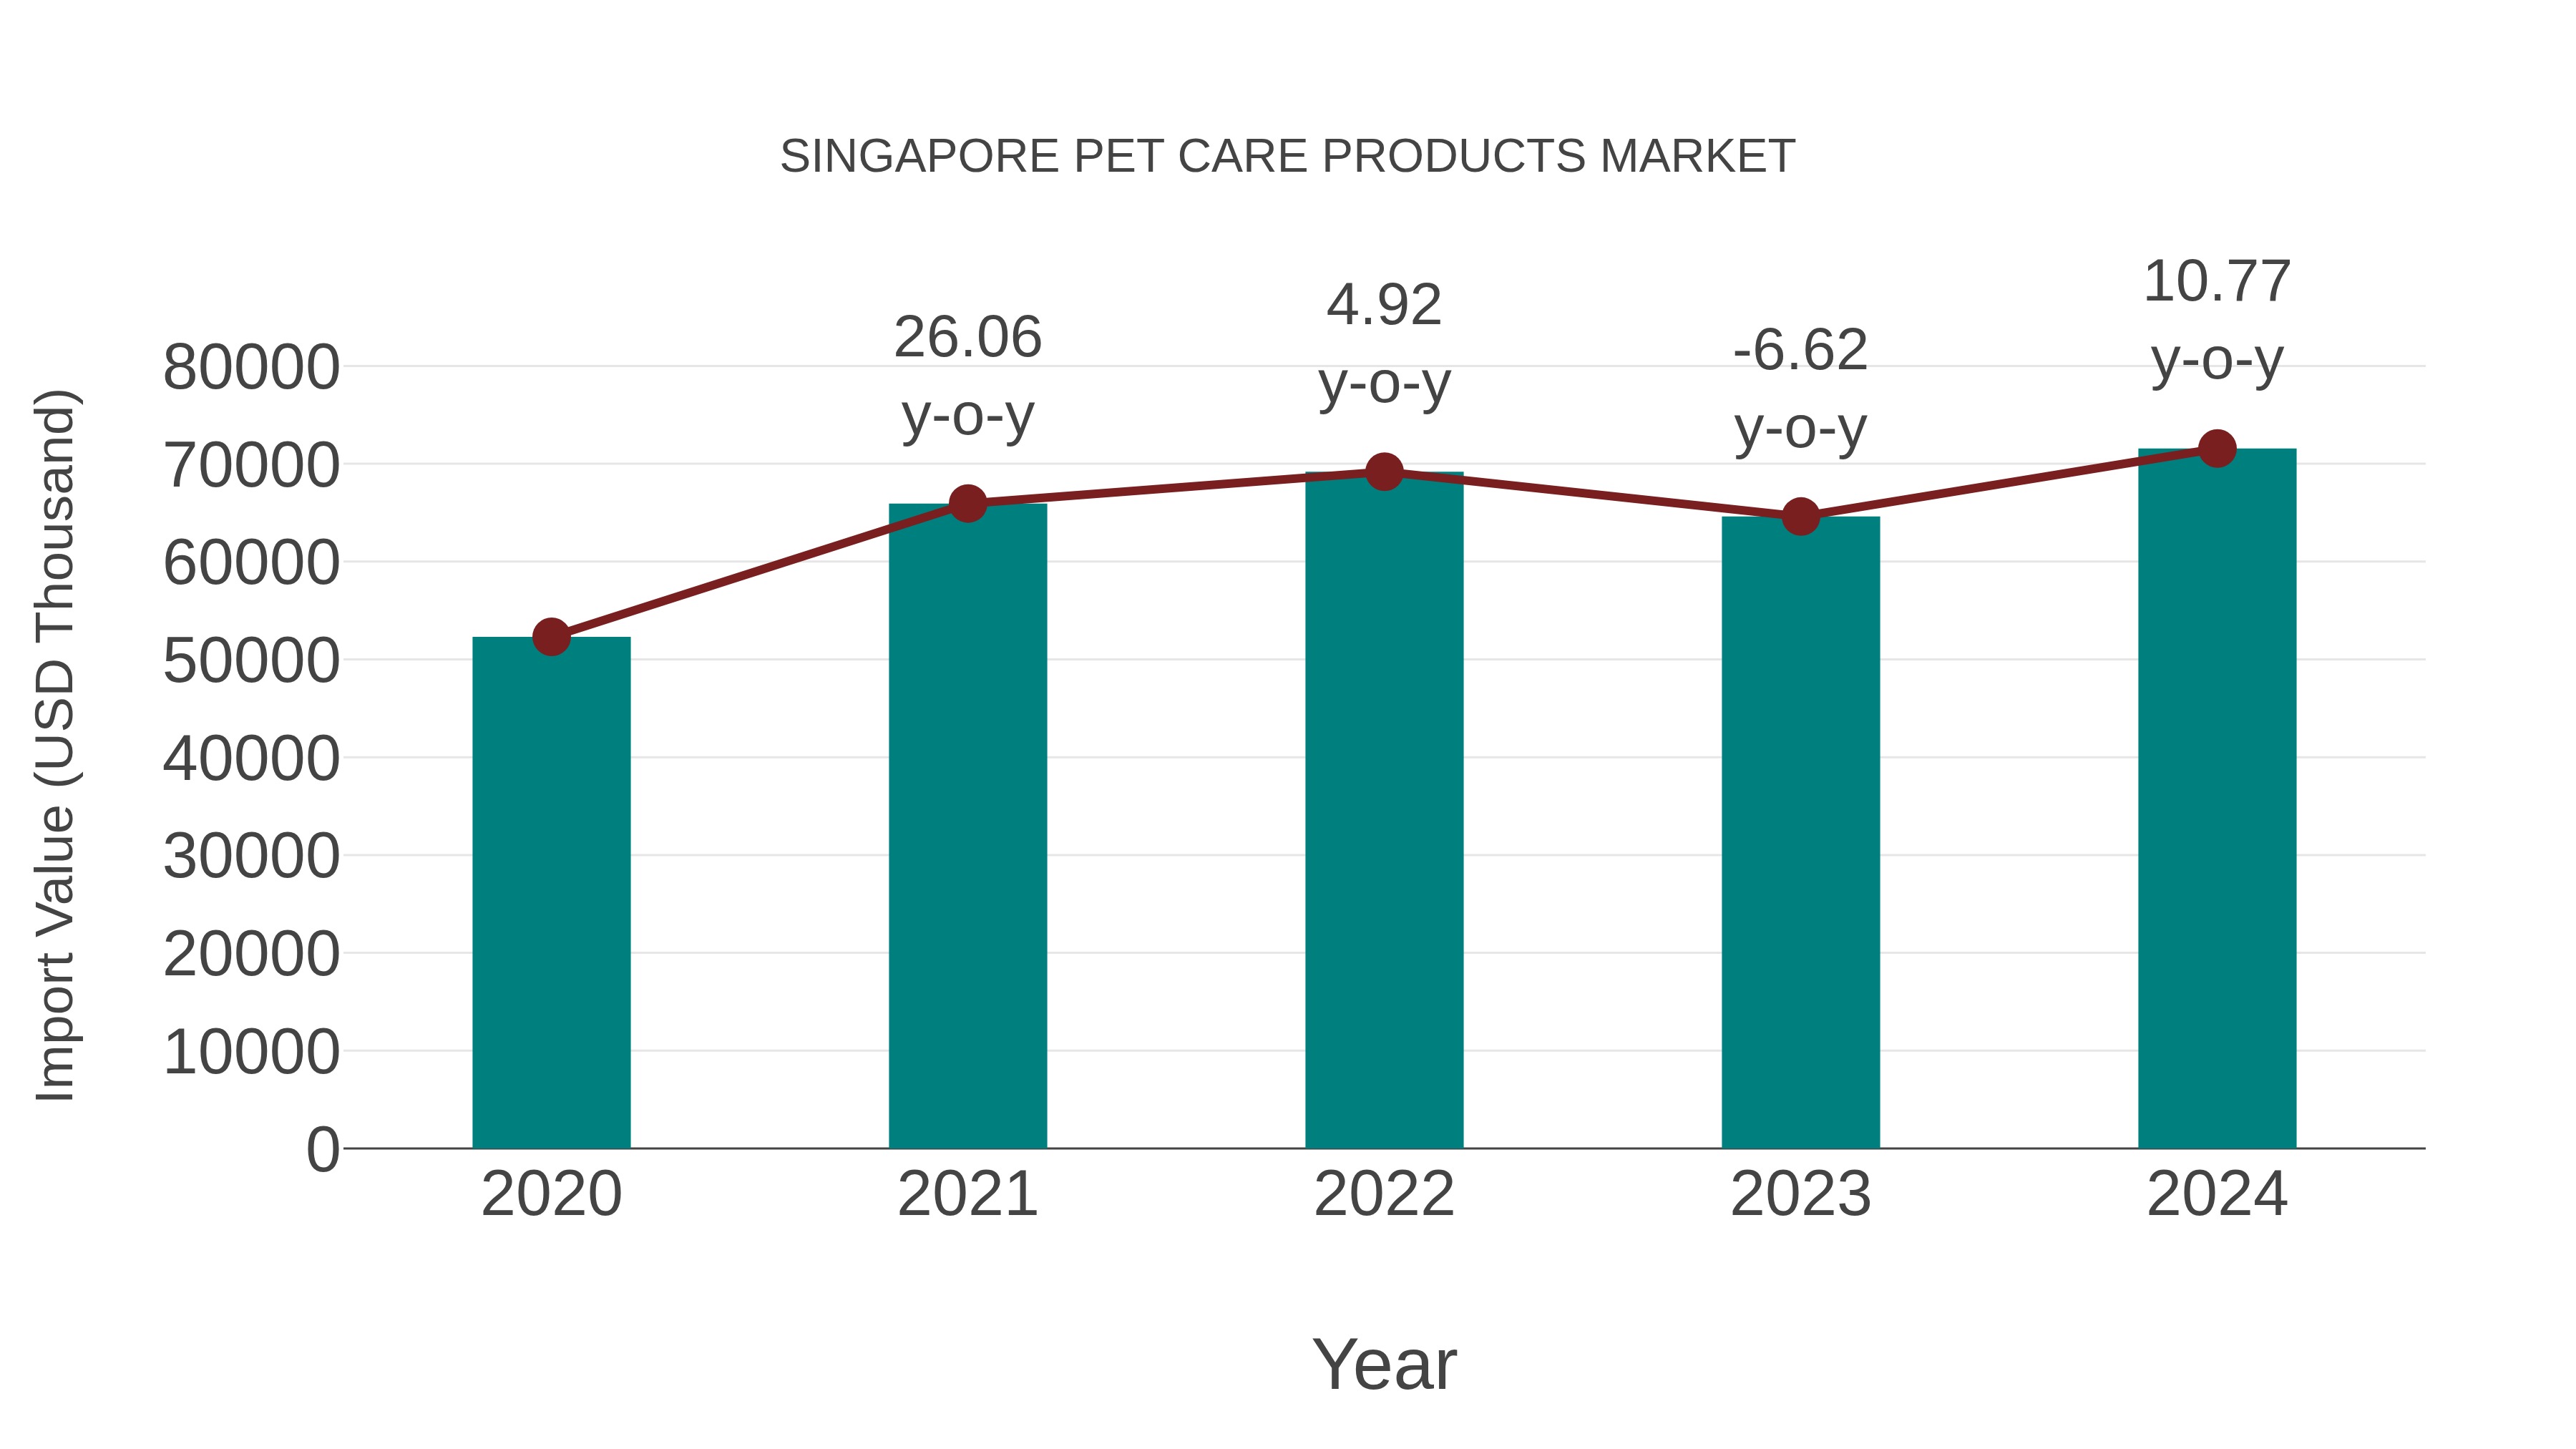
Singapore Pet Care Products Market: Import Trend Analysis
In 2024, Singapore`s pet care products market saw a notable increase in imports. The trend indicated a growing demand for pet-related items in the country, reflecting changing consumer preferences towards pet ownership and care.
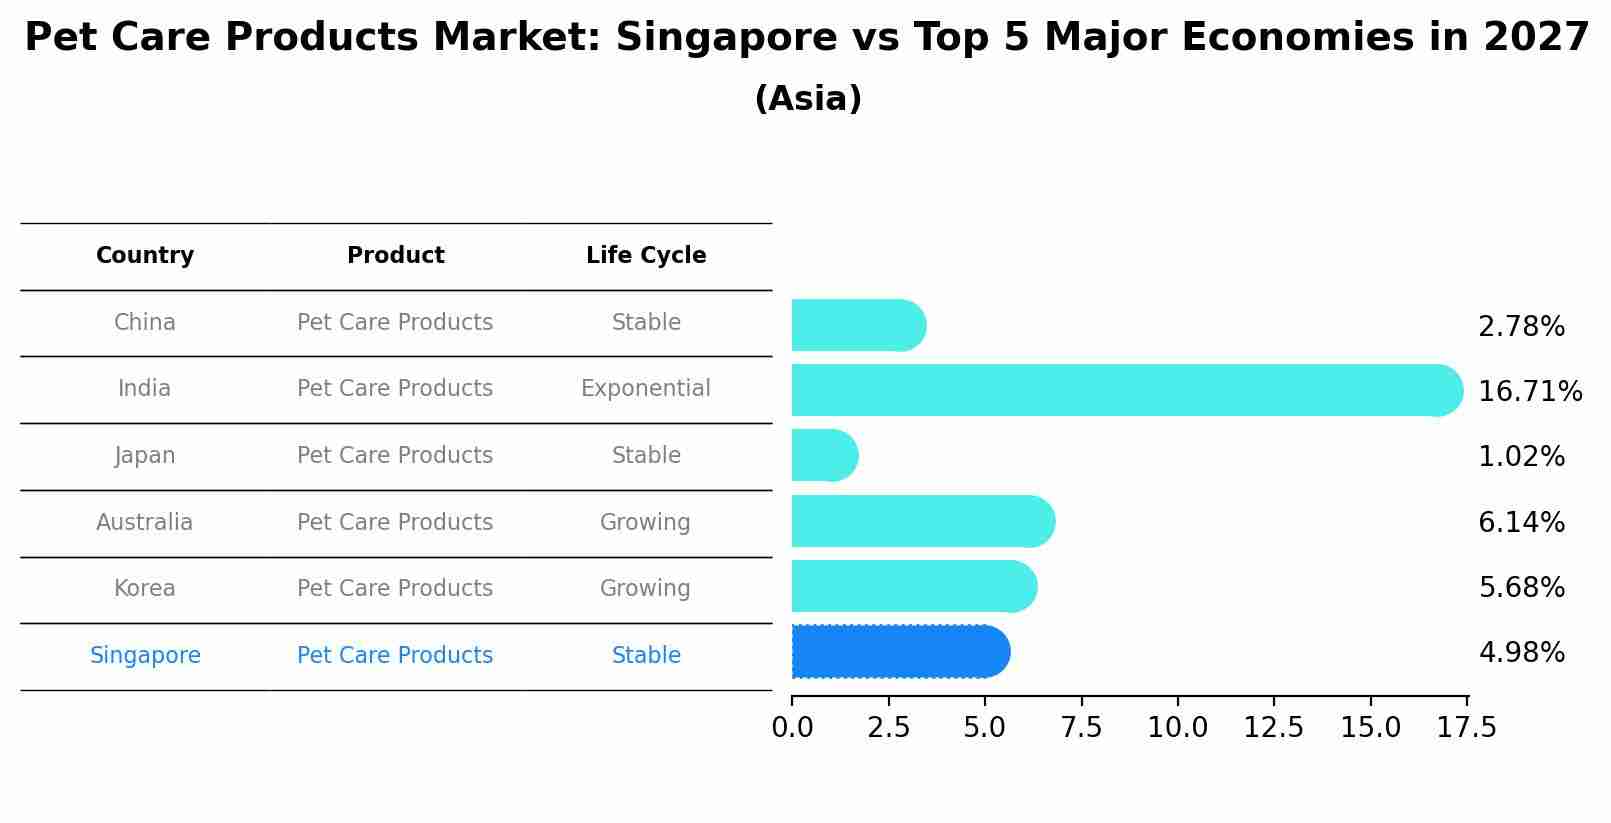
Pet Care Products Market: Singapore vs Top 5 Major Economies in 2027 (Asia)
The Pet Care Products market in Singapore is projected to grow at a stable growth rate of 4.98% by 2027, highlighting the country's increasing focus on advanced technologies within the Asia region, where China holds the dominant position, followed closely by India, Japan, Australia and South Korea, shaping overall regional demand.
Singapore Pet Care Products Market Synopsis
The Singapore pet care products market is expected to witness significant growth over the forecast period, owing to rising demand for pet care products, increasing awareness about animal welfare and health, and easy availability of such products. In addition, technological advancements in pet food production are also likely to boost market growth. Growing adoption of pets as a result of changing lifestyles will further fuel the demand for various pet care products in Singapore. Furthermore, innovations in product packaging due to stringent regulations on labeling have opened new opportunities for manufacturers operating in the country's pet care product market
Major players operating within the Singaporean pet care industry include Purina PetCare (Nestle), Mars Petcare Inc., Hill's Pet Nutrition Inc., Procter & Gamble Co., among others. Foreign companies continue to dominate the domestic market owing to their strong brand recognition and presence across multiple channels including offline supermarkets/hypermarkets and online stores such as Amazon or Lazada. The vendors are focusing on offering innovative marketing strategies by launching promotional campaigns via advertising platforms like television or radio media which can help them increase their consumer base significantly.
Key Highlights of the Report:
- Singapore Pet Care Products Market Outlook
- Market Size of Singapore Pet Care Products Market, 2019
- Forecast of Singapore Pet Care Products Market, 2026
- Historical Data and Forecast of Singapore Pet Care Products Revenues & Volume for the Period 2016 - 2026
- Singapore Pet Care Products Market Trend Evolution
- Singapore Pet Care Products Market Drivers and Challenges
- Singapore Pet Care Products Price Trends
- Singapore Pet Care Products Porter's Five Forces
- Singapore Pet Care Products Industry Life Cycle
- Historical Data and Forecast of Singapore Pet Care Products Market Revenues & Volume By Pet Types for the Period 2016 - 2026
- Historical Data and Forecast of Singapore Pet Care Products Market Revenues & Volume By Dog for the Period 2016 - 2026
- Historical Data and Forecast of Singapore Pet Care Products Market Revenues & Volume By Cat for the Period 2016 - 2026
- Historical Data and Forecast of Singapore Pet Care Products Market Revenues & Volume By Fish for the Period 2016 - 2026
- Historical Data and Forecast of Singapore Pet Care Products Market Revenues & Volume By Bird for the Period 2016 - 2026
- Historical Data and Forecast of Singapore Pet Care Products Market Revenues & Volume By Horse for the Period 2016 - 2026
- Historical Data and Forecast of Singapore Pet Care Products Market Revenues & Volume By Others for the Period 2016 - 2026
- Historical Data and Forecast of Singapore Pet Care Products Market Revenues & Volume By Product Types for the Period 2016 - 2026
- Historical Data and Forecast of Singapore Pet Care Products Market Revenues & Volume By Pet Food for the Period 2016 - 2026
- Historical Data and Forecast of Singapore Pet Care Products Market Revenues & Volume By Veterinary Care for the Period 2016 - 2026
- Historical Data and Forecast of Singapore Pet Care Products Market Revenues & Volume By Pet Grooming Products for the Period 2016 - 2026
- Historical Data and Forecast of Singapore Pet Care Products Market Revenues & Volume By Others for the Period 2016 - 2026
- Historical Data and Forecast of Singapore Pet Care Products Market Revenues & Volume By Ingredient Type for the Period 2016 - 2026
- Historical Data and Forecast of Singapore Pet Care Products Market Revenues & Volume By Synthetic for the Period 2016 - 2026
- Historical Data and Forecast of Singapore Pet Care Products Market Revenues & Volume By Organic for the Period 2016 - 2026
- Historical Data and Forecast of Singapore Pet Care Products Market Revenues & Volume By Distribution Channels for the Period 2016 - 2026
- Historical Data and Forecast of Singapore Pet Care Products Market Revenues & Volume By Stores for the Period 2016 - 2026
- Historical Data and Forecast of Singapore Pet Care Products Market Revenues & Volume By E-Commerce for the Period 2016 - 2026
- Singapore Pet Care Products Import Export Trade Statistics
- Market Opportunity Assessment By Pet Types
- Market Opportunity Assessment By Product Types
- Market Opportunity Assessment By Ingredient Type
- Market Opportunity Assessment By Distribution Channels
- Singapore Pet Care Products Top Companies Market Share
- Singapore Pet Care Products Competitive Benchmarking By Technical and Operational Parameters
- Singapore Pet Care Products Company Profiles
- Singapore Pet Care Products Key Strategic Recommendations
Frequently Asked Questions About the Market Study (FAQs):
6Wresearch actively monitors the Singapore Pet Care Products Market and publishes its comprehensive annual report, highlighting emerging trends, growth drivers, revenue analysis, and forecast outlook. Our insights help businesses to make data-backed strategic decisions with ongoing market dynamics. Our analysts track relevent industries related to the Singapore Pet Care Products Market, allowing our clients with actionable intelligence and reliable forecasts tailored to emerging regional needs.
Yes, we provide customisation as per your requirements. To learn more, feel free to contact us on sales@6wresearch.com
1 Executive Summary |
2 Introduction |
2.1 Key Highlights of the Report |
2.2 Report Description |
2.3 Market Scope & Segmentation |
2.4 Research Methodology |
2.5 Assumptions |
3 Singapore Pet Care Products Market Overview |
3.1 Singapore Country Macro Economic Indicators |
3.2 Singapore Pet Care Products Market Revenues & Volume, 2019 & 2026F |
3.3 Singapore Pet Care Products Market - Industry Life Cycle |
3.4 Singapore Pet Care Products Market - Porter's Five Forces |
3.5 Singapore Pet Care Products Market Revenues & Volume Share, By Pet Types, 2019 & 2026F |
3.6 Singapore Pet Care Products Market Revenues & Volume Share, By Product Types, 2019 & 2026F |
3.7 Singapore Pet Care Products Market Revenues & Volume Share, By Ingredient Type, 2019 & 2026F |
3.8 Singapore Pet Care Products Market Revenues & Volume Share, By Distribution Channels, 2019 & 2026F |
4 Singapore Pet Care Products Market Dynamics |
4.1 Impact Analysis |
4.2 Market Drivers |
4.3 Market Restraints |
5 Singapore Pet Care Products Market Trends |
6 Singapore Pet Care Products Market, By Types |
6.1 Singapore Pet Care Products Market, By Pet Types |
6.1.1 Overview and Analysis |
6.1.2 Singapore Pet Care Products Market Revenues & Volume, By Pet Types, 2016 - 2026F |
6.1.3 Singapore Pet Care Products Market Revenues & Volume, By Dog, 2016 - 2026F |
6.1.4 Singapore Pet Care Products Market Revenues & Volume, By Cat, 2016 - 2026F |
6.1.5 Singapore Pet Care Products Market Revenues & Volume, By Fish , 2016 - 2026F |
6.1.6 Singapore Pet Care Products Market Revenues & Volume, By Bird, 2016 - 2026F |
6.1.7 Singapore Pet Care Products Market Revenues & Volume, By Horse, 2016 - 2026F |
6.1.8 Singapore Pet Care Products Market Revenues & Volume, By Others, 2016 - 2026F |
6.2 Singapore Pet Care Products Market, By Product Types |
6.2.1 Overview and Analysis |
6.2.2 Singapore Pet Care Products Market Revenues & Volume, By Pet Food, 2016 - 2026F |
6.2.3 Singapore Pet Care Products Market Revenues & Volume, By Veterinary Care, 2016 - 2026F |
6.2.4 Singapore Pet Care Products Market Revenues & Volume, By Pet Grooming Products, 2016 - 2026F |
6.2.5 Singapore Pet Care Products Market Revenues & Volume, By Others, 2016 - 2026F |
6.3 Singapore Pet Care Products Market, By Ingredient Type |
6.3.1 Overview and Analysis |
6.3.2 Singapore Pet Care Products Market Revenues & Volume, By Synthetic, 2016 - 2026F |
6.3.3 Singapore Pet Care Products Market Revenues & Volume, By Organic, 2016 - 2026F |
6.4 Singapore Pet Care Products Market, By Distribution Channels |
6.4.1 Overview and Analysis |
6.4.2 Singapore Pet Care Products Market Revenues & Volume, By Stores, 2016 - 2026F |
6.4.3 Singapore Pet Care Products Market Revenues & Volume, By E-Commerce, 2016 - 2026F |
7 Singapore Pet Care Products Market Import-Export Trade Statistics |
7.1 Singapore Pet Care Products Market Export to Major Countries |
7.2 Singapore Pet Care Products Market Imports from Major Countries |
8 Singapore Pet Care Products Market Key Performance Indicators |
9 Singapore Pet Care Products Market - Opportunity Assessment |
9.1 Singapore Pet Care Products Market Opportunity Assessment, By Pet Types, 2019 & 2026F |
9.2 Singapore Pet Care Products Market Opportunity Assessment, By Product Types, 2019 & 2026F |
9.3 Singapore Pet Care Products Market Opportunity Assessment, By Ingredient Type, 2019 & 2026F |
9.4 Singapore Pet Care Products Market Opportunity Assessment, By Distribution Channels, 2019 & 2026F |
10 Singapore Pet Care Products Market - Competitive Landscape |
10.1 Singapore Pet Care Products Market Revenue Share, By Companies, 2019 |
10.2 Singapore Pet Care Products Market Competitive Benchmarking, By Operating and Technical Parameters |
11 Company Profiles |
12 Recommendations |
13 Disclaimer |
Global Go To Market Strategy - 2030
Export potential enables firms to identify high-growth global markets with greater confidence by combining advanced trade intelligence with a structured quantitative methodology. The framework analyzes emerging demand trends and country-level import patterns while integrating macroeconomic and trade datasets such as GDP and population forecasts, bilateral import–export flows, tariff structures, elasticity differentials between developed and developing economies, geographic distance, and import demand projections. Using weighted trade values from 2020–2024 as the base period to project country-to-country export potential for 2030, these inputs are operationalized through calculated drivers such as gravity model parameters, tariff impact factors, and projected GDP per-capita growth. Through an analysis of hidden potentials, demand hotspots, and market conditions that are most favorable to success, this method enables firms to focus on target countries, maximize returns, and global expansion with data, backed by accuracy.
By factoring in the projected importer demand gap that is currently unmet and could be potential opportunity, it identifies the potential for the Exporter (Country) among 190 countries, against the general trade analysis, which identifies the biggest importer or exporter.
To discover high-growth global markets and optimize your business strategy:
Click Here
Pricing
- Single User License$ 1,995
- Department License$ 2,400
- Site License$ 3,120
- Global License$ 3,795

Leadership Perspectives from Industry Events
Search
Thought Leadership and Analyst Meet


Our Clients
6WResearch In News
- India Air Conditioner Market Set for Strong Rebound in 2026 After Weather-Led Correction and GST-Driven Recovery: 6Wresearch
- ADAS in India: How Automatic Emergency Braking, Blind Spot Detection & Driver Monitoring are Transforming Road Safety
- Doha a strategic location for EV manufacturing hub: IPA Qatar
- Demand for luxury TVs surging in the GCC, says Samsung
- Empowering Growth: The Thriving Journey of Bangladesh’s Cable Industry
- Demand for luxury TVs surging in the GCC, says Samsung
Latest Reports
- Nicaragua RPG Gaming Market (2026-2032)
- New Zealand RPG Gaming Market (2026-2032)
- Netherlands RPG Gaming Market (2026-2032)
- Nauru RPG Gaming Market (2026-2032)
- Namibia RPG Gaming Market (2026-2032)
- Mozambique RPG Gaming Market (2026-2032)
- Montenegro RPG Gaming Market (2026-2032)
- Mongolia RPG Gaming Market (2026-2032)
- Monaco RPG Gaming Market (2026-2032)
- Micronesia RPG Gaming Market (2026-2032)
Industry Events and Analyst Meet

EV India Expo 2026

HIMTEX 2026

India Refining Summit 2026

India EV Show 2026

EV tech India Expo 2026
Whitepaper
- Middle East & Africa Commercial Security Market Click here to view more.
- Middle East & Africa Fire Safety Systems & Equipment Market Click here to view more.
- GCC Drone Market Click here to view more.
- Middle East Lighting Fixture Market Click here to view more.
- GCC Physical & Perimeter Security Market Click here to view more.