Singapore Physical Security Market Size & Growth Rate (2026-2032)
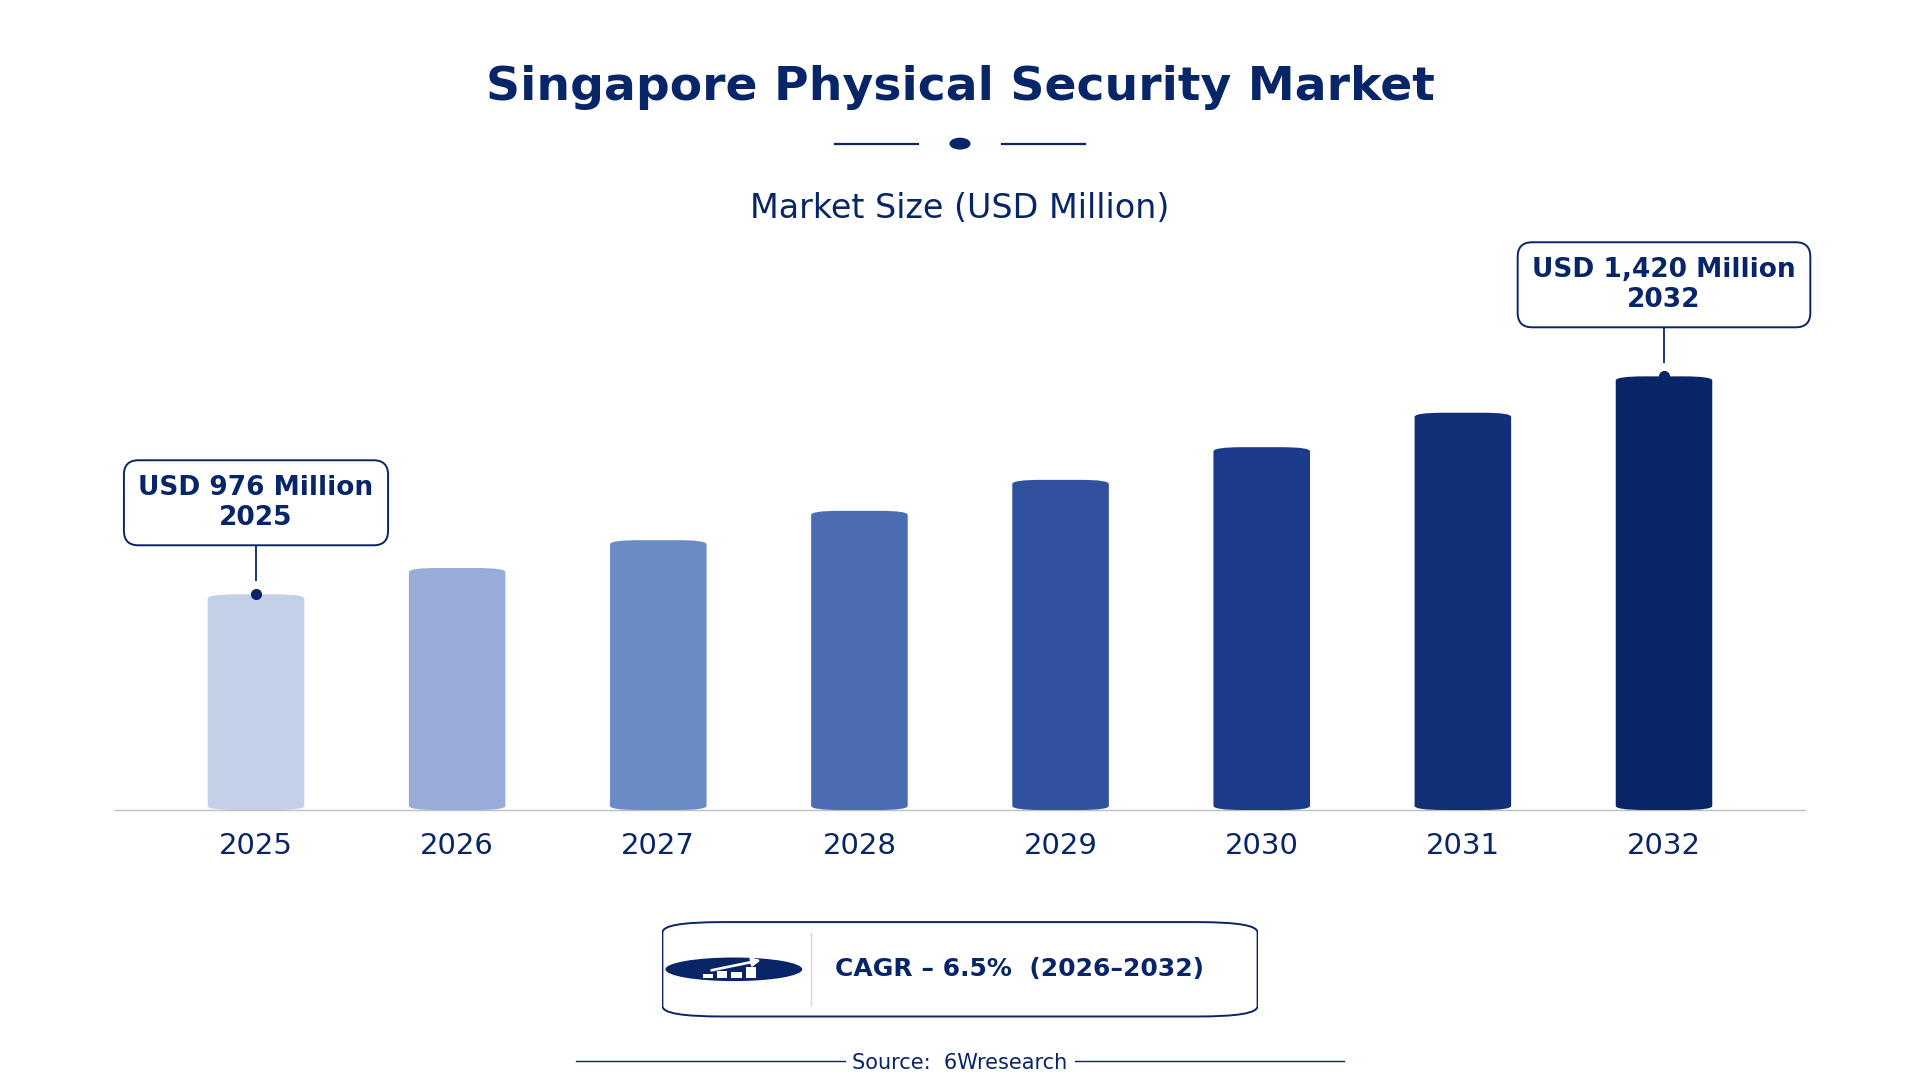
The Singapore Physical Security Market was estimated at USD 976 Million in 2025 and is projected to reach USD 1420 Million by 2032, growing at a CAGR of 6.5% from 2026 to 2032.
Singapore Physical Security Market Synopsis
Recent developments in the Singapore Physical Security Market showcase a trend toward advanced technology integration, reflecting an increase in public safety demands. As the nation commits to enhancing its infrastructure and urban environments, the market is set on a trajectory of significant growth.
In particular, the surge in smart city initiatives has prompted both public and private sectors to adopt cutting-edge security solutions. Organizations across various industries are ramping up investments in surveillance and access control systems to align with heightened security expectations.
Singapore Physical Security Market Year-wise Growth Rate and Key Drivers
This graph illustrates the annual growth rates of the Singapore Physical Security Market from 2021 to 2032, highlighting a steady upward trajectory and projected expansion over the forecast period.
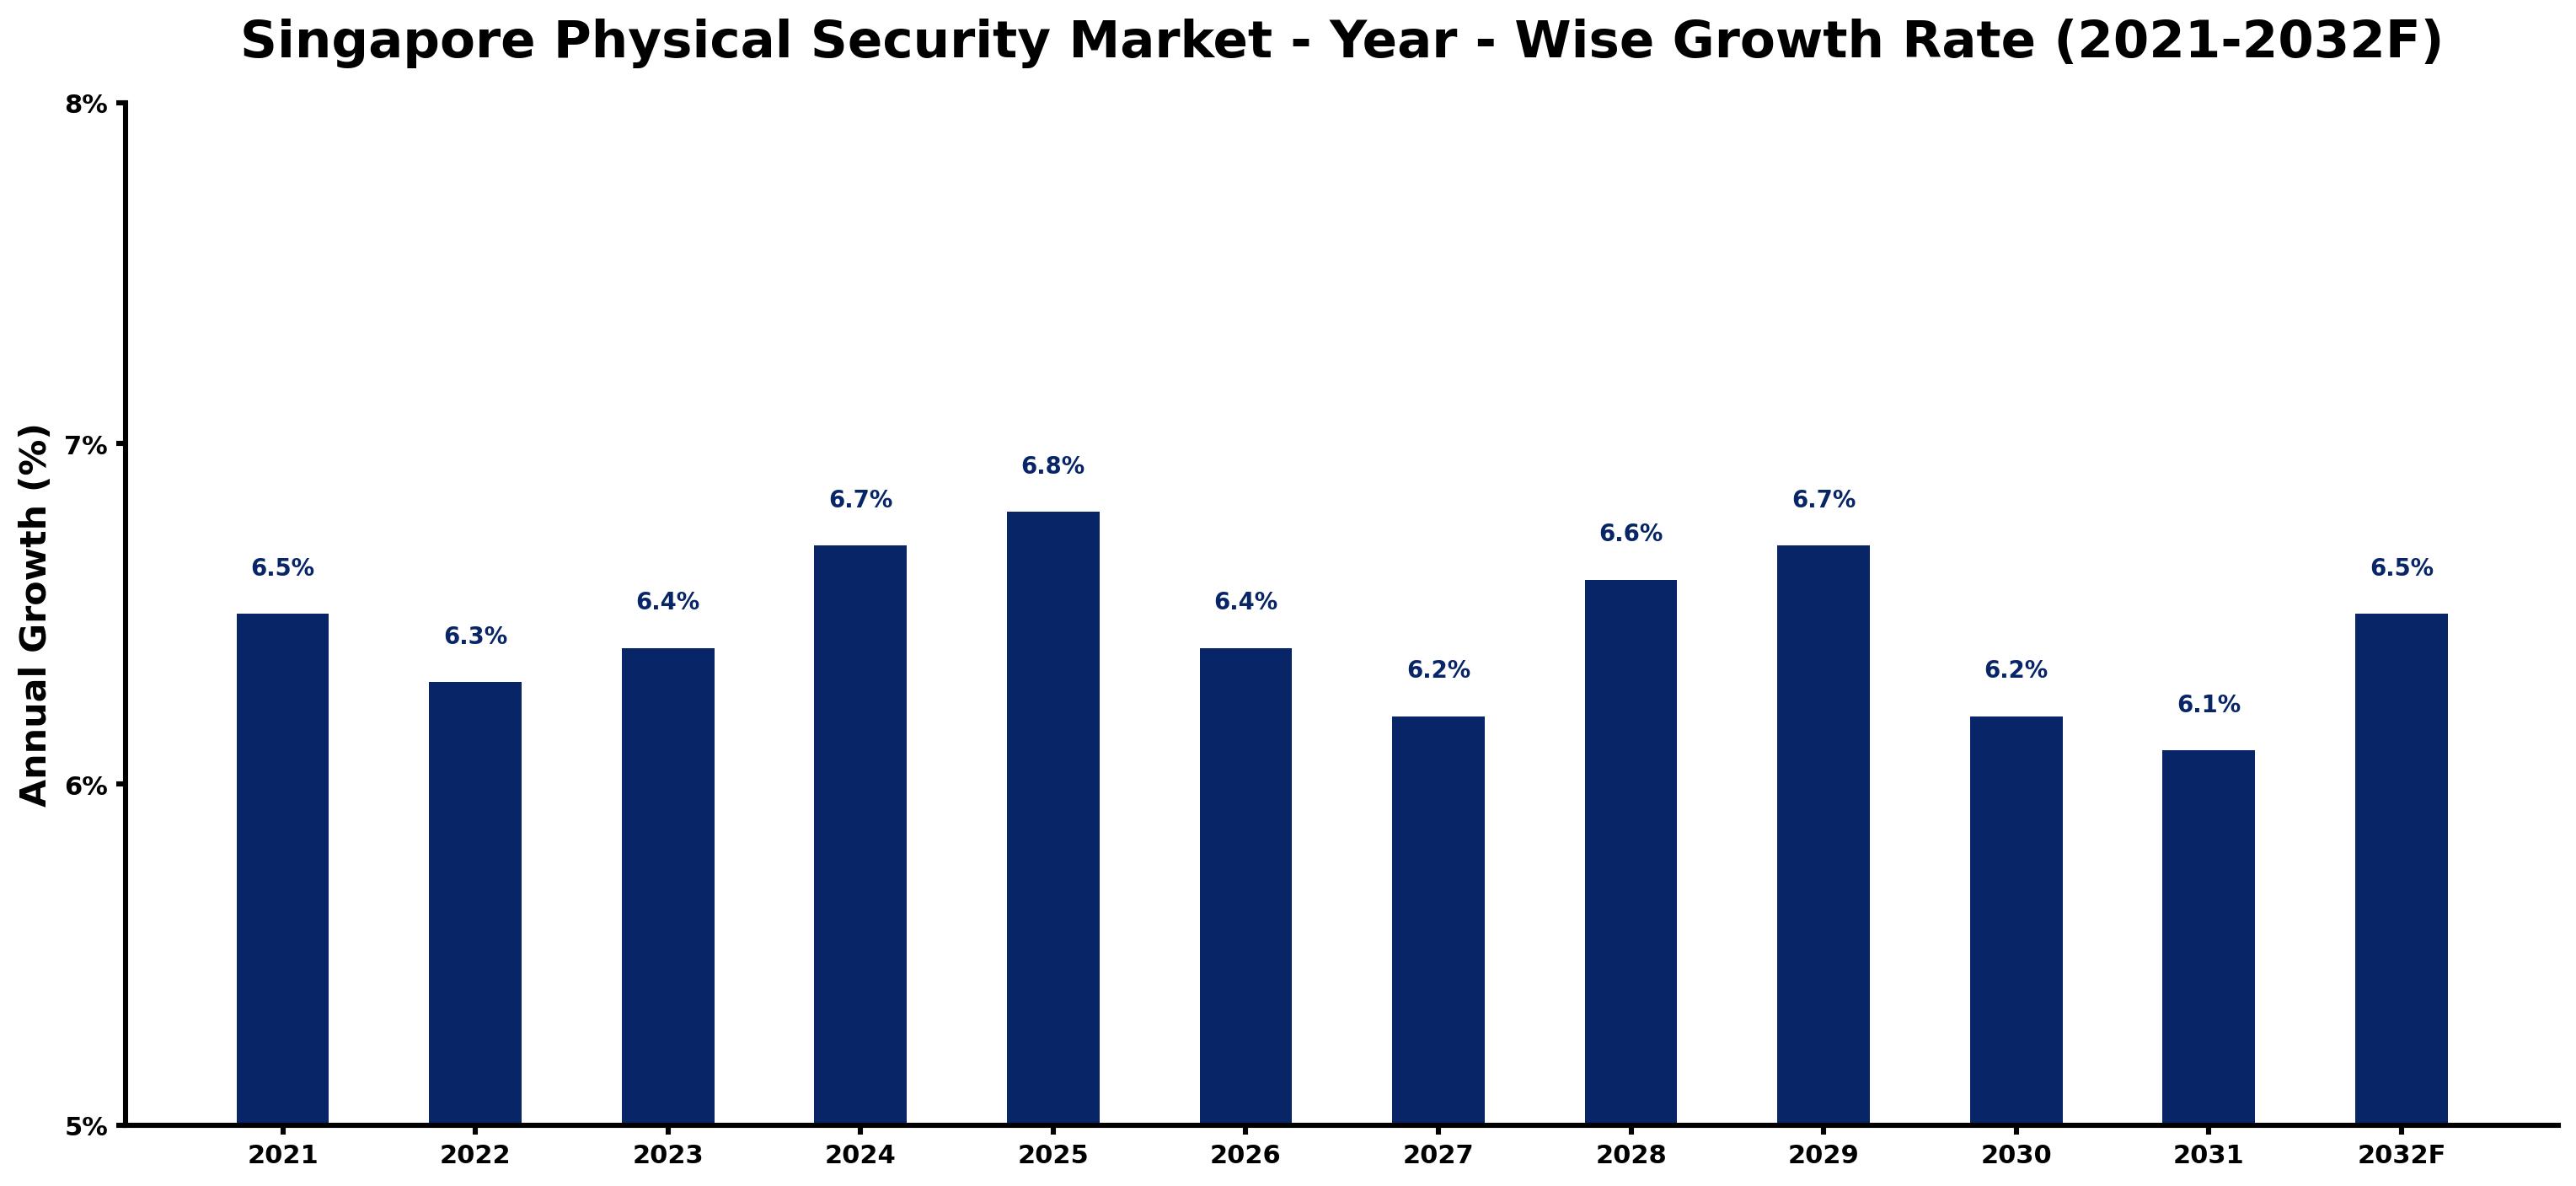
The table below presents the year‑wise growth rates along with the key drivers influencing the market
| Year | Growth Rate | Major Drivers |
| 2021 | 6.5% | Heightened security measures post-COVID for public safety. |
| 2022 | 6.3% | Increased investments in smart surveillance systems by businesses. |
| 2023 | 6.4% | Launch of national cybersecurity strategy enhancing physical security. |
| 2024 | 6.7% | Government grants for upgrading security systems in schools. |
| 2025 | 6.8% | Growth in high-value asset protection demand from logistics sector. |
| 2026 | 6.4% | Emergence of AI-driven security analytics in retail industry. |
| 2027 | 6.2% | Boost in residential security system installations amid urbanization. |
| 2028 | 6.6% | Integration of IoT technology in public safety initiatives. |
| 2029 | 6.7% | Increased public events necessitating comprehensive security solutions. |
| 2030 | 6.2% | Sector collaboration for enhanced safety standards in events. |
| 2031 | 6.1% | Rising concerns over data privacy boosting physical security adoption. |
| 2032 | 6.5% | Strengthening of laws mandating security measures in businesses. |
Note: Market size estimations and growth projections presented in this report are based on 6Wresearch's proprietary forecasting methodology, utilizing the latest available industry data, government publications, and primary research inputs.
Singapore Physical Security Market Key Takeaways
Below are some of the specific key takeaways from the market, including:
- Increasing focus on public safety is driving demand for advanced physical security solutions.
- The integration of physical and digital security systems poses challenges but also spurs innovation.
- Urbanization and smart city initiatives are significant factors influencing market growth.
- Investment from sectors like banking, retail, and healthcare is vital for safeguarding assets.
- Privacy concerns related to surveillance systems are prompting discussions around compliance and regulation.
Evaluation of Restraints in Singapore Physical Security Market
One of the primary restraints affecting the Singapore Physical Security Market is the complexity of integrating multiple security systems. Organizations often struggle to ensure that their physical security measures effectively cooperate with digital security frameworks. This lack of interoperability can create vulnerabilities, making it essential for firms to seek cohesive solutions that align both aspects of security.
Additionally, the balance between security and privacy remains a contentious topic. Companies are increasingly aware of the implications of surveillance technologies on individual privacy rights, which can lead to delays in implementation and adoption of certain security measures.
Singapore Physical Security Market Trends
Several trends are shaping the demand within the Singapore Physical Security Market. The advent of AI and machine learning is leading to more sophisticated surveillance systems capable of predictive analytics, enhancing proactive security measures. on top of that, the movement towards cloud-based security solutions allows for greater flexibility and scalability, accommodating the needs of businesses as they grow.
The increasing focus on cybersecurity as an integral component of physical security is also noteworthy. With the rise of cyberattacks targeting physical systems, organizations are investing more resources into solutions that protect against these threats, thereby blending physical and cyber defense strategies.
Singapore Physical Security Market Opportunities
The opportunities within the Singapore Physical Security Market are vast, particularly with the ongoing advancements in technology. Companies that can provide integrated solutions that meet both physical and digital security needs stand to benefit significantly. There’s a growing demand for innovative identity management systems that incorporate biometrics and advanced access control technologies.
on top of that, public-private partnerships aimed at enhancing national security infrastructure present avenues for investment and collaboration. Such initiatives can further propel market growth as stakeholders seek to address emerging threats in a proactive manner.
Government Initiatives in the Singapore Physical Security Market
The Singapore government is actively shaping the Physical Security Market through a range of initiatives that emphasize safety, compliance, and infrastructure development. Regulatory frameworks are increasingly prioritizing both public safety and data privacy, which influences how security technologies are adopted and implemented in the country.
- A national smart surveillance program launched in 2023 aims to enhance urban safety through advanced monitoring technologies across public spaces.
- Current initiatives focus on integrating AI-driven analytics into existing physical security systems to improve threat detection capabilities.
- Regulatory updates planned for 2026 will mandate stricter compliance measures around data protection in surveillance systems.
- A public-private partnership currently underway seeks to enhance security protocols for critical infrastructure across the nation, enhancing resilience against potential threats.
Future Insights of the Singapore Physical Security Market
Looking ahead to the period of 2026-2032, the Singapore Physical Security Market is expected to evolve significantly. Continued urbanization and a focus on smart city initiatives will be key factors driving demand for integrated security solutions. As businesses increasingly adopt hybrid models, the need for flexible and scalable security systems will grow.
In addition, the rising consciousness of cybersecurity threats will lead organizations to invest heavily in solutions that bridge physical and digital security. Companies that adapt to these changes and offer comprehensive solutions will likely find themselves well-positioned for success in this dynamic market.
Singapore Physical Security Market Latest Developments
In the last 12-14 months, the Singapore Physical Security Market has witnessed a notable uptick in technology adoption and strategic partnerships aimed at enhancing security measures across sectors. As businesses adapt to new security demands, innovation remains a top priority.
- A major technology vendor launched an upgraded surveillance platform in early 2025, enhancing video analytics capabilities to improve threat detection.
- An ongoing initiative began in late 2024 to incorporate biometric access controls in government buildings, aimed at increasing physical security measures.
- In mid-2025, a prominent company announced a partnership to develop AI-driven security solutions tailored for the healthcare sector.
- A rollout of a smart city security integration project is expected to begin in Q4 2026, focusing on improving urban public safety through connected systems.
Singapore Physical Security Market - Key Attractiveness of the Report
- 10 Years of Market Numbers
- Historical Data Starting from 2022 to 2025
- Base Year: 2025
- Forecast Data until 2032
- Key Performance Indicators Impacting the Market
- Major Upcoming Developments and Projects
Key Highlights of the Report:
- Singapore Physical Security Market Outlook
- Market Size of Singapore Physical Security Market, 2025
- Forecast of Singapore Physical Security Market, 2032
- Historical Data and Forecast of Singapore Physical Security Revenues & Volume for the Period 2022-2032F
- Singapore Physical Security Market Trend Evolution
- Singapore Physical Security Market Drivers and Challenges
- Singapore Physical Security Price Trends
- Singapore Physical Security Porter's Five Forces
- Singapore Physical Security Industry Life Cycle
- Historical Data and Forecast of Singapore Physical Security Market Revenues & Volume By Component for the Period 2022-2032F
- Historical Data and Forecast of Singapore Physical Security Market Revenues & Volume By Systems (PACS, PSIM, PIAM, Video Surveillance, Fire and Life Safety) for the Period 2022-2032F
- Historical Data and Forecast of Singapore Physical Security Market Revenues & Volume By Services for the Period 2022-2032F
- Historical Data and Forecast of Singapore Physical Security Market Revenues & Volume By Vertical for the Period 2022-2032F
- Historical Data and Forecast of Singapore Physical Security Market Revenues & Volume By BFSI for the Period 2022-2032F
- Historical Data and Forecast of Singapore Physical Security Market Revenues & Volume By Government for the Period 2022-2032F
- Historical Data and Forecast of Singapore Physical Security Market Revenues & Volume By Retail for the Period 2022-2032F
- Historical Data and Forecast of Singapore Physical Security Market Revenues & Volume By Transportation for the Period 2022-2032F
- Historical Data and Forecast of Singapore Physical Security Market Revenues & Volume By Residential for the Period 2022-2032F
- Historical Data and Forecast of Singapore Physical Security Market Revenues & Volume By Telecom and IT for the Period 2022-2032F
- Historical Data and Forecast of Singapore Physical Security Market Revenues & Volume By Other Verticals (Healthcare, Manufacturing, Energy and Utilities, and Education). for the Period 2022-2032F
- Historical Data and Forecast of Singapore Physical Security Market Revenues & Volume By Organization Size for the Period 2022-2032F
- Historical Data and Forecast of Singapore Physical Security Market Revenues & Volume By SMEs for the Period 2022-2032F
- Historical Data and Forecast of Singapore Physical Security Market Revenues & Volume By Large Enterprises for the Period 2022-2032F
- Singapore Physical Security Import Export Trade Statistics
- Market Opportunity Assessment By Component
- Market Opportunity Assessment By Vertical
- Market Opportunity Assessment By Organization Size
- Singapore Physical Security Top Companies Market Share
- Singapore Physical Security Competitive Benchmarking By Technical and Operational Parameters
- Singapore Physical Security Company Profiles
- Singapore Physical Security Key Strategic Recommendations






































