Singapore Platform as a Service (PaaS) Market Size & Growth Rate (2026-2032)
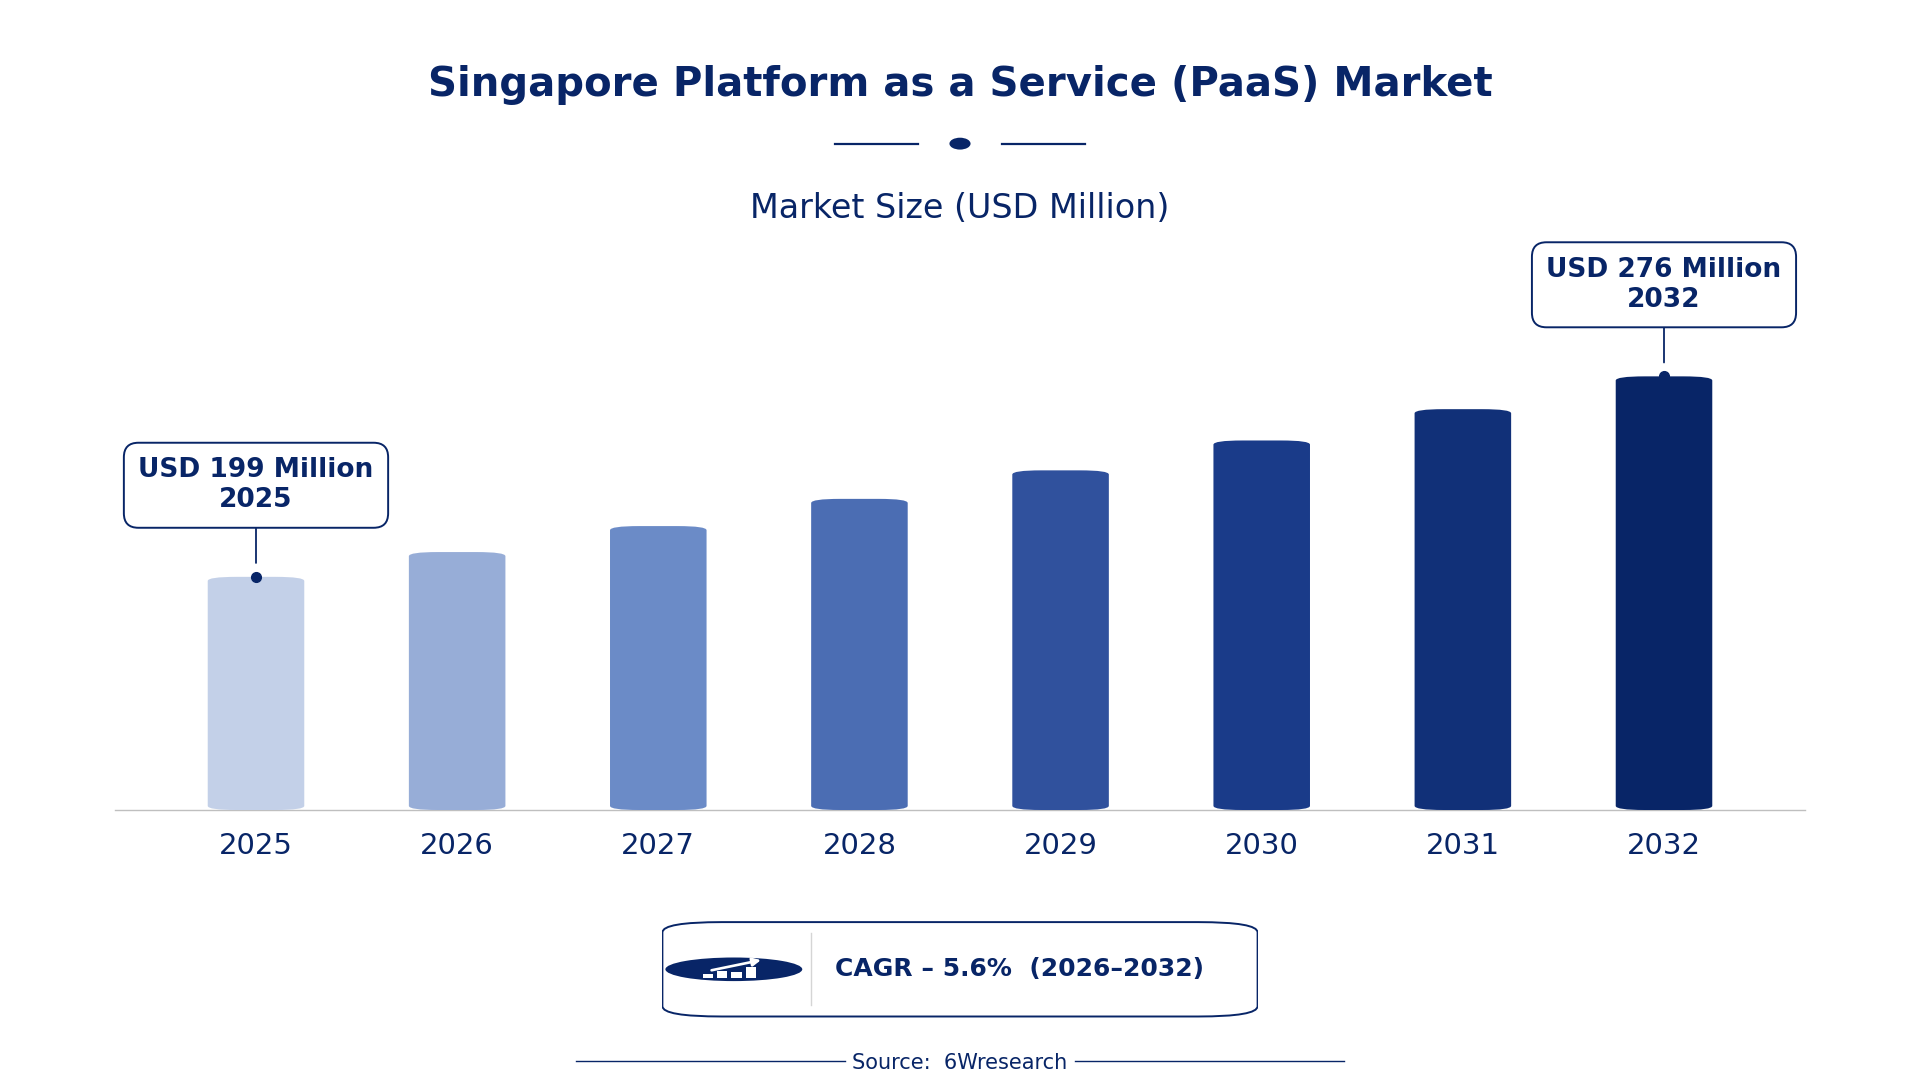
The Singapore Platform as a Service (PaaS) Market was estimated at USD 199 Million in 2025 and is projected to reach USD 276 Million by 2032, growing at a CAGR of 5.6% from 2026 to 2032.
Singapore Platform as a Service (PaaS) Market Synopsis
The Singapore Platform as a Service (PaaS) market has gained remarkable momentum in recent years, driven by a surge in demand for efficient application development. Businesses are increasingly prioritizing speed and agility, using PaaS solutions to cut down on time-to-market. This shift not only reflects the growing digitalization trend but also underscores a commitment to innovation within Singapore's competitive business environment.
As we look forward, the PaaS market is anticipated to evolve further. With a focus on enhanced developer tools and integration capabilities, providers will continue to adapt to the changing needs of enterprises and startups alike. The emphasis on cloud-native solutions and the integration of advanced technologies like AI and machine learning will likely drive the next wave of growth in this sector.
Singapore Platform as a Service (PaaS) Market Year-wise Growth Rate and Key Drivers
This graph illustrates the annual growth rates of the Singapore Platform as a Service (PaaS) Market from 2021 to 2032, highlighting a steady upward trajectory and projected expansion over the forecast period.
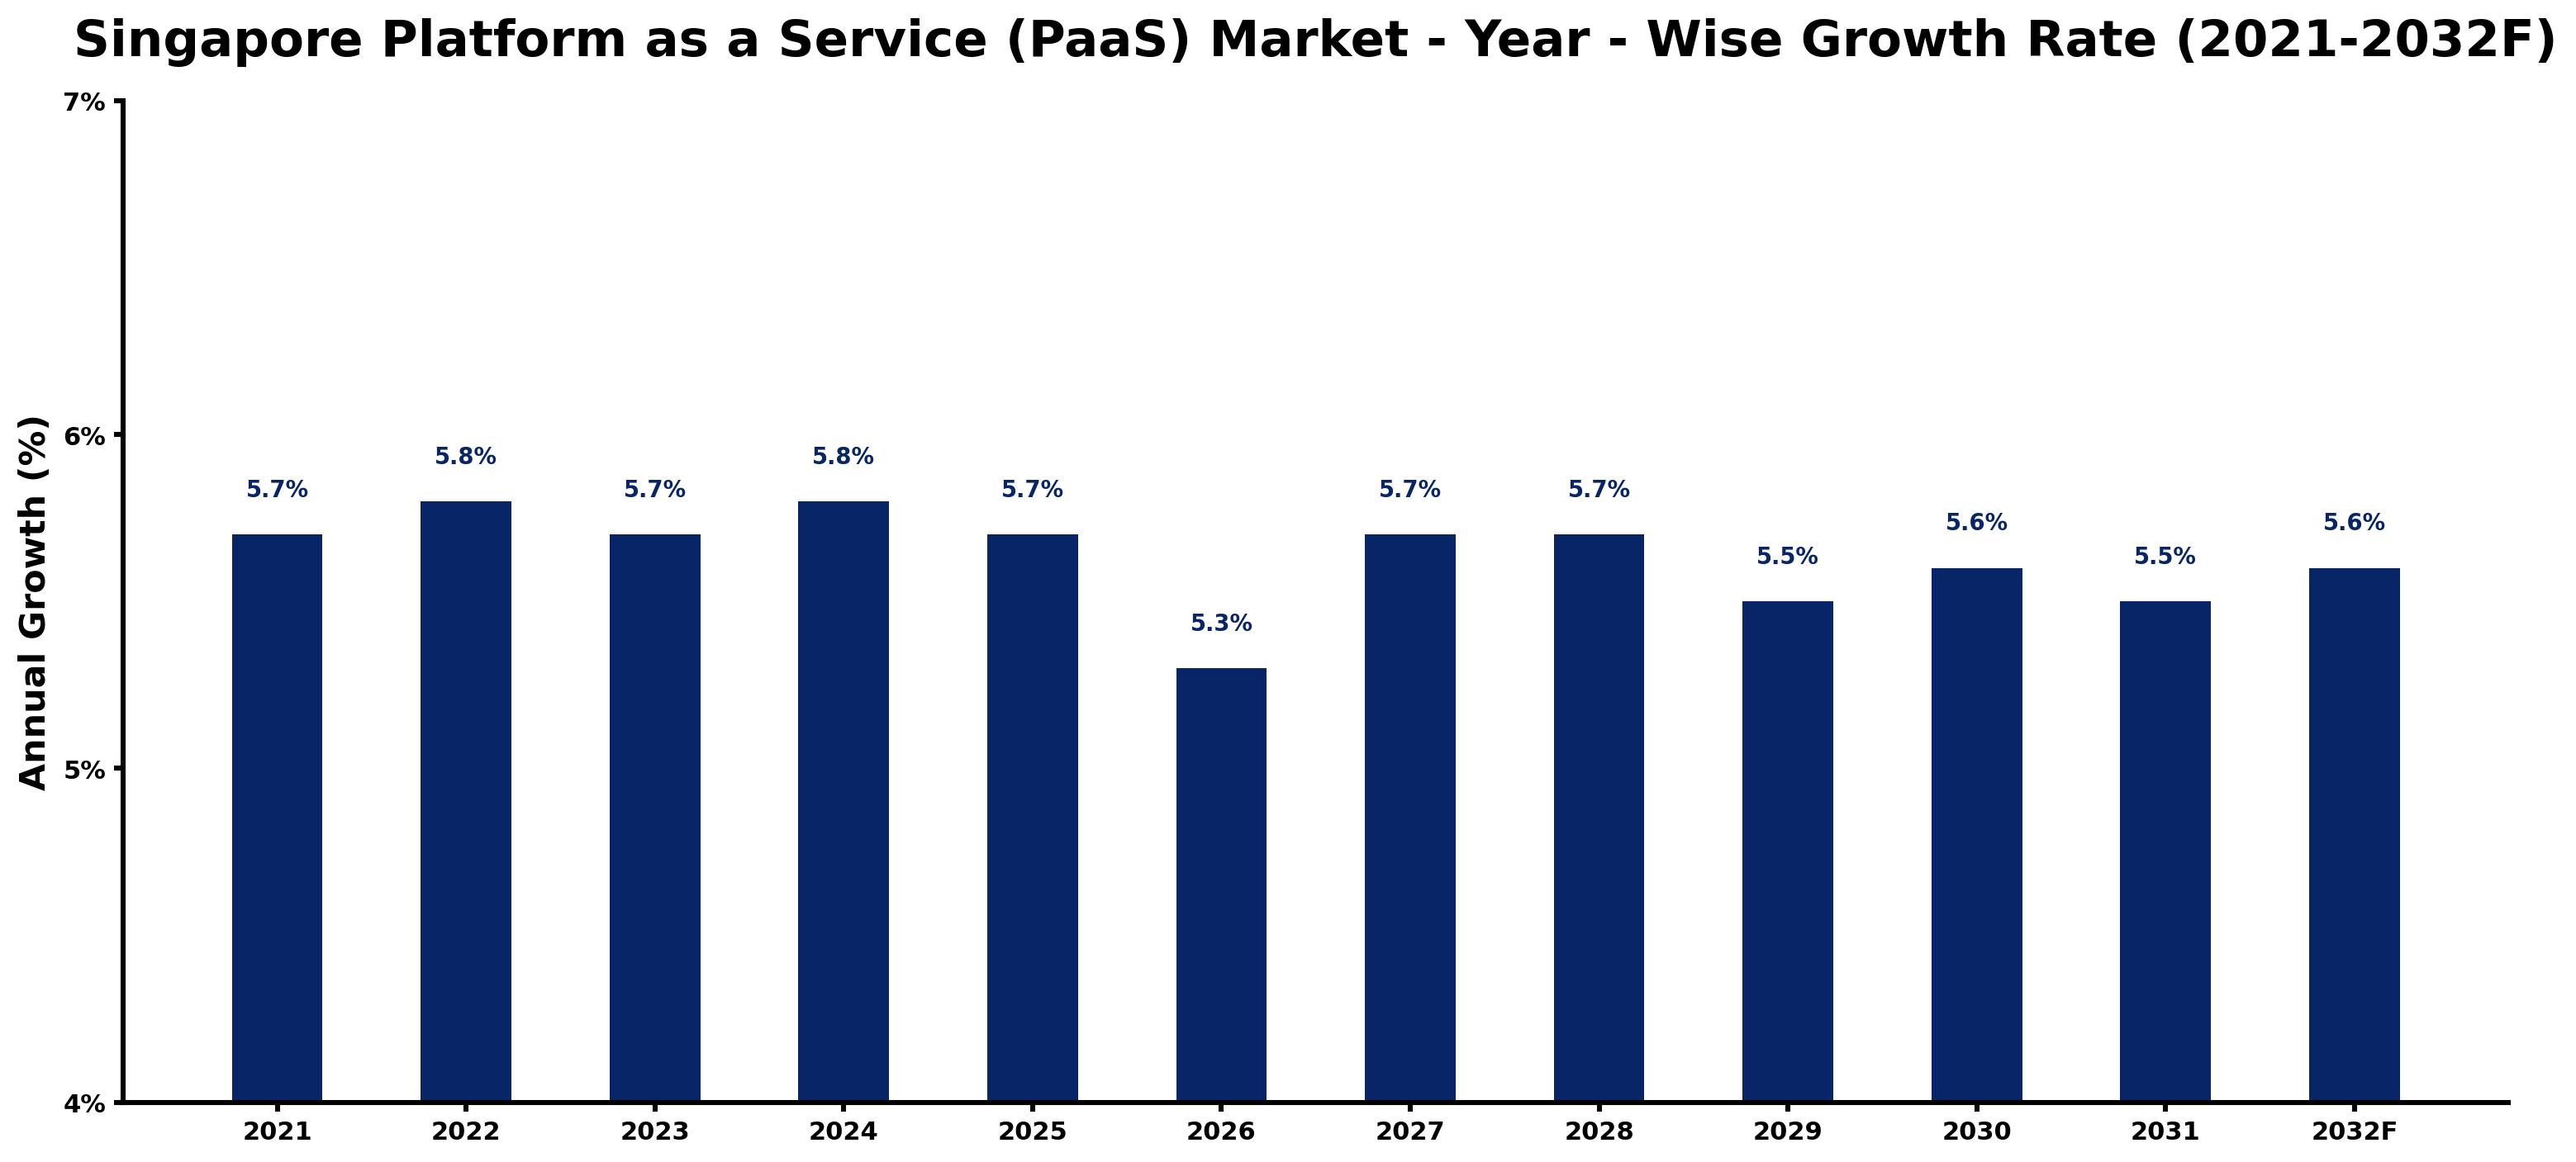
The table below presents the year‑wise growth rates along with the key drivers influencing the market
| Year | Growth Rate | Major Drivers |
| 2021 | 5.7% | Government's Smart Nation initiative drives cloud adoption. |
| 2022 | 5.8% | Rise in demand for digital transformation services. |
| 2023 | 5.7% | Increased emphasis on cybersecurity in business operations. |
| 2024 | 5.8% | Ongoing digital skills training by SkillsFuture Singapore. |
| 2025 | 5.7% | Adoption of AI and machine learning technologies. |
| 2026 | 5.3% | Streamlined regulations for tech startups in Singapore. |
| 2027 | 5.7% | Growth in fintech innovations requiring platform solutions. |
| 2028 | 5.7% | Local companies migrating to cloud-based infrastructures. |
| 2029 | 5.5% | Collaborations between universities and tech firms boosting PaaS. |
| 2030 | 5.6% | Economic recovery post-pandemic increasing tech investments. |
| 2031 | 5.5% | Emergence of new PaaS providers enhancing competition. |
| 2032 | 5.6% | Sector-specific customizations driving demand for PaaS solutions. |
Note: Market size estimations and growth projections presented in this report are based on 6Wresearch's proprietary forecasting methodology, utilizing the latest available industry data, government publications, and primary research inputs.
Singapore Platform as a Service (PaaS) Market Key Takeaways
Below are some of the specific key takeaways from the market, including:
- Growing demand for efficient application development is driving PaaS adoption.
- The market is becoming increasingly competitive, prompting providers to innovate continuously.
- Cloud-native application development is a key focus area for businesses in Singapore.
- Integration capabilities with existing systems are crucial for PaaS solutions.
- Emerging technologies like AI and machine learning are shaping future PaaS offerings.
Evaluation of Restraints in Singapore Platform as a Service (PaaS) Market
Despite the growth, certain restraints hinder the Singapore PaaS market's full potential. The challenge of providing versatile and scalable solutions remains paramount. Providers often grapple with ensuring compatibility across diverse programming languages and frameworks. As businesses demand greater flexibility, PaaS offerings must evolve to keep pace with these expectations. Additionally, maintaining stringent security measures while fostering innovation presents a continuous challenge for stakeholders in this market.
Singapore Platform as a Service (PaaS) Market Trends
Several trends are currently influencing the Singapore PaaS market. A notable shift is towards cloud-native development, as organizations increasingly adopt microservices architectures and containerization. This trend is supported by the growing need for scalable applications that can adapt quickly to market demands. on top of that, the integration of machine learning and AI into PaaS offerings is becoming commonplace, enabling businesses to enhance application capabilities and streamline operations.
Another significant trend is the growing focus on developer experience. Platforms are prioritizing user-friendly interfaces and comprehensive toolkits that allow developers to focus on creativity rather than infrastructure management. This emphasis not only attracts talent but also boosts productivity within development teams across various sectors.
Singapore Platform as a Service (PaaS) Market Opportunities
The PaaS market in Singapore presents several opportunities for growth and investment. As businesses continue their digital transformation journeys, there’s an increasing demand for tailored PaaS solutions that cater to specific industry needs. Startups and enterprises alike are looking for platforms that not only support application development but also offer robust analytics and integration capabilities.
Additionally, partnerships between technology vendors and educational institutions are emerging, creating opportunities for skill development in cloud technologies. These initiatives will cultivate a new generation of developers equipped to leverage PaaS solutions effectively, further expanding the market potential.
Government Initiatives in the Singapore Platform as a Service (PaaS) Market
The Singapore government is actively shaping the PaaS market through various initiatives aimed at fostering digital transformation across industries. By prioritizing cloud adoption and providing support for businesses to transition to digital platforms, the government is creating a conducive environment for PaaS solutions to thrive. This public-sector focus on technology adoption is vital for maintaining Singapore's competitive edge in the global market.
- A national digital infrastructure upgrade programme launched in early 2023 aims to enhance connectivity and support cloud services across the country.
- Current initiatives are underway to establish regulatory frameworks that promote transparency and security in cloud services, expected to be rolled out by mid-2025.
- A planned public-private initiative is set to begin in late 2024, focusing on expanding access to cloud technologies for small and medium enterprises (SMEs).
- Government grants to support cloud migration for local businesses have been introduced as part of the 2023 digital economy strategy.
Future Insights of the Singapore Platform as a Service (PaaS) Market
Looking ahead to 2026-2032, the Singapore PaaS market is expected to witness continued growth, driven by the increasing reliance on cloud solutions across industries. The integration of advanced technologies such as AI, machine learning, and blockchain will enhance application capabilities, making PaaS offerings more attractive. As companies prioritize agility and speed in their operations, PaaS will become a cornerstone of their digital strategies, ensuring that the market remains vibrant and competitive.
Singapore Platform as a Service (PaaS) Market Latest Developments
Recent developments in the Singapore PaaS market have been notable, reflecting a shift towards more innovative and integrated solutions. Companies are increasingly focusing on improving their offerings to meet evolving customer needs. The pace of adoption of cloud technologies has accelerated, with many organizations embracing PaaS to streamline their operations and enhance development efficiency.
- A major technology vendor announced a service upgrade in Q2 2023, enhancing its PaaS offerings with advanced analytics tools.
- An ongoing initiative launched in early 2023 focuses on integrating AI capabilities into existing PaaS platforms to improve user experiences.
- A partnership between local tech startups and global cloud providers is currently underway, aiming to develop tailored solutions for specific industries.
- Plans for a new PaaS platform targeting the financial sector are expected to be unveiled by late 2024.
Singapore Platform as a Service (PaaS) Market - Key Attractiveness of the Report
- 10 Years of Market Numbers
- Historical Data Starting from 2022 to 2025
- Base Year: 2025
- Forecast Data until 2032
- Key Performance Indicators Impacting the Market
- Major Upcoming Developments and Projects
Key Highlights of the Report:
- Singapore Platform as a Service (PaaS) Market Outlook
- Market Size of Singapore Platform as a Service (PaaS) Market, 2025
- Forecast of Singapore Platform as a Service (PaaS) Market, 2032
- Historical Data and Forecast of Singapore Platform as a Service (PaaS) Revenues & Volume for the Period 2022-2032F
- Singapore Platform as a Service (PaaS) Market Trend Evolution
- Singapore Platform as a Service (PaaS) Market Drivers and Challenges
- Singapore Platform as a Service (PaaS) Price Trends
- Singapore Platform as a Service (PaaS) Porter's Five Forces
- Singapore Platform as a Service (PaaS) Industry Life Cycle
- Historical Data and Forecast of Singapore Platform as a Service (PaaS) Market Revenues & Volume By Type for the Period 2022-2032F
- Historical Data and Forecast of Singapore Platform as a Service (PaaS) Market Revenues & Volume By Application PaaS (aPaaS) for the Period 2022-2032F
- Historical Data and Forecast of Singapore Platform as a Service (PaaS) Market Revenues & Volume By Integration PaaS (iPaaS) for the Period 2022-2032F
- Historical Data and Forecast of Singapore Platform as a Service (PaaS) Market Revenues & Volume By Database PaaS (dbPaaS) for the Period 2022-2032F
- Historical Data and Forecast of Singapore Platform as a Service (PaaS) Market Revenues & Volume By Others for the Period 2022-2032F
- Historical Data and Forecast of Singapore Platform as a Service (PaaS) Market Revenues & Volume By Deployment for the Period 2022-2032F
- Historical Data and Forecast of Singapore Platform as a Service (PaaS) Market Revenues & Volume By Public for the Period 2022-2032F
- Historical Data and Forecast of Singapore Platform as a Service (PaaS) Market Revenues & Volume By Private for the Period 2022-2032F
- Historical Data and Forecast of Singapore Platform as a Service (PaaS) Market Revenues & Volume By Market Type for the Period 2022-2032F
- Historical Data and Forecast of Singapore Platform as a Service (PaaS) Market Revenues & Volume By APaaS for the Period 2022-2032F
- Historical Data and Forecast of Singapore Platform as a Service (PaaS) Market Revenues & Volume By IPaaS for the Period 2022-2032F
- Historical Data and Forecast of Singapore Platform as a Service (PaaS) Market Revenues & Volume By DBPaaS for the Period 2022-2032F
- Historical Data and Forecast of Singapore Platform as a Service (PaaS) Market Revenues & Volume By Organization Size for the Period 2022-2032F
- Historical Data and Forecast of Singapore Platform as a Service (PaaS) Market Revenues & Volume By Large Enterprises for the Period 2022-2032F
- Historical Data and Forecast of Singapore Platform as a Service (PaaS) Market Revenues & Volume By SMEs for the Period 2022-2032F
- Historical Data and Forecast of Singapore Platform as a Service (PaaS) Market Revenues & Volume By Vertical for the Period 2022-2032F
- Historical Data and Forecast of Singapore Platform as a Service (PaaS) Market Revenues & Volume By BFSI for the Period 2022-2032F
- Historical Data and Forecast of Singapore Platform as a Service (PaaS) Market Revenues & Volume By Consumer goods and retail for the Period 2022-2032F
- Historical Data and Forecast of Singapore Platform as a Service (PaaS) Market Revenues & Volume By Telecommunication for the Period 2022-2032F
- Historical Data and Forecast of Singapore Platform as a Service (PaaS) Market Revenues & Volume By IT and ITeS for the Period 2022-2032F
- Historical Data and Forecast of Singapore Platform as a Service (PaaS) Market Revenues & Volume By Manufacturing for the Period 2022-2032F
- Historical Data and Forecast of Singapore Platform as a Service (PaaS) Market Revenues & Volume By Healthcare and life sciences for the Period 2022-2032F
- Historical Data and Forecast of Singapore Platform as a Service (PaaS) Market Revenues & Volume By Energy and utility for the Period 2022-2032F
- Historical Data and Forecast of Singapore Platform as a Service (PaaS) Market Revenues & Volume By Others for the Period 2022-2032F
- Singapore Platform as a Service (PaaS) Import Export Trade Statistics
- Market Opportunity Assessment By Type
- Market Opportunity Assessment By Deployment
- Market Opportunity Assessment By Market Type
- Market Opportunity Assessment By Organization Size
- Market Opportunity Assessment By Vertical
- Singapore Platform as a Service (PaaS) Top Companies Market Share
- Singapore Platform as a Service (PaaS) Competitive Benchmarking By Technical and Operational Parameters
- Singapore Platform as a Service (PaaS) Company Profiles
- Singapore Platform as a Service (PaaS) Key Strategic Recommendations






































