Singapore Push Buttons And Signalling Devices Market (2026-2032) Outlook | Companies, Analysis, Share, Growth, Revenue, Forecast, Size, Industry, Trends & Value
Market Forecast By Product (Round or Square Body Type, Non-lighted Push Button, Other Products), By Types (Audible, Visible, Other Types), By End-user Industry (Automotive, Energy and Power, Manufacturing, Food and Beverage, Other End-user Industries) And Competitive Landscape
| Product Code: ETC255147 | Publication Date: Aug 2022 | Updated Date: Jul 2026 | Product Type: Market Research Report | |
| Publisher: 6Wresearch | Author: Ravi Bhandari | No. of Pages: 75 | No. of Figures: 35 | No. of Tables: 20 |
Singapore Push Buttons And Signalling Devices Market Size, Share & Growth Rate
The Singapore Push Buttons And Signalling Devices Market was estimated at USD 431 Million in 2025 and is projected to reach USD 538 Million by 2032, growing at a CAGR of 3.2% from 2026 to 2032. This growth trajectory is primarily fueled by the increasing demand for automation across various sectors, particularly manufacturing, where efficient control and safety systems are paramount. The expanding construction and transportation sectors also contribute significantly, as they necessitate reliable signaling devices to enhance operational efficiency and safety standards.
Singapore Push Buttons And Signalling Devices Market Growth Rate Analysis (2021-2032)
The Singapore Push Buttons and Signalling Devices market in the U.S. has seen notable fluctuations, starting with a decline of 2.4% in 2021, reflecting the pandemic's impact on manufacturing and supply chains. However, the market rebounded strongly, registering growth rates of 6.5% in 2022 and 6.6% in 2023, driven by increased consumer demand for automation solutions and investments in infrastructure upgrades during the post-pandemic recovery. As companies prioritize digitalization and energy transition, growth remains robust, with projections indicating 3.4% growth in 2026 and peaking at 5.1% by 2030. This upward trend underscores the importance of technology advancements and supportive policies propelling the market forward.
Singapore Push Buttons And Signalling Devices Market Year-wise Growth Rate and Key Drivers
This graph highlights how the Singapore Push Buttons And Signalling Devices Market has steadily grown over the past five years, supported by major growth factors.
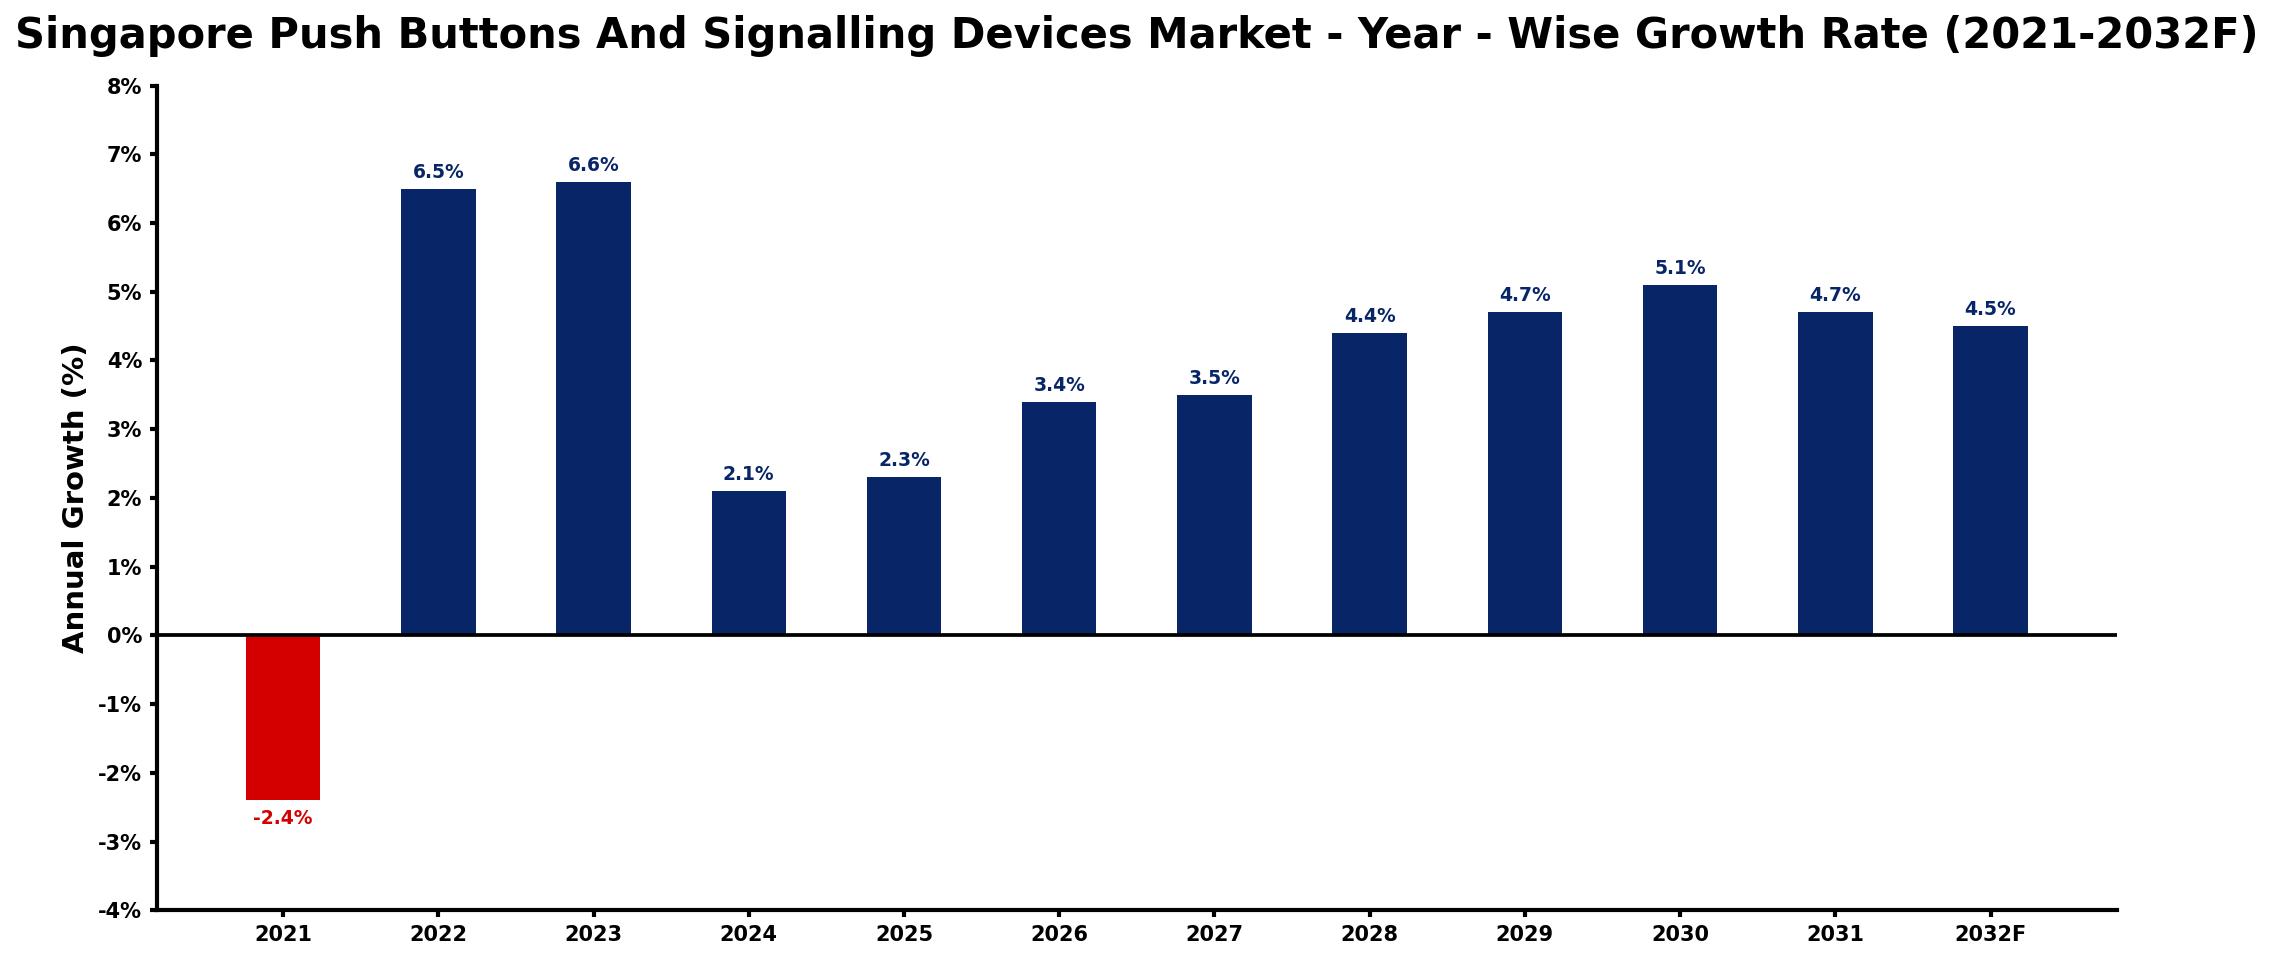
The table below presents the year‑wise growth rates along with the key drivers influencing the market
| Year | Growth Rate | Major Drivers |
| 2021 | -2.4% | decrease in industrial automation investments |
| 2022 | 6.5% | rising demand for smart manufacturing |
| 2023 | 6.6% | increased focus on safety regulations |
| 2024 | 2.1% | growth in renewable energy projects |
| 2025 | 2.3% | expansion of urban infrastructure projects |
| 2026 | 3.4% | surge in e-commerce logistics operations |
| 2027 | 3.5% | growing adoption of IoT technologies |
| 2028 | 4.4% | increased investments in smart cities |
| 2029 | 4.7% | rising end-use demand growth |
| 2030 | 5.1% | increased pharmaceutical industry usage |
| 2031 | 4.7% | expanding industrial usage applications |
| 2032 | 4.5% | increased domestic production output |
Note: Market size estimations and growth projections presented in this report are based on 6Wresearch's proprietary forecasting methodology, utilizing the latest available industry data, government publications, and primary research inputs.
Singapore Push Buttons And Signalling Devices Market Synopsis
The strongest force shaping the Singapore Push Buttons and Signalling Devices Market is the push towards industrial automation and improved safety standards. As industries strive for enhanced operational efficiency and safety compliance, the demand for advanced push buttons and signaling devices has surged. These components are critical in controlling machinery and ensuring worker safety in various industrial applications.
Moreover, manufacturers are increasingly focusing on ergonomic designs and integration with digital systems to meet the evolving needs of customers. This shift towards smart manufacturing practices not only caters to the demand for high-quality components but also positions companies to thrive in an increasingly competitive landscape.
Singapore Push Buttons And Signalling Devices Market Key Takeaways
- Market projected to grow from USD 431 Million in 2025 to USD 538 Million by 2032.
- Industrial automation and safety requirements are key growth drivers.
- Increasing customization demands pose challenges for manufacturers.
- Smart manufacturing practices are on the rise, enhancing market prospects.
- Post-pandemic recovery in industrial activities is expected to boost demand.
Evaluation of Restraints in Singapore Push Buttons And Signalling Devices Market
Despite a robust growth outlook, the Singapore Push Buttons and Signalling Devices Market faces notable restraints. The rapid evolution of technology necessitates that manufacturers continuously adapt their product offerings. Companies must ensure that their push buttons and signaling devices incorporate new features, as well as compatibility with advanced digital systems. Moreover, as clients increasingly seek customized solutions tailored to specific operational needs, manufacturers are challenged to provide a diverse range of options while maintaining cost-effectiveness.
Singapore Push Buttons And Signalling Devices Market Trends
Several key trends are shaping the Singapore Push Buttons and Signalling Devices Market. Firstly, the integration of IoT (Internet of Things) technology is becoming increasingly prevalent, allowing for smarter, more connected signaling solutions. Secondly, there is a noticeable shift towards environmentally friendly materials in manufacturing processes, driven by regulatory pressures and customer preferences for sustainable products. Additionally, ergonomic designs are gaining traction, as they enhance usability and reduce workplace accidents.
Singapore Push Buttons And Signalling Devices Market Opportunities
The market presents multiple growth and investment opportunities, particularly in sectors emphasizing automation. With smart manufacturing initiatives on the rise, companies can capitalize on developing innovative solutions that integrate seamlessly with digital platforms. Additionally, the ongoing expansion in construction and transportation sectors opens avenues for tailored signaling devices that enhance safety and operational efficiency. Furthermore, investments in R&D for advanced features can yield competitive advantages, positioning firms as leaders in this niche market.
Government Initiatives in the Singapore Push Buttons And Signalling Devices Market
The Singaporean government has been actively promoting industrial modernization and automation through various initiatives. Policies aimed at enhancing productivity and safety in the workplace encourage companies to adopt advanced technologies. Public spending on infrastructure projects also drives demand for reliable push buttons and signaling devices. Programs focusing on research and development further support innovation within the sector, providing manufacturers with the impetus to develop cutting-edge solutions that comply with emerging safety regulations.
Future Insights of the Singapore Push Buttons And Signalling Devices Market
Looking ahead, the Singapore Push Buttons and Signalling Devices Market is poised for dynamic growth through 2026-2032. As industries embrace digital transformation and automation, the demand for advanced signaling solutions will continue to rise. The integration of AI and machine learning into control systems is expected to shape product offerings, enhancing reliability and functionality. Moreover, with an emphasis on safety and operational efficiency, manufacturers who prioritize innovation and customization are likely to thrive in this evolving landscape.
Singapore Push Buttons And Signalling Devices Market Latest Developments (2025 - 2026)
Recent trends in the market indicate a significant push towards automation technologies and smart manufacturing solutions. Innovations are emerging that focus on enhancing user interfaces and improving the durability of push buttons and signaling devices. Additionally, many companies are seeking to expand their product lines to include more customized solutions tailored to specific industry needs. These developments reflect an industry adapting to both technological advances and customer demands for higher efficiency and safety standards.
Singapore Push Buttons And Signalling Devices Market - Key Attractiveness of the Report
- 10 Years of Market Numbers
- Historical Data Starting from 2022 to 2025
- Base Year: 2025
- Forecast Data until 2032
- Key Performance Indicators Impacting the Market
- Major Upcoming Developments and Projects
Key Highlights of the Report:
- Singapore Push Buttons And Signalling Devices Market Outlook
- Market Size of Singapore Push Buttons And Signalling Devices Market, 2025
- Forecast of Singapore Push Buttons And Signalling Devices Market, 2032
- Historical Data and Forecast of Singapore Push Buttons And Signalling Devices Revenues & Volume for the Period 2022-2032F
- Singapore Push Buttons And Signalling Devices Market Trend Evolution
- Singapore Push Buttons And Signalling Devices Market Drivers and Challenges
- Singapore Push Buttons And Signalling Devices Price Trends
- Singapore Push Buttons And Signalling Devices Porter's Five Forces
- Singapore Push Buttons And Signalling Devices Industry Life Cycle
- Historical Data and Forecast of Singapore Push Buttons And Signalling Devices Market Revenues & Volume By Product for the Period 2022-2032F
- Historical Data and Forecast of Singapore Push Buttons And Signalling Devices Market Revenues & Volume By Round or Square Body Type for the Period 2022-2032F
- Historical Data and Forecast of Singapore Push Buttons And Signalling Devices Market Revenues & Volume By Non-lighted Push Button for the Period 2022-2032F
- Historical Data and Forecast of Singapore Push Buttons And Signalling Devices Market Revenues & Volume By Other Products for the Period 2022-2032F
- Historical Data and Forecast of Singapore Push Buttons And Signalling Devices Market Revenues & Volume By Types for the Period 2022-2032F
- Historical Data and Forecast of Singapore Push Buttons And Signalling Devices Market Revenues & Volume By Audible for the Period 2022-2032F
- Historical Data and Forecast of Singapore Push Buttons And Signalling Devices Market Revenues & Volume By Visible for the Period 2022-2032F
- Historical Data and Forecast of Singapore Push Buttons And Signalling Devices Market Revenues & Volume By Other Types for the Period 2022-2032F
- Historical Data and Forecast of Singapore Push Buttons And Signalling Devices Market Revenues & Volume By End-user Industry for the Period 2022-2032F
- Historical Data and Forecast of Singapore Push Buttons And Signalling Devices Market Revenues & Volume By Automotive for the Period 2022-2032F
- Historical Data and Forecast of Singapore Push Buttons And Signalling Devices Market Revenues & Volume By Energy and Power for the Period 2022-2032F
- Historical Data and Forecast of Singapore Push Buttons And Signalling Devices Market Revenues & Volume By Manufacturing for the Period 2022-2032F
- Historical Data and Forecast of Singapore Push Buttons And Signalling Devices Market Revenues & Volume By Food and Beverage for the Period 2022-2032F
- Historical Data and Forecast of Singapore Push Buttons And Signalling Devices Market Revenues & Volume By Other End-user Industries for the Period 2022-2032F
- Singapore Push Buttons And Signalling Devices Import Export Trade Statistics
- Market Opportunity Assessment By Product
- Market Opportunity Assessment By Types
- Market Opportunity Assessment By End-user Industry
- Singapore Push Buttons And Signalling Devices Top Companies Market Share
- Singapore Push Buttons And Signalling Devices Competitive Benchmarking By Technical and Operational Parameters
- Singapore Push Buttons And Signalling Devices Company Profiles
- Singapore Push Buttons And Signalling Devices Key Strategic Recommendations
Frequently Asked Questions About the Market Study (FAQs):
The Singapore Push Buttons and Signalling Devices Market is estimated at USD 431 Million in 2025 and is projected to reach USD 538 Million by 2032.
Safety regulations are driving demand as industries prioritize worker safety and operational efficiency, making reliable signaling devices essential for compliance.
The manufacturing, construction, and transportation sectors are expected to see significant growth as they increasingly rely on advanced signaling solutions to enhance safety and efficiency.
There is a growing trend towards ergonomic designs and the integration of IoT technology, which enhances usability and connectivity in industrial applications.
As industrial activities recover post-pandemic, the demand for automation and advanced safety features is expected to rebound, revitalizing the market.
6Wresearch actively monitors the Singapore Push Buttons And Signalling Devices Market and publishes its comprehensive annual report, highlighting emerging trends, growth drivers, revenue analysis, and forecast outlook. Our insights help businesses to make data-backed strategic decisions with ongoing market dynamics. Our analysts track relevent industries related to the Singapore Push Buttons And Signalling Devices Market, allowing our clients with actionable intelligence and reliable forecasts tailored to emerging regional needs.
Yes, we provide customisation as per your requirements. To learn more, feel free to contact us on sales@6wresearch.com
1 Executive Summary |
2 Introduction |
2.1 Key Highlights of the Report |
2.2 Report Description |
2.3 Market Scope & Segmentation |
2.4 Research Methodology |
2.5 Assumptions |
3 Singapore Push Buttons And Signalling Devices Market Overview |
3.1 Singapore Country Macro Economic Indicators |
3.2 Singapore Push Buttons And Signalling Devices Market Revenues & Volume, 2022 & 2032F |
3.3 Singapore Push Buttons And Signalling Devices Market - Industry Life Cycle |
3.4 Singapore Push Buttons And Signalling Devices Market - Porter's Five Forces |
3.5 Singapore Push Buttons And Signalling Devices Market Revenues & Volume Share, By Product, 2022 & 2032F |
3.6 Singapore Push Buttons And Signalling Devices Market Revenues & Volume Share, By Types, 2022 & 2032F |
3.7 Singapore Push Buttons And Signalling Devices Market Revenues & Volume Share, By End-user Industry, 2022 & 2032F |
4 Singapore Push Buttons And Signalling Devices Market Dynamics |
4.1 Impact Analysis |
4.2 Market Drivers |
4.2.1 Increasing industrial automation in Singapore |
4.2.2 Growing emphasis on workplace safety regulations |
4.2.3 Technological advancements in push buttons and signalling devices |
4.3 Market Restraints |
4.3.1 High initial investment costs for implementing advanced push buttons and signalling devices |
4.3.2 Limited awareness and adoption of smart push buttons and signalling devices in the market |
5 Singapore Push Buttons And Signalling Devices Market Trends |
6 Singapore Push Buttons And Signalling Devices Market, By Types |
6.1 Singapore Push Buttons And Signalling Devices Market, By Product |
6.1.1 Overview and Analysis |
6.1.2 Singapore Push Buttons And Signalling Devices Market Revenues & Volume, By Product, 2022-2032F |
6.1.3 Singapore Push Buttons And Signalling Devices Market Revenues & Volume, By Round or Square Body Type, 2022-2032F |
6.1.4 Singapore Push Buttons And Signalling Devices Market Revenues & Volume, By Non-lighted Push Button, 2022-2032F |
6.1.5 Singapore Push Buttons And Signalling Devices Market Revenues & Volume, By Other Products, 2022-2032F |
6.2 Singapore Push Buttons And Signalling Devices Market, By Types |
6.2.1 Overview and Analysis |
6.2.2 Singapore Push Buttons And Signalling Devices Market Revenues & Volume, By Audible, 2022-2032F |
6.2.3 Singapore Push Buttons And Signalling Devices Market Revenues & Volume, By Visible, 2022-2032F |
6.2.4 Singapore Push Buttons And Signalling Devices Market Revenues & Volume, By Other Types, 2022-2032F |
6.3 Singapore Push Buttons And Signalling Devices Market, By End-user Industry |
6.3.1 Overview and Analysis |
6.3.2 Singapore Push Buttons And Signalling Devices Market Revenues & Volume, By Automotive, 2022-2032F |
6.3.3 Singapore Push Buttons And Signalling Devices Market Revenues & Volume, By Energy and Power, 2022-2032F |
6.3.4 Singapore Push Buttons And Signalling Devices Market Revenues & Volume, By Manufacturing, 2022-2032F |
6.3.5 Singapore Push Buttons And Signalling Devices Market Revenues & Volume, By Food and Beverage, 2022-2032F |
6.3.6 Singapore Push Buttons And Signalling Devices Market Revenues & Volume, By Other End-user Industries, 2022-2032F |
7 Singapore Push Buttons And Signalling Devices Market Import-Export Trade Statistics |
7.1 Singapore Push Buttons And Signalling Devices Market Export to Major Countries |
7.2 Singapore Push Buttons And Signalling Devices Market Imports from Major Countries |
8 Singapore Push Buttons And Signalling Devices Market Key Performance Indicators |
8.1 Percentage of industrial facilities in Singapore adopting automated push buttons and signalling devices |
8.2 Number of workplace accidents reported in industries using traditional push buttons and signalling devices |
8.3 Rate of technological adoption in the push buttons and signalling devices market |
9 Singapore Push Buttons And Signalling Devices Market - Opportunity Assessment |
9.1 Singapore Push Buttons And Signalling Devices Market Opportunity Assessment, By Product, 2022 & 2032F |
9.2 Singapore Push Buttons And Signalling Devices Market Opportunity Assessment, By Types, 2022 & 2032F |
9.3 Singapore Push Buttons And Signalling Devices Market Opportunity Assessment, By End-user Industry, 2022 & 2032F |
10 Singapore Push Buttons And Signalling Devices Market - Competitive Landscape |
10.1 Singapore Push Buttons And Signalling Devices Market Revenue Share, By Companies, 2025 |
10.2 Singapore Push Buttons And Signalling Devices Market Competitive Benchmarking, By Operating and Technical Parameters |
11 Company Profiles |
12 Recommendations |
13 Disclaimer |
Global Go To Market Strategy - 2030
Export potential enables firms to identify high-growth global markets with greater confidence by combining advanced trade intelligence with a structured quantitative methodology. The framework analyzes emerging demand trends and country-level import patterns while integrating macroeconomic and trade datasets such as GDP and population forecasts, bilateral import–export flows, tariff structures, elasticity differentials between developed and developing economies, geographic distance, and import demand projections. Using weighted trade values from 2020–2024 as the base period to project country-to-country export potential for 2030, these inputs are operationalized through calculated drivers such as gravity model parameters, tariff impact factors, and projected GDP per-capita growth. Through an analysis of hidden potentials, demand hotspots, and market conditions that are most favorable to success, this method enables firms to focus on target countries, maximize returns, and global expansion with data, backed by accuracy.
By factoring in the projected importer demand gap that is currently unmet and could be potential opportunity, it identifies the potential for the Exporter (Country) among 190 countries, against the general trade analysis, which identifies the biggest importer or exporter.
To discover high-growth global markets and optimize your business strategy:
Click Here
Pricing
- Single User License$ 1,995
- Department License$ 2,400
- Site License$ 3,120
- Global License$ 3,795

Leadership Perspectives from Industry Events
Search
Thought Leadership and Analyst Meet


Our Clients
6WResearch In News
- India Air Conditioner Market Set for Strong Rebound in 2026 After Weather-Led Correction and GST-Driven Recovery: 6Wresearch
- ADAS in India: How Automatic Emergency Braking, Blind Spot Detection & Driver Monitoring are Transforming Road Safety
- Doha a strategic location for EV manufacturing hub: IPA Qatar
- Demand for luxury TVs surging in the GCC, says Samsung
- Empowering Growth: The Thriving Journey of Bangladesh’s Cable Industry
- Demand for luxury TVs surging in the GCC, says Samsung
Latest Reports
- Nicaragua RPG Gaming Market (2026-2032)
- New Zealand RPG Gaming Market (2026-2032)
- Netherlands RPG Gaming Market (2026-2032)
- Nauru RPG Gaming Market (2026-2032)
- Namibia RPG Gaming Market (2026-2032)
- Mozambique RPG Gaming Market (2026-2032)
- Montenegro RPG Gaming Market (2026-2032)
- Mongolia RPG Gaming Market (2026-2032)
- Monaco RPG Gaming Market (2026-2032)
- Micronesia RPG Gaming Market (2026-2032)
Industry Events and Analyst Meet

HIMTEX 2026

India Refining Summit 2026

India EV Show 2026

EV tech India Expo 2026

Auto Tech Asia 2026
Whitepaper
- Middle East & Africa Commercial Security Market Click here to view more.
- Middle East & Africa Fire Safety Systems & Equipment Market Click here to view more.
- GCC Drone Market Click here to view more.
- Middle East Lighting Fixture Market Click here to view more.
- GCC Physical & Perimeter Security Market Click here to view more.