Singapore Tags Market (2025-2031) Outlook | Industry, Analysis, Share, Value, Forecast, Companies, Trends, Revenue, Growth & Size
Market Forecast By Material Type (Plastic, Paper, Fibers, Others (Metal, etc.)), By Tag Type (RFID Tag, Hang/ Swing Tag, Loop Tag), By End Use (Food & Beverage, Clothing & Apparels, Hospitality & Travel, Beauty & Personal Care, Consumer Electronics, Others) And Competitive Landscape
| Product Code: ETC428063 | Publication Date: Oct 2022 | Updated Date: Aug 2025 | Product Type: Market Research Report | |
| Publisher: 6Wresearch | Author: Ravi Bhandari | No. of Pages: 75 | No. of Figures: 35 | No. of Tables: 20 |
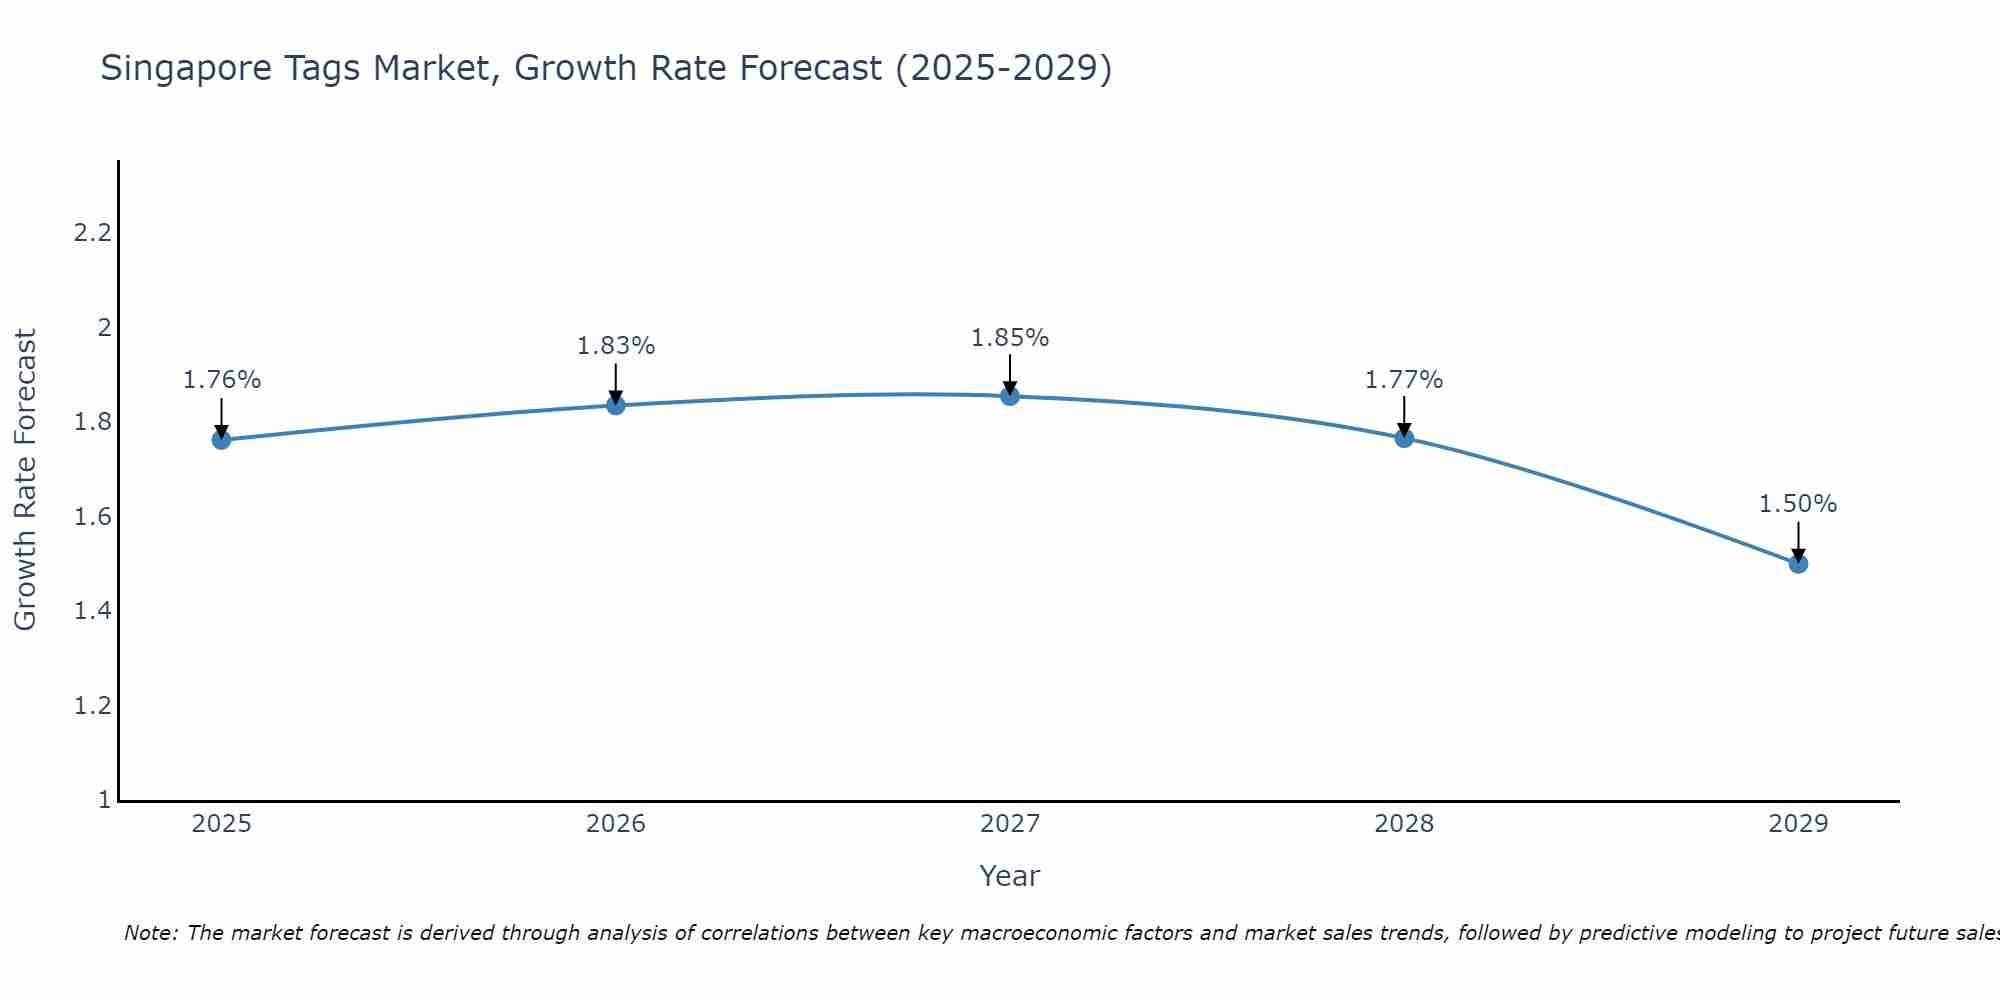
Singapore Tags Market Size Growth Rate
The Singapore Tags Market is projected to witness mixed growth rate patterns during 2025 to 2029. The growth rate begins at 1.76% in 2025, climbs to a high of 1.85% in 2027, and moderates to 1.50% by 2029.
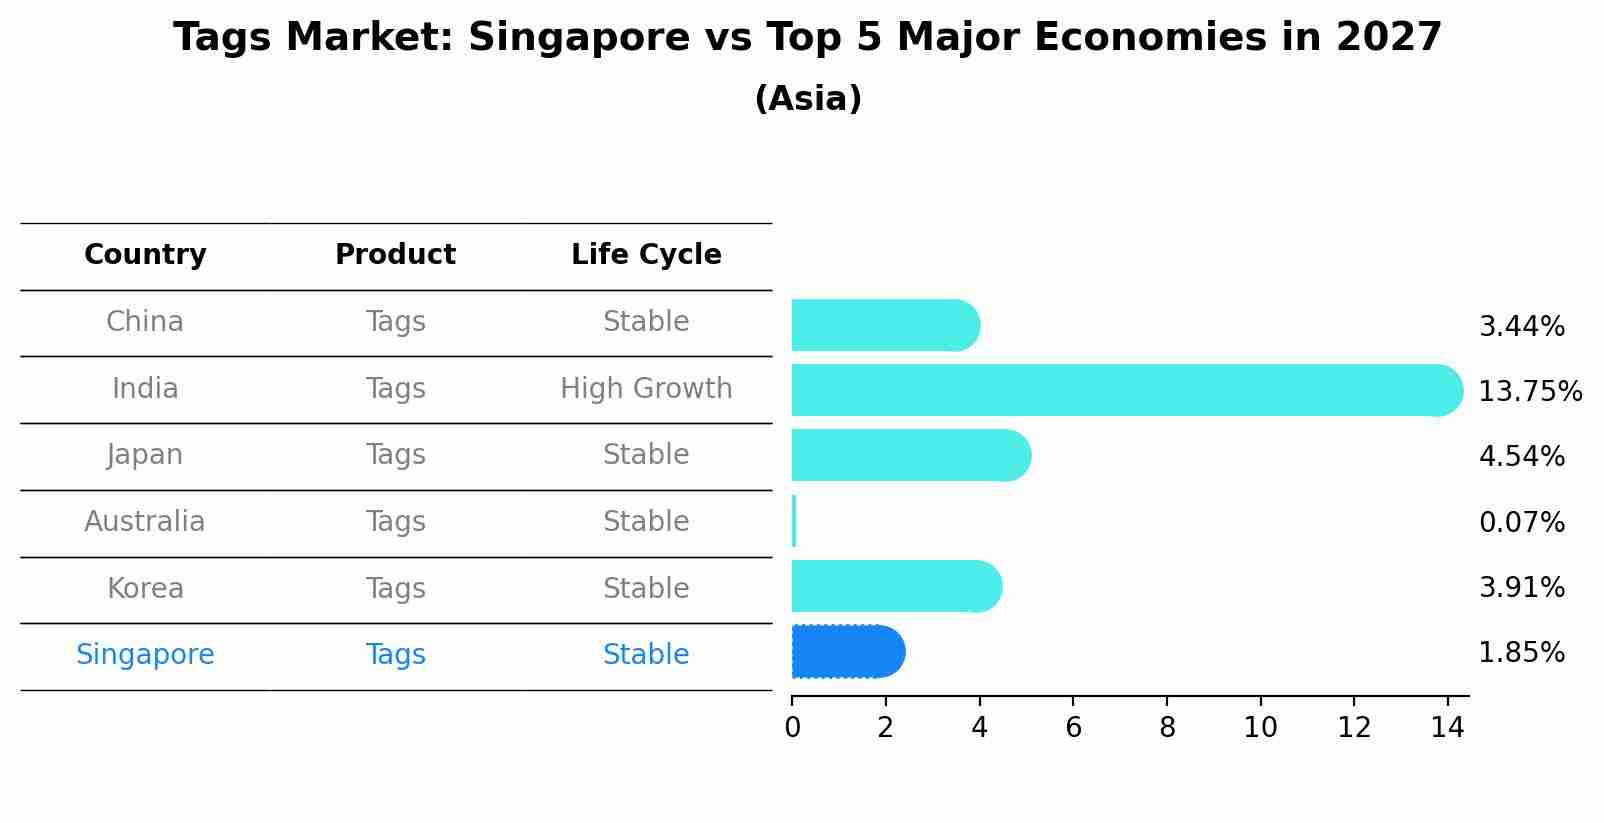
Tags Market: Singapore vs Top 5 Major Economies in 2027 (Asia)
By 2027, Singapore's Tags market is forecasted to achieve a stable growth rate of 1.85%, with China leading the Asia region, followed by India, Japan, Australia and South Korea.
Singapore Tags Market Synopsis
The Singapore tags market provides labeling and tagging solutions used in various industries, including retail and logistics. Trends emphasize RFID technology, inventory management, and product traceability. The market outlook depends on retail operations, supply chain management, and innovations in tag technology.
Drivers of the Market
The Singapore tags market is poised for growth as retail and logistics industries require tags and labels for product identification and tracking purposes. Tags are essential for inventory management and branding. As e-commerce and supply chain operations continue to expand, the demand for tags is expected to rise, positioning them as a growth driver in the market.
Challenges of the Market
The tags market in Singapore faces challenges related to labeling solutions, tag durability, and market competition. Meeting the labeling requirements of various industries and ensuring tag longevity is essential. Navigating labeling trends, promoting tag versatility, and competing with alternative labeling methods are key challenges for market sustainability.
COVID-19 Impact on the Market
The tags market in Singapore experienced disruptions during the COVID-19 pandemic, with fluctuations in demand from retail and logistics sectors. However, as businesses and e-commerce activities rebound, the market is anticipated to recover. Tags are essential for labeling and tracking products and packages.
Key Players in the Market
Tags are used in retail, logistics, and labeling. Key players may include tag and label manufacturers like Avery Dennison and local suppliers of labeling solutions.
Key Highlights of the Report:
- Singapore Tags Market Outlook
- Market Size of Singapore Tags Market, 2024
- Forecast of Singapore Tags Market, 2031
- Historical Data and Forecast of Singapore Tags Revenues & Volume for the Period 2021-2031
- Singapore Tags Market Trend Evolution
- Singapore Tags Market Drivers and Challenges
- Singapore Tags Price Trends
- Singapore Tags Porter's Five Forces
- Singapore Tags Industry Life Cycle
- Historical Data and Forecast of Singapore Tags Market Revenues & Volume By Material Type for the Period 2021-2031
- Historical Data and Forecast of Singapore Tags Market Revenues & Volume By Plastic for the Period 2021-2031
- Historical Data and Forecast of Singapore Tags Market Revenues & Volume By Paper for the Period 2021-2031
- Historical Data and Forecast of Singapore Tags Market Revenues & Volume By Fibers for the Period 2021-2031
- Historical Data and Forecast of Singapore Tags Market Revenues & Volume By Others (Metal, etc.) for the Period 2021-2031
- Historical Data and Forecast of Singapore Tags Market Revenues & Volume By Tag Type for the Period 2021-2031
- Historical Data and Forecast of Singapore Tags Market Revenues & Volume By RFID Tag for the Period 2021-2031
- Historical Data and Forecast of Singapore Tags Market Revenues & Volume By Hang/ Swing Tag for the Period 2021-2031
- Historical Data and Forecast of Singapore Tags Market Revenues & Volume By Loop Tag for the Period 2021-2031
- Historical Data and Forecast of Singapore Tags Market Revenues & Volume By End Use for the Period 2021-2031
- Historical Data and Forecast of Singapore Tags Market Revenues & Volume By Food & Beverage for the Period 2021-2031
- Historical Data and Forecast of Singapore Tags Market Revenues & Volume By Clothing & Apparels for the Period 2021-2031
- Historical Data and Forecast of Singapore Tags Market Revenues & Volume By Hospitality & Travel for the Period 2021-2031
- Historical Data and Forecast of Singapore Tags Market Revenues & Volume By Beauty & Personal Care for the Period 2021-2031
- Historical Data and Forecast of Singapore Tags Market Revenues & Volume By Consumer Electronics for the Period 2021-2031
- Historical Data and Forecast of Singapore Tags Market Revenues & Volume By Others for the Period 2021-2031
- Singapore Tags Import Export Trade Statistics
- Market Opportunity Assessment By Material Type
- Market Opportunity Assessment By Tag Type
- Market Opportunity Assessment By End Use
- Singapore Tags Top Companies Market Share
- Singapore Tags Competitive Benchmarking By Technical and Operational Parameters
- Singapore Tags Company Profiles
- Singapore Tags Key Strategic Recommendations
Frequently Asked Questions About the Market Study (FAQs):
6Wresearch actively monitors the Singapore Tags Market and publishes its comprehensive annual report, highlighting emerging trends, growth drivers, revenue analysis, and forecast outlook. Our insights help businesses to make data-backed strategic decisions with ongoing market dynamics. Our analysts track relevent industries related to the Singapore Tags Market, allowing our clients with actionable intelligence and reliable forecasts tailored to emerging regional needs.
Yes, we provide customisation as per your requirements. To learn more, feel free to contact us on sales@6wresearch.com
1 Executive Summary |
2 Introduction |
2.1 Key Highlights of the Report |
2.2 Report Description |
2.3 Market Scope & Segmentation |
2.4 Research Methodology |
2.5 Assumptions |
3 Singapore Tags Market Overview |
3.1 Singapore Country Macro Economic Indicators |
3.2 Singapore Tags Market Revenues & Volume, 2021 & 2031F |
3.3 Singapore Tags Market - Industry Life Cycle |
3.4 Singapore Tags Market - Porter's Five Forces |
3.5 Singapore Tags Market Revenues & Volume Share, By Material Type, 2021 & 2031F |
3.6 Singapore Tags Market Revenues & Volume Share, By Tag Type, 2021 & 2031F |
3.7 Singapore Tags Market Revenues & Volume Share, By End Use, 2021 & 2031F |
4 Singapore Tags Market Dynamics |
4.1 Impact Analysis |
4.2 Market Drivers |
4.2.1 Increasing adoption of IoT technology in various industries leading to the need for asset tracking solutions |
4.2.2 Government initiatives promoting smart city development and efficient asset management |
4.2.3 Rising demand for real-time location tracking and monitoring of assets for improved operational efficiency |
4.3 Market Restraints |
4.3.1 Data security and privacy concerns related to the use of tracking technologies |
4.3.2 High initial investments required for implementing advanced asset tracking solutions |
4.3.3 Lack of standardized regulations and interoperability issues among different tracking systems |
5 Singapore Tags Market Trends |
6 Singapore Tags Market, By Types |
6.1 Singapore Tags Market, By Material Type |
6.1.1 Overview and Analysis |
6.1.2 Singapore Tags Market Revenues & Volume, By Material Type, 2021-2031F |
6.1.3 Singapore Tags Market Revenues & Volume, By Plastic, 2021-2031F |
6.1.4 Singapore Tags Market Revenues & Volume, By Paper, 2021-2031F |
6.1.5 Singapore Tags Market Revenues & Volume, By Fibers, 2021-2031F |
6.1.6 Singapore Tags Market Revenues & Volume, By Others (Metal, etc.), 2021-2031F |
6.2 Singapore Tags Market, By Tag Type |
6.2.1 Overview and Analysis |
6.2.2 Singapore Tags Market Revenues & Volume, By RFID Tag, 2021-2031F |
6.2.3 Singapore Tags Market Revenues & Volume, By Hang/ Swing Tag, 2021-2031F |
6.2.4 Singapore Tags Market Revenues & Volume, By Loop Tag, 2021-2031F |
6.3 Singapore Tags Market, By End Use |
6.3.1 Overview and Analysis |
6.3.2 Singapore Tags Market Revenues & Volume, By Food & Beverage, 2021-2031F |
6.3.3 Singapore Tags Market Revenues & Volume, By Clothing & Apparels, 2021-2031F |
6.3.4 Singapore Tags Market Revenues & Volume, By Hospitality & Travel, 2021-2031F |
6.3.5 Singapore Tags Market Revenues & Volume, By Beauty & Personal Care, 2021-2031F |
6.3.6 Singapore Tags Market Revenues & Volume, By Consumer Electronics, 2021-2031F |
6.3.7 Singapore Tags Market Revenues & Volume, By Others, 2021-2031F |
7 Singapore Tags Market Import-Export Trade Statistics |
7.1 Singapore Tags Market Export to Major Countries |
7.2 Singapore Tags Market Imports from Major Countries |
8 Singapore Tags Market Key Performance Indicators |
8.1 Average response time for asset location queries |
8.2 Percentage increase in asset utilization rates after implementing tracking solutions |
8.3 Reduction in maintenance costs due to improved asset tracking and monitoring |
8.4 Number of successful asset recovery incidents using tracking technology |
8.5 Improvement in operational efficiency metrics such as asset downtime and idle time |
9 Singapore Tags Market - Opportunity Assessment |
9.1 Singapore Tags Market Opportunity Assessment, By Material Type, 2021 & 2031F |
9.2 Singapore Tags Market Opportunity Assessment, By Tag Type, 2021 & 2031F |
9.3 Singapore Tags Market Opportunity Assessment, By End Use, 2021 & 2031F |
10 Singapore Tags Market - Competitive Landscape |
10.1 Singapore Tags Market Revenue Share, By Companies, 2024 |
10.2 Singapore Tags Market Competitive Benchmarking, By Operating and Technical Parameters |
11 Company Profiles |
12 Recommendations |
13 Disclaimer |
Global Go To Market Strategy - 2030
Export potential enables firms to identify high-growth global markets with greater confidence by combining advanced trade intelligence with a structured quantitative methodology. The framework analyzes emerging demand trends and country-level import patterns while integrating macroeconomic and trade datasets such as GDP and population forecasts, bilateral import–export flows, tariff structures, elasticity differentials between developed and developing economies, geographic distance, and import demand projections. Using weighted trade values from 2020–2024 as the base period to project country-to-country export potential for 2030, these inputs are operationalized through calculated drivers such as gravity model parameters, tariff impact factors, and projected GDP per-capita growth. Through an analysis of hidden potentials, demand hotspots, and market conditions that are most favorable to success, this method enables firms to focus on target countries, maximize returns, and global expansion with data, backed by accuracy.
By factoring in the projected importer demand gap that is currently unmet and could be potential opportunity, it identifies the potential for the Exporter (Country) among 190 countries, against the general trade analysis, which identifies the biggest importer or exporter.
To discover high-growth global markets and optimize your business strategy:
Click Here
Pricing
- Single User License$ 1,995
- Department License$ 2,400
- Site License$ 3,120
- Global License$ 3,795

Leadership Perspectives from Industry Events
Search
Thought Leadership and Analyst Meet


Our Clients
6WResearch In News
- India Air Conditioner Market Set for Strong Rebound in 2026 After Weather-Led Correction and GST-Driven Recovery: 6Wresearch
- ADAS in India: How Automatic Emergency Braking, Blind Spot Detection & Driver Monitoring are Transforming Road Safety
- Doha a strategic location for EV manufacturing hub: IPA Qatar
- Demand for luxury TVs surging in the GCC, says Samsung
- Empowering Growth: The Thriving Journey of Bangladesh’s Cable Industry
- Demand for luxury TVs surging in the GCC, says Samsung
Latest Reports
- Poland Fire Protection Systems Market (2026-2032)
- Cape Verde Portable Hand-Thrown Extinguisher Market (2026-2032)
- Canada Portable Hand-Thrown Extinguisher Market (2026-2032)
- Cameroon Portable Hand-Thrown Extinguisher Market (2026-2032)
- Burundi Portable Hand-Thrown Extinguisher Market (2026-2032)
- Burkina Faso Portable Hand-Thrown Extinguisher Market (2026-2032)
- Bulgaria Portable Hand-Thrown Extinguisher Market (2026-2032)
- Brunei Portable Hand-Thrown Extinguisher Market (2026-2032)
- Botswana Portable Hand-Thrown Extinguisher Market (2026-2032)
- Bosnia and Herzegovina Portable Hand-Thrown Extinguisher Market (2026-2032)
Industry Events and Analyst Meet

HIMTEX 2026

India Refining Summit 2026

India EV Show 2026

EV tech India Expo 2026

Auto Tech Asia 2026
Whitepaper
- Middle East & Africa Commercial Security Market Click here to view more.
- Middle East & Africa Fire Safety Systems & Equipment Market Click here to view more.
- GCC Drone Market Click here to view more.
- Middle East Lighting Fixture Market Click here to view more.
- GCC Physical & Perimeter Security Market Click here to view more.