Singapore Tartaric acid Market (2026-2032) Outlook | Forecast, Share, Revenue, Size, Companies, Value, Analysis, Growth, Trends & Industry
Market Forecast By Source (Grapes & sun-dried raisins, Maleic anhydride, Others), By Application (Food & beverages, Pharmaceuticals, Cosmetics & personal care products, Others), By Type (Naturals, Synthetic) And Competitive Landscape
| Product Code: ETC085426 | Publication Date: Jun 2021 | Updated Date: Mar 2026 | Product Type: Report | |
| Publisher: 6Wresearch | Author: Ravi Bhandari | No. of Pages: 70 | No. of Figures: 35 | No. of Tables: 5 |
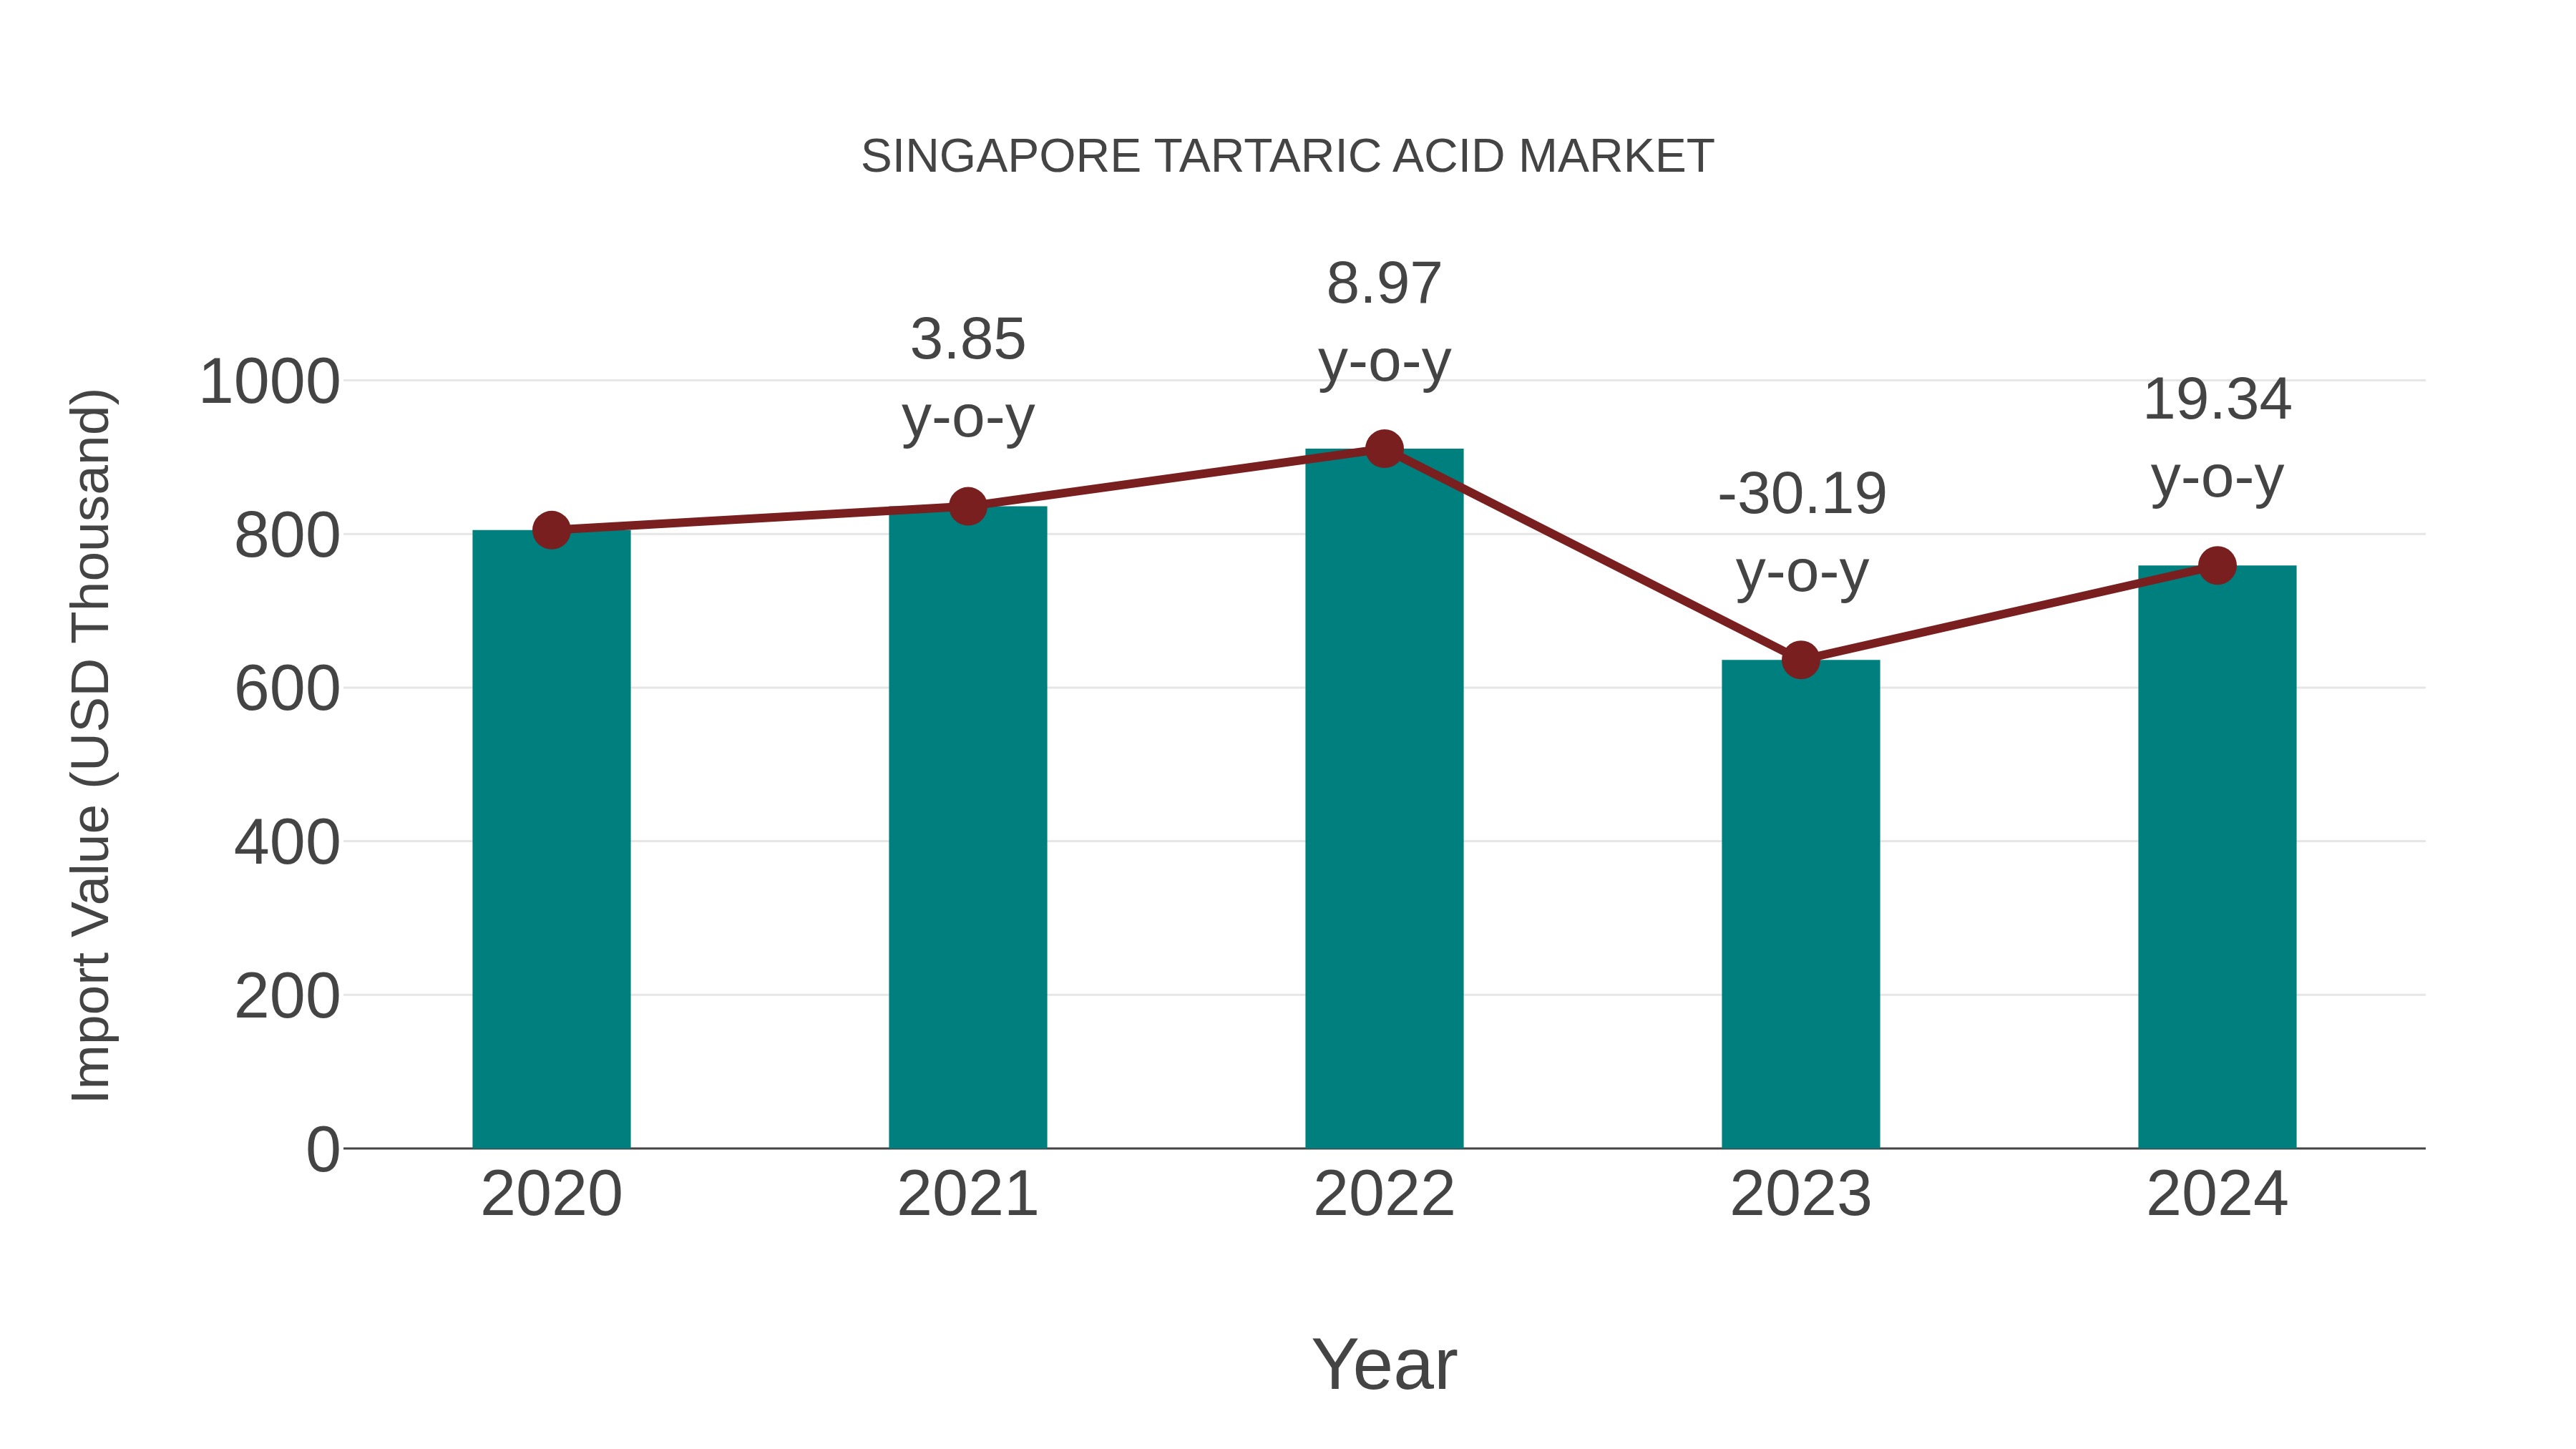
Singapore Tartaric Acid Market: Import Trend Analysis
In 2024, Singapore`s tartaric acid market saw a steady increase in imports. The trend indicated a growing demand for tartaric acid within the country, potentially driven by the food and beverage industry`s requirements for this key ingredient.
Tartaric acid Market: Singapore vs Top 5 Major Economies in 2027 (Asia)
The Tartaric acid market in Singapore is projected to grow at a stable growth rate of 0.00% by 2027, highlighting the country's increasing focus on advanced technologies within the Asia region, where China holds the dominant position, followed closely by India, Japan, Australia and South Korea, shaping overall regional demand.

Singapore Tartaric Acid Market Synopsis
Tartaric acid, primarily used in the food and beverage industry as an acidulant and stabilizing agent, holds a steady position in the Singaporean market. Its outlook is closely linked to the growth of the F&B sector. The demand for tartaric acid is expected to remain stable as the food industry continues to innovate and create new products. Market players should monitor consumer trends, such as the rising demand for clean label ingredients, to stay competitive in this segment. Additionally, exploring applications in industries beyond F&B, such as pharmaceuticals and cosmetics, may present growth opportunities.
Drivers of the Market
The Singapore tartaric acid market is expected to experience steady growth, primarily driven by its applications in the food and beverage industry. Tartaric acid is commonly used as an acidulant and stabilizing agent in food products, such as jams, jellies, and beverages. As consumer preferences for natural and clean-label ingredients grow, the demand for tartaric acid sourced from grapes is likely to increase. Additionally, the pharmaceutical and cosmetic sectors may also contribute to the market`s growth.
Challenges of the Market
The Singapore tartaric acid market is confronting various challenges that affect its dynamics. One significant challenge is the limited availability of natural sources for tartaric acid production, primarily grapes. This scarcity of raw materials can lead to supply constraints and potential price fluctuations. Additionally, the market faces competition from synthetic tartaric acid, which can offer cost advantages. The stringent quality and purity standards required in industries like food and beverage also pose challenges for tartaric acid manufacturers. Meeting these standards can require significant investments in quality control and testing.
COVID-19 Impact on the Market
The tartaric acid market, primarily used in the food and beverage industry, experienced disruptions during the pandemic. As restaurants and catering services faced restrictions, the demand for processed foods and beverages declined initially. However, as consumers turned to home cooking and baking, there was a resurgence in demand for tartaric acid in food preparation. The market adapted by targeting home chefs and home-based food businesses, which contributed to its recovery.
Key Players in the Market
The tartaric acid market in Singapore is anticipated to show stable growth, primarily due to its applications in the food and beverage industry. Major players in this sector include international companies like Archer Daniels Midland (ADM) and local distributors.
Key Highlights of the Report:
- Singapore Tartaric acid Market Outlook
- Market Size of Singapore Tartaric acid Market, 2025
- Forecast of Singapore Tartaric acid Market, 2032
- Historical Data and Forecast of Singapore Tartaric acid Revenues & Volume for the Period 2022-2032F
- Singapore Tartaric acid Market Trend Evolution
- Singapore Tartaric acid Market Drivers and Challenges
- Singapore Tartaric acid Price Trends
- Singapore Tartaric acid Porter's Five Forces
- Singapore Tartaric acid Industry Life Cycle
- Historical Data and Forecast of Singapore Tartaric acid Market Revenues & Volume By Source for the Period 2022-2032F
- Historical Data and Forecast of Singapore Tartaric acid Market Revenues & Volume By Grapes & sun-dried raisins for the Period 2022-2032F
- Historical Data and Forecast of Singapore Tartaric acid Market Revenues & Volume By Maleic anhydride for the Period 2022-2032F
- Historical Data and Forecast of Singapore Tartaric acid Market Revenues & Volume By Others for the Period 2022-2032F
- Historical Data and Forecast of Singapore Tartaric acid Market Revenues & Volume By Application for the Period 2022-2032F
- Historical Data and Forecast of Singapore Tartaric acid Market Revenues & Volume By Food & beverages for the Period 2022-2032F
- Historical Data and Forecast of Singapore Tartaric acid Market Revenues & Volume By Pharmaceuticals for the Period 2022-2032F
- Historical Data and Forecast of Singapore Tartaric acid Market Revenues & Volume By Cosmetics & personal care products for the Period 2022-2032F
- Historical Data and Forecast of Singapore Tartaric acid Market Revenues & Volume By Others for the Period 2022-2032F
- Historical Data and Forecast of Singapore Tartaric acid Market Revenues & Volume By Type for the Period 2022-2032F
- Historical Data and Forecast of Singapore Tartaric acid Market Revenues & Volume By Naturals for the Period 2022-2032F
- Historical Data and Forecast of Singapore Tartaric acid Market Revenues & Volume By Synthetic for the Period 2022-2032F
- Singapore Tartaric acid Import Export Trade Statistics
- Market Opportunity Assessment By Source
- Market Opportunity Assessment By Application
- Market Opportunity Assessment By Type
- Singapore Tartaric acid Top Companies Market Share
- Singapore Tartaric acid Competitive Benchmarking By Technical and Operational Parameters
- Singapore Tartaric acid Company Profiles
- Singapore Tartaric acid Key Strategic Recommendations
Singapore Tartaric acid Market (2026-2032): FAQs
6Wresearch actively monitors the Singapore Tartaric acid Market and publishes its comprehensive annual report, highlighting emerging trends, growth drivers, revenue analysis, and forecast outlook. Our insights help businesses to make data-backed strategic decisions with ongoing market dynamics. Our analysts track relevent industries related to the Singapore Tartaric acid Market, allowing our clients with actionable intelligence and reliable forecasts tailored to emerging regional needs.
Yes, we provide customisation as per your requirements. To learn more, feel free to contact us on sales@6wresearch.com
1 Executive Summary |
2 Introduction |
2.1 Key Highlights of the Report |
2.2 Report Description |
2.3 Market Scope & Segmentation |
2.4 Research Methodology |
2.5 Assumptions |
3 Singapore Tartaric acid Market Overview |
3.1 Singapore Country Macro Economic Indicators |
3.2 Singapore Tartaric acid Market Revenues & Volume, 2022 & 2032F |
3.3 Singapore Tartaric acid Market - Industry Life Cycle |
3.4 Singapore Tartaric acid Market - Porter's Five Forces |
3.5 Singapore Tartaric acid Market Revenues & Volume Share, By Source, 2022 & 2032F |
3.6 Singapore Tartaric acid Market Revenues & Volume Share, By Application, 2022 & 2032F |
3.7 Singapore Tartaric acid Market Revenues & Volume Share, By Type, 2022 & 2032F |
4 Singapore Tartaric acid Market Dynamics |
4.1 Impact Analysis |
4.2 Market Drivers |
4.3 Market Restraints |
5 Singapore Tartaric acid Market Trends |
6 Singapore Tartaric acid Market, By Types |
6.1 Singapore Tartaric acid Market, By Source |
6.1.1 Overview and Analysis |
6.1.2 Singapore Tartaric acid Market Revenues & Volume, By Source, 2022-2032F |
6.1.3 Singapore Tartaric acid Market Revenues & Volume, By Grapes & sun-dried raisins, 2022-2032F |
6.1.4 Singapore Tartaric acid Market Revenues & Volume, By Maleic anhydride, 2022-2032F |
6.1.5 Singapore Tartaric acid Market Revenues & Volume, By Others, 2022-2032F |
6.2 Singapore Tartaric acid Market, By Application |
6.2.1 Overview and Analysis |
6.2.2 Singapore Tartaric acid Market Revenues & Volume, By Food & beverages, 2022-2032F |
6.2.3 Singapore Tartaric acid Market Revenues & Volume, By Pharmaceuticals, 2022-2032F |
6.2.4 Singapore Tartaric acid Market Revenues & Volume, By Cosmetics & personal care products, 2022-2032F |
6.2.5 Singapore Tartaric acid Market Revenues & Volume, By Others, 2022-2032F |
6.3 Singapore Tartaric acid Market, By Type |
6.3.1 Overview and Analysis |
6.3.2 Singapore Tartaric acid Market Revenues & Volume, By Naturals, 2022-2032F |
6.3.3 Singapore Tartaric acid Market Revenues & Volume, By Synthetic, 2022-2032F |
7 Singapore Tartaric acid Market Import-Export Trade Statistics |
7.1 Singapore Tartaric acid Market Export to Major Countries |
7.2 Singapore Tartaric acid Market Imports from Major Countries |
8 Singapore Tartaric acid Market Key Performance Indicators |
9 Singapore Tartaric acid Market - Opportunity Assessment |
9.1 Singapore Tartaric acid Market Opportunity Assessment, By Source, 2022 & 2032F |
9.2 Singapore Tartaric acid Market Opportunity Assessment, By Application, 2022 & 2032F |
9.3 Singapore Tartaric acid Market Opportunity Assessment, By Type, 2022 & 2032F |
10 Singapore Tartaric acid Market - Competitive Landscape |
10.1 Singapore Tartaric acid Market Revenue Share, By Companies, 2025 |
10.2 Singapore Tartaric acid Market Competitive Benchmarking, By Operating and Technical Parameters |
11 Company Profiles |
12 Recommendations |
13 Disclaimer |
Global Go To Market Strategy - 2030
Export potential enables firms to identify high-growth global markets with greater confidence by combining advanced trade intelligence with a structured quantitative methodology. The framework analyzes emerging demand trends and country-level import patterns while integrating macroeconomic and trade datasets such as GDP and population forecasts, bilateral import–export flows, tariff structures, elasticity differentials between developed and developing economies, geographic distance, and import demand projections. Using weighted trade values from 2020–2024 as the base period to project country-to-country export potential for 2030, these inputs are operationalized through calculated drivers such as gravity model parameters, tariff impact factors, and projected GDP per-capita growth. Through an analysis of hidden potentials, demand hotspots, and market conditions that are most favorable to success, this method enables firms to focus on target countries, maximize returns, and global expansion with data, backed by accuracy.
By factoring in the projected importer demand gap that is currently unmet and could be potential opportunity, it identifies the potential for the Exporter (Country) among 190 countries, against the general trade analysis, which identifies the biggest importer or exporter.
To discover high-growth global markets and optimize your business strategy:
Click Here
Pricing
- Single User License$ 1,995
- Department License$ 2,400
- Site License$ 3,120
- Global License$ 3,795

Leadership Perspectives from Industry Events
Search
Thought Leadership and Analyst Meet


Our Clients
6WResearch In News
- India Air Conditioner Market Set for Strong Rebound in 2026 After Weather-Led Correction and GST-Driven Recovery: 6Wresearch
- ADAS in India: How Automatic Emergency Braking, Blind Spot Detection & Driver Monitoring are Transforming Road Safety
- Doha a strategic location for EV manufacturing hub: IPA Qatar
- Demand for luxury TVs surging in the GCC, says Samsung
- Empowering Growth: The Thriving Journey of Bangladesh’s Cable Industry
- Demand for luxury TVs surging in the GCC, says Samsung
Latest Reports
- Nicaragua RPG Gaming Market (2026-2032)
- New Zealand RPG Gaming Market (2026-2032)
- Netherlands RPG Gaming Market (2026-2032)
- Nauru RPG Gaming Market (2026-2032)
- Namibia RPG Gaming Market (2026-2032)
- Mozambique RPG Gaming Market (2026-2032)
- Montenegro RPG Gaming Market (2026-2032)
- Mongolia RPG Gaming Market (2026-2032)
- Monaco RPG Gaming Market (2026-2032)
- Micronesia RPG Gaming Market (2026-2032)
Industry Events and Analyst Meet

EV India Expo 2026

HIMTEX 2026

India Refining Summit 2026

India EV Show 2026

EV tech India Expo 2026
Whitepaper
- Middle East & Africa Commercial Security Market Click here to view more.
- Middle East & Africa Fire Safety Systems & Equipment Market Click here to view more.
- GCC Drone Market Click here to view more.
- Middle East Lighting Fixture Market Click here to view more.
- GCC Physical & Perimeter Security Market Click here to view more.