Slovakia Interactive Tables Market (2026-2032) Outlook | Companies, Growth, Share, Size, Industry, Forecast, Trends, Value, Analysis & Revenue
Market Forecast By Technology (LCD, LED, Capacitive, Others), By Screen Size (32-65 Inch, 65 Inch & Above), By Application (Exhibition & Trade Shows, Education, Retail, Control Room, Hospitality, Transportation, Others) And Competitive Landscape
| Product Code: ETC275060 | Publication Date: Aug 2022 | Updated Date: Jul 2026 | Product Type: Market Research Report | |
| Publisher: 6Wresearch | Author: Bhawna Singh | No. of Pages: 75 | No. of Figures: 35 | No. of Tables: 20 |
Slovakia Interactive Tables Market Size, Share & Growth Rate
The Slovakia Interactive Tables Market was estimated at USD 373 Million in 2025 and is projected to reach USD 542 Million by 2032, growing at a CAGR of 5.5% from 2026 to 2032. This growth trajectory is propelled by the increasing integration of interactive tables in educational institutions and corporate environments, where enhancing collaboration and engagement has become paramount. Additionally, the retail sector is witnessing a shift towards more interactive customer experiences, further driving demand.
Slovakia Interactive Tables Market Year-wise Growth Rate and Key Drivers
This graph highlights how the Slovakia Interactive Tables Market has steadily grown over the years, supported by major growth factors.
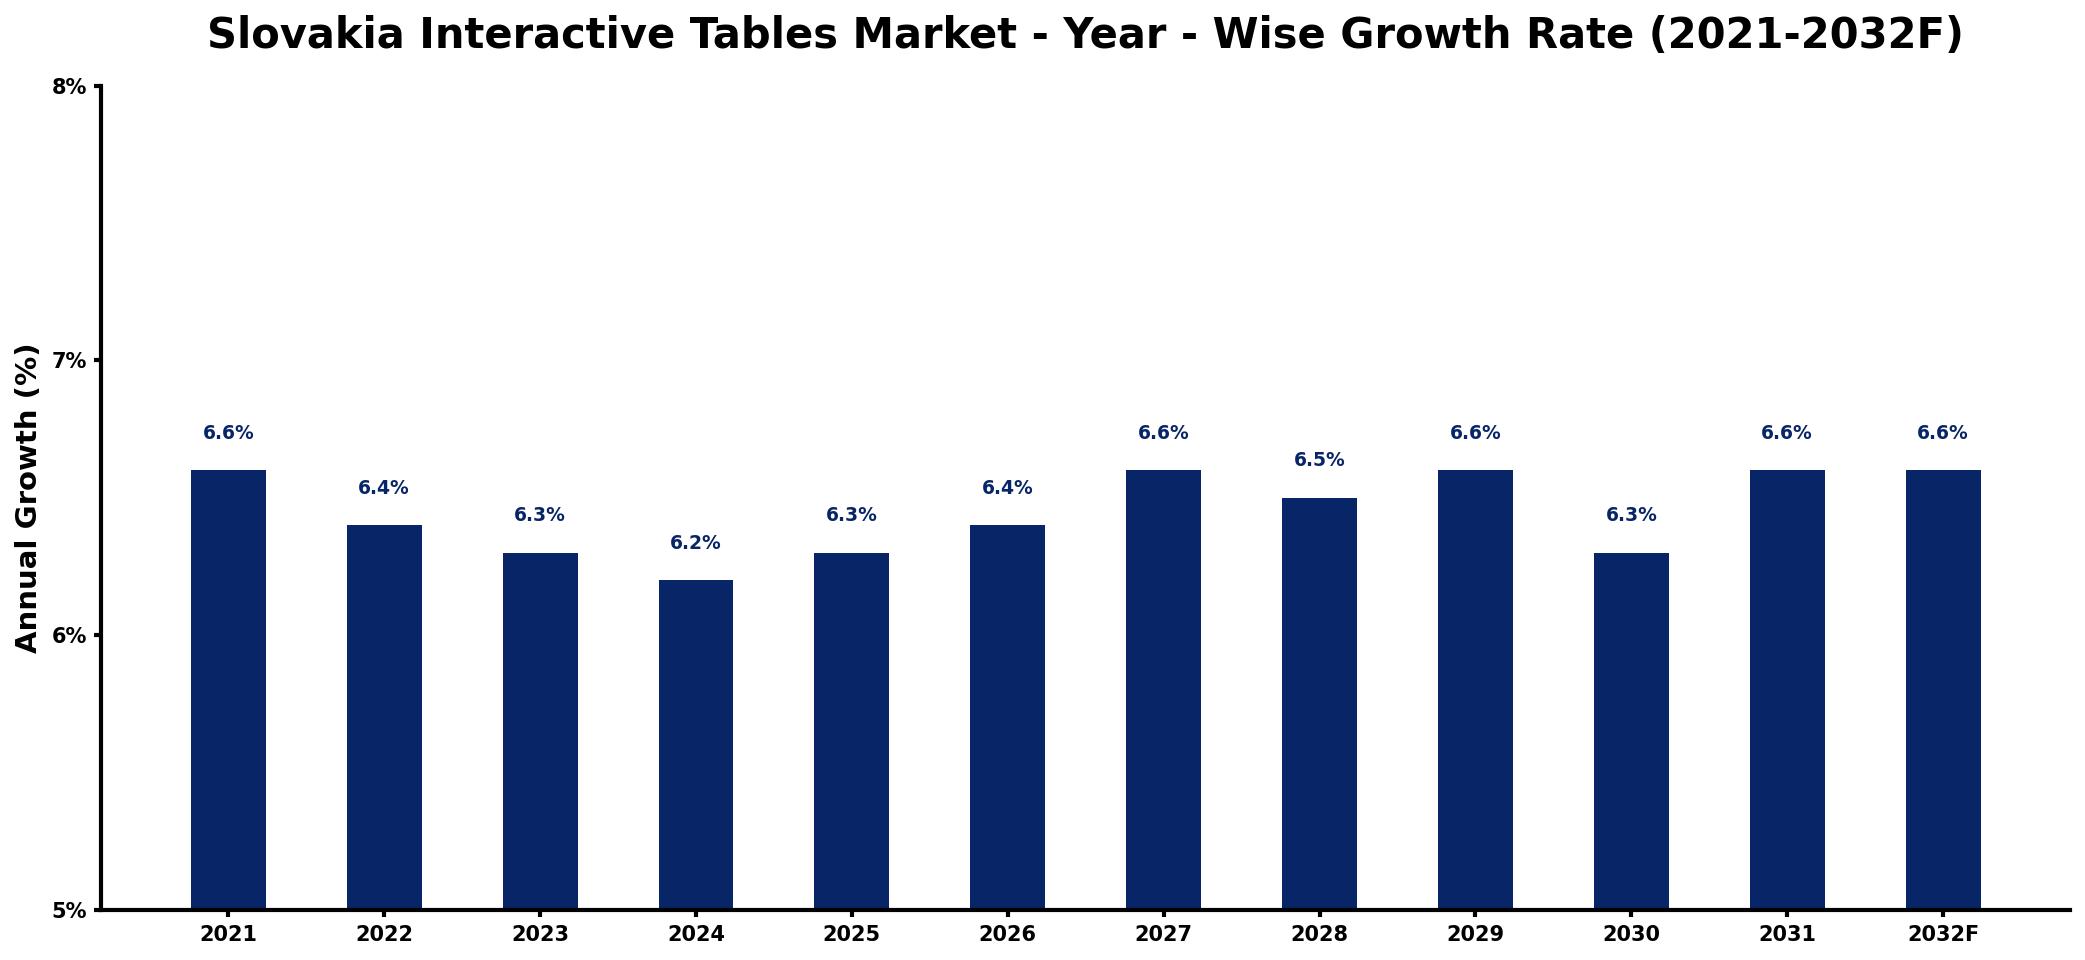
The table below presents the year‑wise growth rates along with the key drivers influencing the market
| Year | Growth Rate | Major Drivers |
| 2021 | 6.6% | increased demand for digital solutions |
| 2022 | 6.4% | growing investment in technology infrastructure |
| 2023 | 6.3% | expansion of educational technology initiatives |
| 2024 | 6.2% | rising popularity of collaborative spaces |
| 2025 | 6.3% | enhanced user engagement through innovation |
| 2026 | 6.4% | adoption of smart office environments |
| 2027 | 6.6% | growing trend in remote collaboration |
| 2028 | 6.5% | increased focus on experiential learning |
| 2029 | 6.6% | rising export shipment volumes |
| 2030 | 6.3% | emphasis on sustainable technology practices |
| 2031 | 6.6% | enhanced integration with mobile devices |
| 2032 | 6.6% | rising infrastructure development spending |
Note: Market size estimations and growth projections presented in this report are based on 6Wresearch's proprietary forecasting methodology, utilizing the latest available industry data, government publications, and primary research inputs.
Slovakia Interactive Tables Market Synopsis
In Slovakia, the interactive tables market is rapidly evolving, reflecting broader trends in digital engagement and collaboration. With educational institutions embracing innovative learning tools, these tables are becoming vital in enhancing student participation and interaction.
Moreover, in corporate and retail settings, interactive tables are redefining how businesses engage with their customers. The focus on immersive experiences and streamlined operations is pushing organizations to invest in advanced technology solutions that cater to these new expectations.
Slovakia Interactive Tables Market Key Takeaways
- Increasing adoption of interactive tables in education, hospitality, and retail is fueling market growth.
- Advanced features like multi-touch functionality and augmented reality are enhancing user engagement.
- Government policies supporting digitalization are creating a favorable environment for market expansion.
- Awareness and understanding of interactive tables among consumers remain a hurdle for greater market penetration.
- Strategic investments in R&D are essential for maintaining competitive advantages in an evolving market landscape.
Evaluation of Restraints in Slovakia Interactive Tables Market
Despite the promising growth of the Slovakia interactive tables market, several constraints limit its full potential. A significant challenge is the limited consumer awareness regarding the benefits and practical applications of these tables. Many potential users remain uninformed about how these tools can enhance interactivity and productivity. Additionally, the high initial investment required for acquiring advanced interactive tables can deter small to medium-sized enterprises from making purchases. Coupled with the fast-paced advancements in technology, companies must consistently innovate to keep pace with evolving customer preferences, creating further barriers to market entry.
Slovakia Interactive Tables Market Trends
The market is currently witnessing several trends that are shaping the future of interactive tables in Slovakia. A notable trend is the increasing integration of augmented reality features, which enhances user experiences and facilitates interactive learning. Moreover, touchless interaction technologies are gaining traction, particularly in sectors like hospitality, where hygiene and safety are paramount post-pandemic. Additionally, the growing preference for customized interactive solutions tailored to specific industry needs is driving innovation among manufacturers.
Slovakia Interactive Tables Market Opportunities
The Slovakia Interactive Tables Market presents an array of investment opportunities, especially as various sectors, including education and retail, seek to innovate. Companies that can offer cutting-edge solutions tailored to enhance collaboration and engagement will find a receptive audience. Furthermore, as digital transformation accelerates, businesses are increasingly recognizing the value of interactive technology, thereby expanding the markets growth potential. The emergence of trends toward augmented reality and advanced touch functionalities also signal rich avenues for investment and product development.
Government Initiatives in the Slovakia Interactive Tables Market
The Slovakian government is actively promoting digitalization across various sectors, which supports the growth of the interactive tables market. Through investment incentives, tax breaks, and funding opportunities, the government is fostering a conducive environment for companies involved in the production and distribution of interactive tables. Policies aimed at enhancing educational technology and supporting business modernization further augment the demand for these innovative tools, creating a robust platform for market expansion.
Future Insights of the Slovakia Interactive Tables Market
Looking ahead to 2026-2032, the Slovakia Interactive Tables Market is poised for steady growth. As more educational institutions and businesses leverage interactive technologies to improve engagement, the demand for innovative solutions will continue to rise. The integration of advanced technologies such as IoT and improved interactive features will likely emerge as key drivers of market expansion. Additionally, as consumer awareness and education surrounding these products increase, the market's potential for growth and adaptation will expand significantly.
Slovakia Interactive Tables Market Latest Developments (2025 - 2026)
In recent months, the Slovakia Interactive Tables Market has seen an increase in product innovations, particularly in response to the growing demand for immersive technology in classrooms and corporate settings. Companies have begun to focus on the development of customizable solutions that meet the specific needs of different sectors. Additionally, there has been a notable rise in partnerships between educational institutions and technology providers, aimed at enhancing the learning experience through interactive technologies.
Slovakia Interactive Tables Market - Key Attractiveness of the Report
- 10 Years of Market Numbers
- Historical Data Starting from 2022 to 2025
- Base Year: 2025
- Forecast Data until 2032
- Key Performance Indicators Impacting the Market
- Major Upcoming Developments and Projects
Key Highlights of the Report:
- Slovakia Interactive Tables Market Outlook
- Market Size of Slovakia Interactive Tables Market, 2025
- Forecast of Slovakia Interactive Tables Market, 2032
- Historical Data and Forecast of Slovakia Interactive Tables Revenues & Volume for the Period 2022-2032F
- Slovakia Interactive Tables Market Trend Evolution
- Slovakia Interactive Tables Market Drivers and Challenges
- Slovakia Interactive Tables Price Trends
- Slovakia Interactive Tables Porter's Five Forces
- Slovakia Interactive Tables Industry Life Cycle
- Historical Data and Forecast of Slovakia Interactive Tables Market Revenues & Volume By Technology for the Period 2022-2032F
- Historical Data and Forecast of Slovakia Interactive Tables Market Revenues & Volume By LCD for the Period 2022-2032F
- Historical Data and Forecast of Slovakia Interactive Tables Market Revenues & Volume By LED for the Period 2022-2032F
- Historical Data and Forecast of Slovakia Interactive Tables Market Revenues & Volume By Capacitive for the Period 2022-2032F
- Historical Data and Forecast of Slovakia Interactive Tables Market Revenues & Volume By Others for the Period 2022-2032F
- Historical Data and Forecast of Slovakia Interactive Tables Market Revenues & Volume By Screen Size for the Period 2022-2032F
- Historical Data and Forecast of Slovakia Interactive Tables Market Revenues & Volume By 32-65 Inch for the Period 2022-2032F
- Historical Data and Forecast of Slovakia Interactive Tables Market Revenues & Volume By 65 Inch & Above for the Period 2022-2032F
- Historical Data and Forecast of Slovakia Interactive Tables Market Revenues & Volume By Application for the Period 2022-2032F
- Historical Data and Forecast of Slovakia Interactive Tables Market Revenues & Volume By Exhibition & Trade Shows for the Period 2022-2032F
- Historical Data and Forecast of Slovakia Interactive Tables Market Revenues & Volume By Education for the Period 2022-2032F
- Historical Data and Forecast of Slovakia Interactive Tables Market Revenues & Volume By Retail for the Period 2022-2032F
- Historical Data and Forecast of Slovakia Interactive Tables Market Revenues & Volume By Control Room for the Period 2022-2032F
- Historical Data and Forecast of Slovakia Interactive Tables Market Revenues & Volume By Hospitality for the Period 2022-2032F
- Historical Data and Forecast of Slovakia Interactive Tables Market Revenues & Volume By Transportation for the Period 2022-2032F
- Historical Data and Forecast of Slovakia Interactive Tables Market Revenues & Volume By Others for the Period 2022-2032F
- Slovakia Interactive Tables Import Export Trade Statistics
- Market Opportunity Assessment By Technology
- Market Opportunity Assessment By Screen Size
- Market Opportunity Assessment By Application
- Slovakia Interactive Tables Top Companies Market Share
- Slovakia Interactive Tables Competitive Benchmarking By Technical and Operational Parameters
- Slovakia Interactive Tables Company Profiles
- Slovakia Interactive Tables Key Strategic Recommendations
Frequently Asked Questions About the Market Study (FAQs):
The Slovakia Interactive Tables Market is showing robust growth, with increasing adoption across educational, corporate, and retail sectors.
The market is projected to reach USD 542 Million by 2032, reflecting a substantial growth from its estimated size of USD 373 Million in 2025.
Key trends include the integration of augmented reality features, touchless technologies, and the rising demand for tailored interactive solutions.
Challenges include limited consumer awareness and high initial costs, which can restrict wider market penetration.
Supportive government initiatives and policies aimed at promoting digitalization are creating a favorable environment for market growth.
Future innovations are likely to focus on enhanced interactivity, IoT integration, and more sophisticated user interfaces to improve engagement and productivity.
6Wresearch actively monitors the Slovakia Interactive Tables Market and publishes its comprehensive annual report, highlighting emerging trends, growth drivers, revenue analysis, and forecast outlook. Our insights help businesses to make data-backed strategic decisions with ongoing market dynamics. Our analysts track relevent industries related to the Slovakia Interactive Tables Market, allowing our clients with actionable intelligence and reliable forecasts tailored to emerging regional needs.
Yes, we provide customisation as per your requirements. To learn more, feel free to contact us on sales@6wresearch.com
1 Executive Summary |
2 Introduction |
2.1 Key Highlights of the Report |
2.2 Report Description |
2.3 Market Scope & Segmentation |
2.4 Research Methodology |
2.5 Assumptions |
3 Slovakia Interactive Tables Market Overview |
3.1 Slovakia Country Macro Economic Indicators |
3.2 Slovakia Interactive Tables Market Revenues & Volume, 2022 & 2032F |
3.3 Slovakia Interactive Tables Market - Industry Life Cycle |
3.4 Slovakia Interactive Tables Market - Porter's Five Forces |
3.5 Slovakia Interactive Tables Market Revenues & Volume Share, By Technology, 2022 & 2032F |
3.6 Slovakia Interactive Tables Market Revenues & Volume Share, By Screen Size, 2022 & 2032F |
3.7 Slovakia Interactive Tables Market Revenues & Volume Share, By Application, 2022 & 2032F |
4 Slovakia Interactive Tables Market Dynamics |
4.1 Impact Analysis |
4.2 Market Drivers |
4.2.1 Increasing demand for interactive technology in education and corporate sectors |
4.2.2 Growing trend towards digitalization and smart solutions in public spaces |
4.2.3 Technological advancements leading to more interactive and user-friendly table solutions |
4.3 Market Restraints |
4.3.1 High initial costs associated with implementing interactive tables |
4.3.2 Limited awareness and adoption of interactive table solutions in certain industries |
4.3.3 Lack of standardized regulations and guidelines for interactive table usage |
5 Slovakia Interactive Tables Market Trends |
6 Slovakia Interactive Tables Market, By Types |
6.1 Slovakia Interactive Tables Market, By Technology |
6.1.1 Overview and Analysis |
6.1.2 Slovakia Interactive Tables Market Revenues & Volume, By Technology, 2022-2032F |
6.1.3 Slovakia Interactive Tables Market Revenues & Volume, By LCD, 2022-2032F |
6.1.4 Slovakia Interactive Tables Market Revenues & Volume, By LED, 2022-2032F |
6.1.5 Slovakia Interactive Tables Market Revenues & Volume, By Capacitive, 2022-2032F |
6.1.6 Slovakia Interactive Tables Market Revenues & Volume, By Others, 2022-2032F |
6.2 Slovakia Interactive Tables Market, By Screen Size |
6.2.1 Overview and Analysis |
6.2.2 Slovakia Interactive Tables Market Revenues & Volume, By 32-65 Inch, 2022-2032F |
6.2.3 Slovakia Interactive Tables Market Revenues & Volume, By 65 Inch & Above, 2022-2032F |
6.3 Slovakia Interactive Tables Market, By Application |
6.3.1 Overview and Analysis |
6.3.2 Slovakia Interactive Tables Market Revenues & Volume, By Exhibition & Trade Shows, 2022-2032F |
6.3.3 Slovakia Interactive Tables Market Revenues & Volume, By Education, 2022-2032F |
6.3.4 Slovakia Interactive Tables Market Revenues & Volume, By Retail, 2022-2032F |
6.3.5 Slovakia Interactive Tables Market Revenues & Volume, By Control Room, 2022-2032F |
6.3.6 Slovakia Interactive Tables Market Revenues & Volume, By Hospitality, 2022-2032F |
6.3.7 Slovakia Interactive Tables Market Revenues & Volume, By Transportation, 2022-2032F |
7 Slovakia Interactive Tables Market Import-Export Trade Statistics |
7.1 Slovakia Interactive Tables Market Export to Major Countries |
7.2 Slovakia Interactive Tables Market Imports from Major Countries |
8 Slovakia Interactive Tables Market Key Performance Indicators |
8.1 Average time spent on interactive tables per user |
8.2 Number of new interactive table installations in key sectors (education, hospitality, retail, etc.) |
8.3 Percentage increase in user engagement and interactivity levels on interactive tables |
8.4 Average return on investment (ROI) for businesses implementing interactive table solutions |
8.5 Level of customer satisfaction and feedback on interactive table experiences |
9 Slovakia Interactive Tables Market - Opportunity Assessment |
9.1 Slovakia Interactive Tables Market Opportunity Assessment, By Technology, 2022 & 2032F |
9.2 Slovakia Interactive Tables Market Opportunity Assessment, By Screen Size, 2022 & 2032F |
9.3 Slovakia Interactive Tables Market Opportunity Assessment, By Application, 2022 & 2032F |
10 Slovakia Interactive Tables Market - Competitive Landscape |
10.1 Slovakia Interactive Tables Market Revenue Share, By Companies, 2025 |
10.2 Slovakia Interactive Tables Market Competitive Benchmarking, By Operating and Technical Parameters |
11 Company Profiles |
12 Recommendations |
13 Disclaimer |
Global Go To Market Strategy - 2030
Export potential enables firms to identify high-growth global markets with greater confidence by combining advanced trade intelligence with a structured quantitative methodology. The framework analyzes emerging demand trends and country-level import patterns while integrating macroeconomic and trade datasets such as GDP and population forecasts, bilateral import–export flows, tariff structures, elasticity differentials between developed and developing economies, geographic distance, and import demand projections. Using weighted trade values from 2020–2024 as the base period to project country-to-country export potential for 2030, these inputs are operationalized through calculated drivers such as gravity model parameters, tariff impact factors, and projected GDP per-capita growth. Through an analysis of hidden potentials, demand hotspots, and market conditions that are most favorable to success, this method enables firms to focus on target countries, maximize returns, and global expansion with data, backed by accuracy.
By factoring in the projected importer demand gap that is currently unmet and could be potential opportunity, it identifies the potential for the Exporter (Country) among 190 countries, against the general trade analysis, which identifies the biggest importer or exporter.
To discover high-growth global markets and optimize your business strategy:
Click Here
Pricing
- Single User License$ 1,995
- Department License$ 2,400
- Site License$ 3,120
- Global License$ 3,795

Leadership Perspectives from Industry Events
Search
Thought Leadership and Analyst Meet


Our Clients
6WResearch In News
- India Air Conditioner Market Set for Strong Rebound in 2026 After Weather-Led Correction and GST-Driven Recovery: 6Wresearch
- ADAS in India: How Automatic Emergency Braking, Blind Spot Detection & Driver Monitoring are Transforming Road Safety
- Doha a strategic location for EV manufacturing hub: IPA Qatar
- Demand for luxury TVs surging in the GCC, says Samsung
- Empowering Growth: The Thriving Journey of Bangladesh’s Cable Industry
- Demand for luxury TVs surging in the GCC, says Samsung
Latest Reports
- Nicaragua RPG Gaming Market (2026-2032)
- New Zealand RPG Gaming Market (2026-2032)
- Netherlands RPG Gaming Market (2026-2032)
- Nauru RPG Gaming Market (2026-2032)
- Namibia RPG Gaming Market (2026-2032)
- Mozambique RPG Gaming Market (2026-2032)
- Montenegro RPG Gaming Market (2026-2032)
- Mongolia RPG Gaming Market (2026-2032)
- Monaco RPG Gaming Market (2026-2032)
- Micronesia RPG Gaming Market (2026-2032)
Industry Events and Analyst Meet

EV India Expo 2026

HIMTEX 2026

India Refining Summit 2026

India EV Show 2026

EV tech India Expo 2026
Whitepaper
- Middle East & Africa Commercial Security Market Click here to view more.
- Middle East & Africa Fire Safety Systems & Equipment Market Click here to view more.
- GCC Drone Market Click here to view more.
- Middle East Lighting Fixture Market Click here to view more.
- GCC Physical & Perimeter Security Market Click here to view more.