Slovenia Aliphatic Hydrocarbon Market (2026-2032) | Forecast, Segmentation, Consumer Insights, Industry, Analysis, Restraints, Supply, Demand, Pricing Analysis, Competition, Competitive, Strategy, Strategic Insights, Outlook, Value, Size, Growth, Challenges, Companies, Share, Trends, Drivers, Investment Trends, Revenue, Opportunities, Segments
Market Forecast By Type (Alkanes, Alkenes, Alkynes, Others), By Application (Adhesives & Sealants, Fuel & Energy, Pharmaceuticals, Others), By End User (Chemicals, Automotive, Pharmaceuticals, Others) And Competitive Landscape
| Product Code: ETC12071844 | Publication Date: Apr 2025 | Updated Date: Apr 2026 | Product Type: Market Research Report | |
| Publisher: 6Wresearch | Author: Sachin Kumar Rai | No. of Pages: 65 | No. of Figures: 34 | No. of Tables: 19 |
Slovenia Aliphatic Hydrocarbon Market Size (2020-2030)
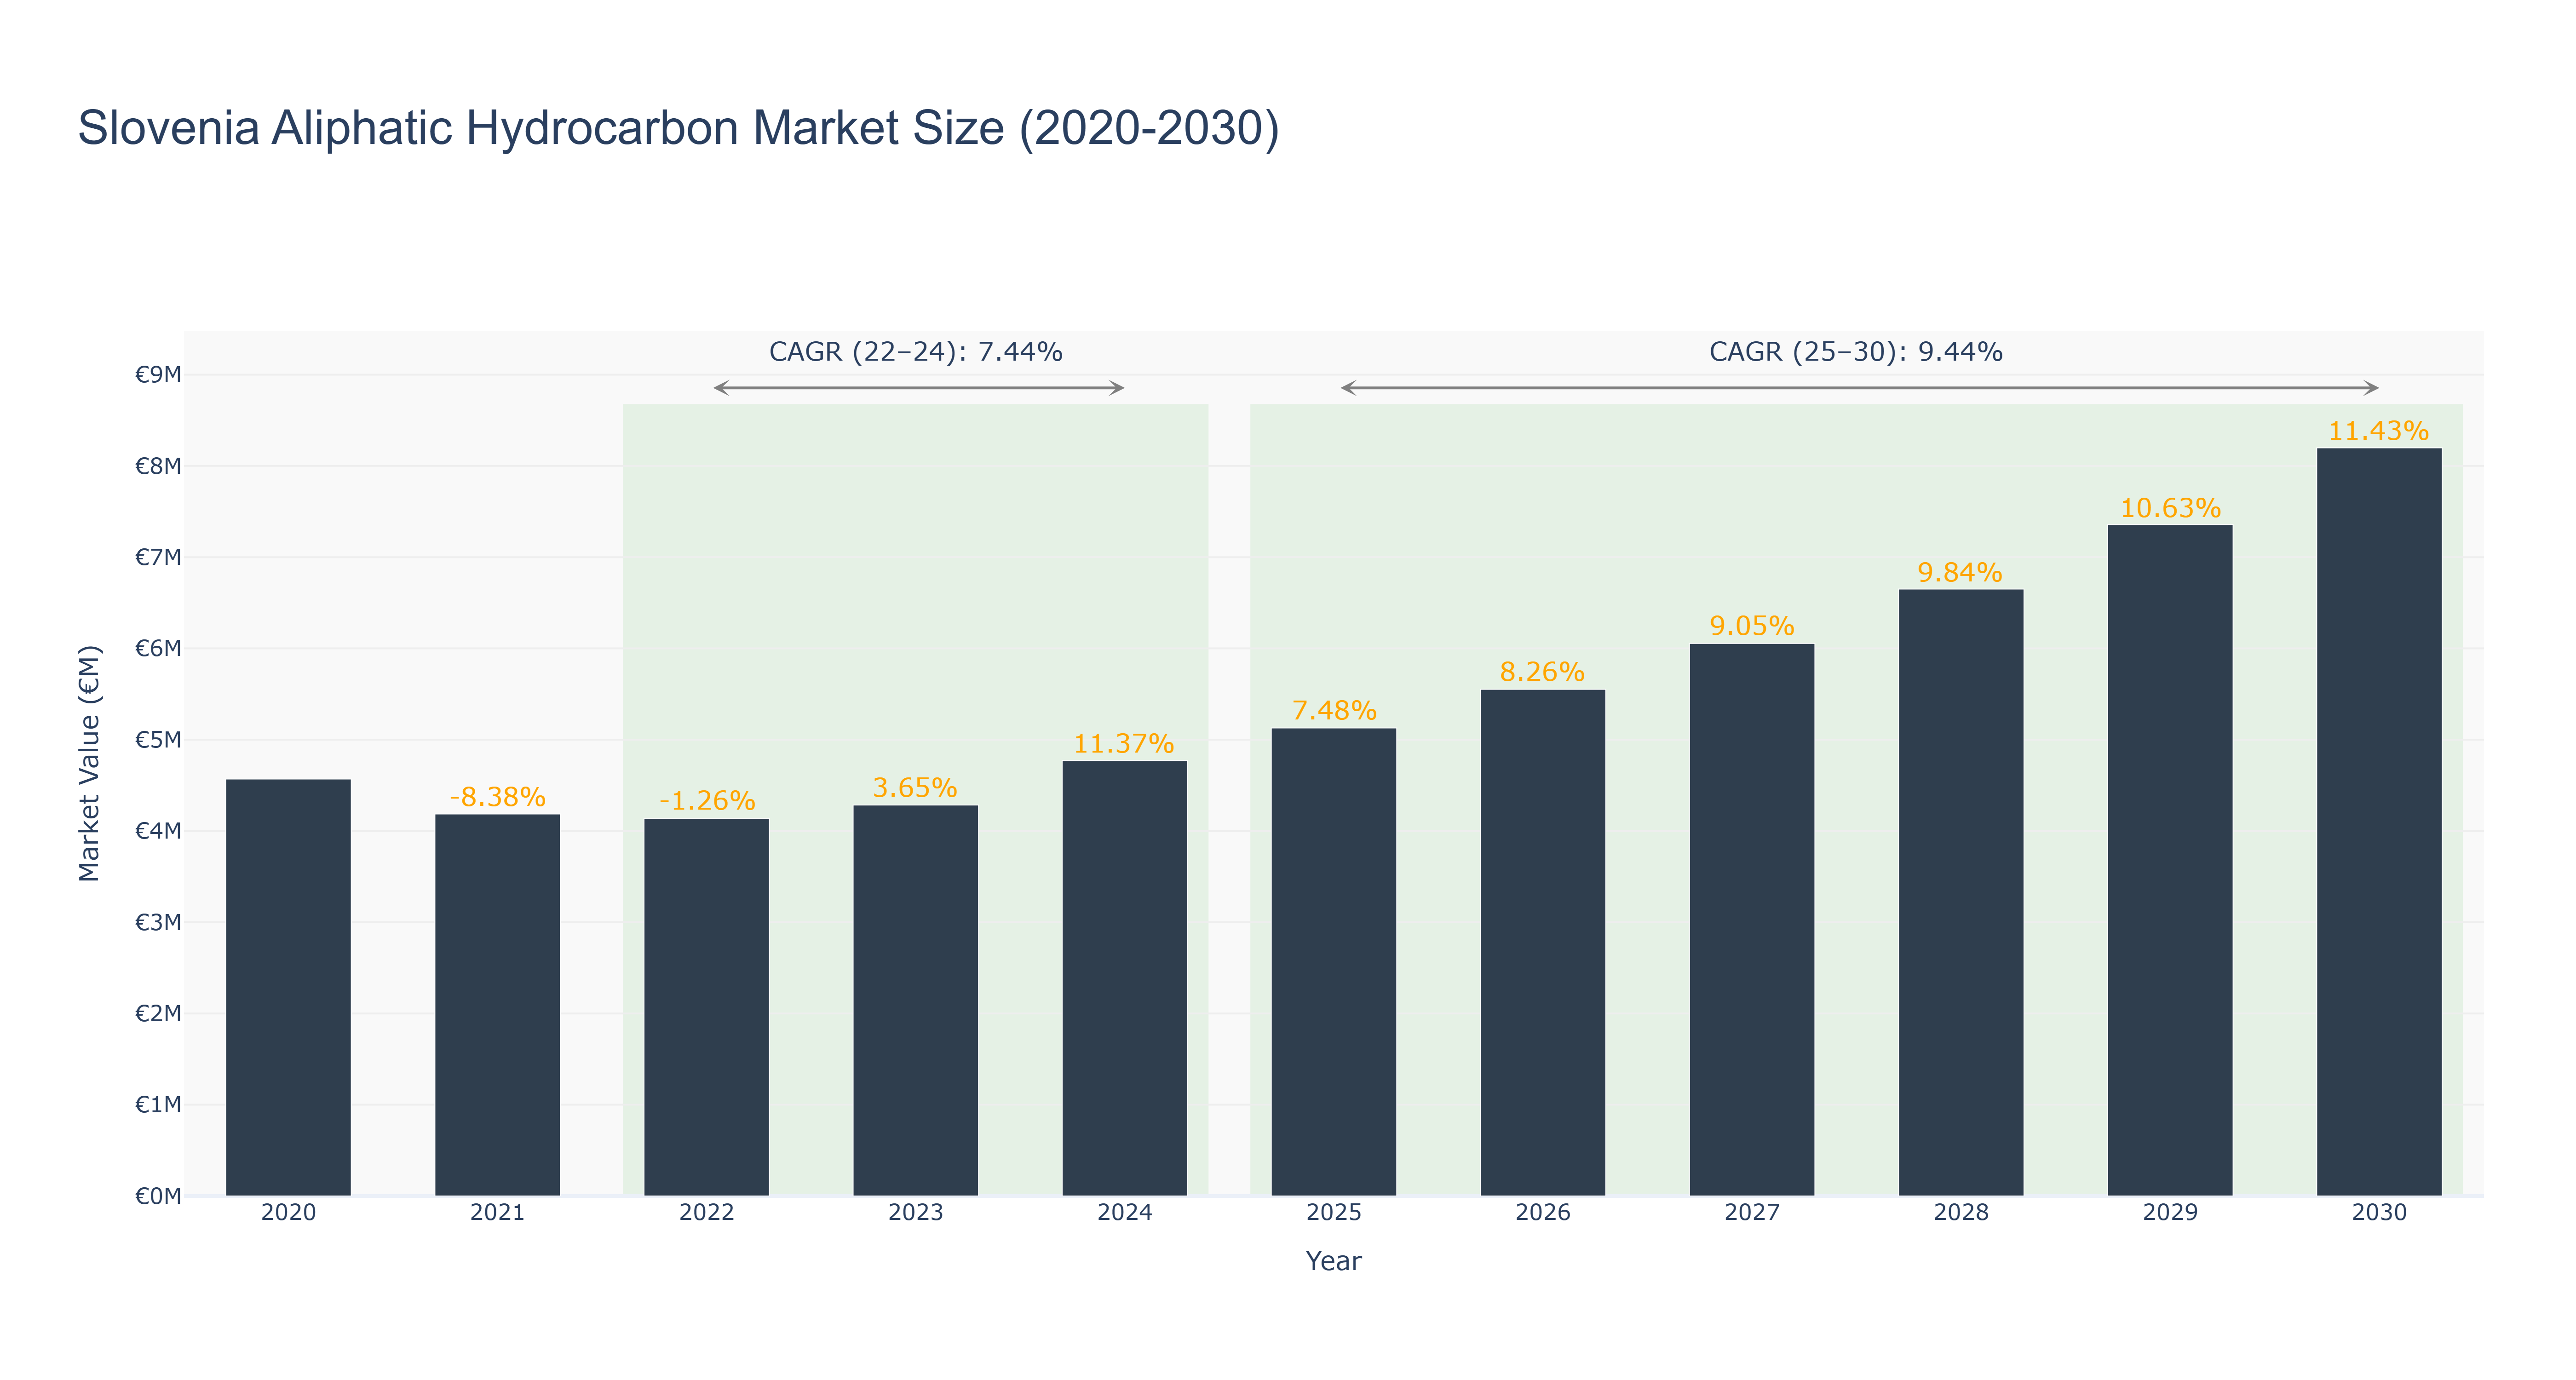
Slovenia's Aliphatic Hydrocarbon Market has shown a promising growth trajectory over the years. The market size peaked at €8.20 million in 2030, with a steady increase from €4.57 million in 2020. The actual market size saw fluctuations, with a notable dip in 2021 and a significant surge in 2024. The forecasted market size is expected to continue growing steadily from 2025 to 2030, with a Compound Annual Growth Rate (CAGR) of 9.44% post-2025. The market's growth can be attributed to factors such as increasing industrial activities, rising demand for aliphatic hydrocarbons in various sectors, and favorable government policies promoting sustainable practices. Looking ahead, Slovenia is set to invest in renewable energy projects to further boost the market, aligning with the country's commitment to environmental sustainability and energy efficiency.
Slovenia Aliphatic Hydrocarbon Market: Production & Trade Performance (2019-2025)
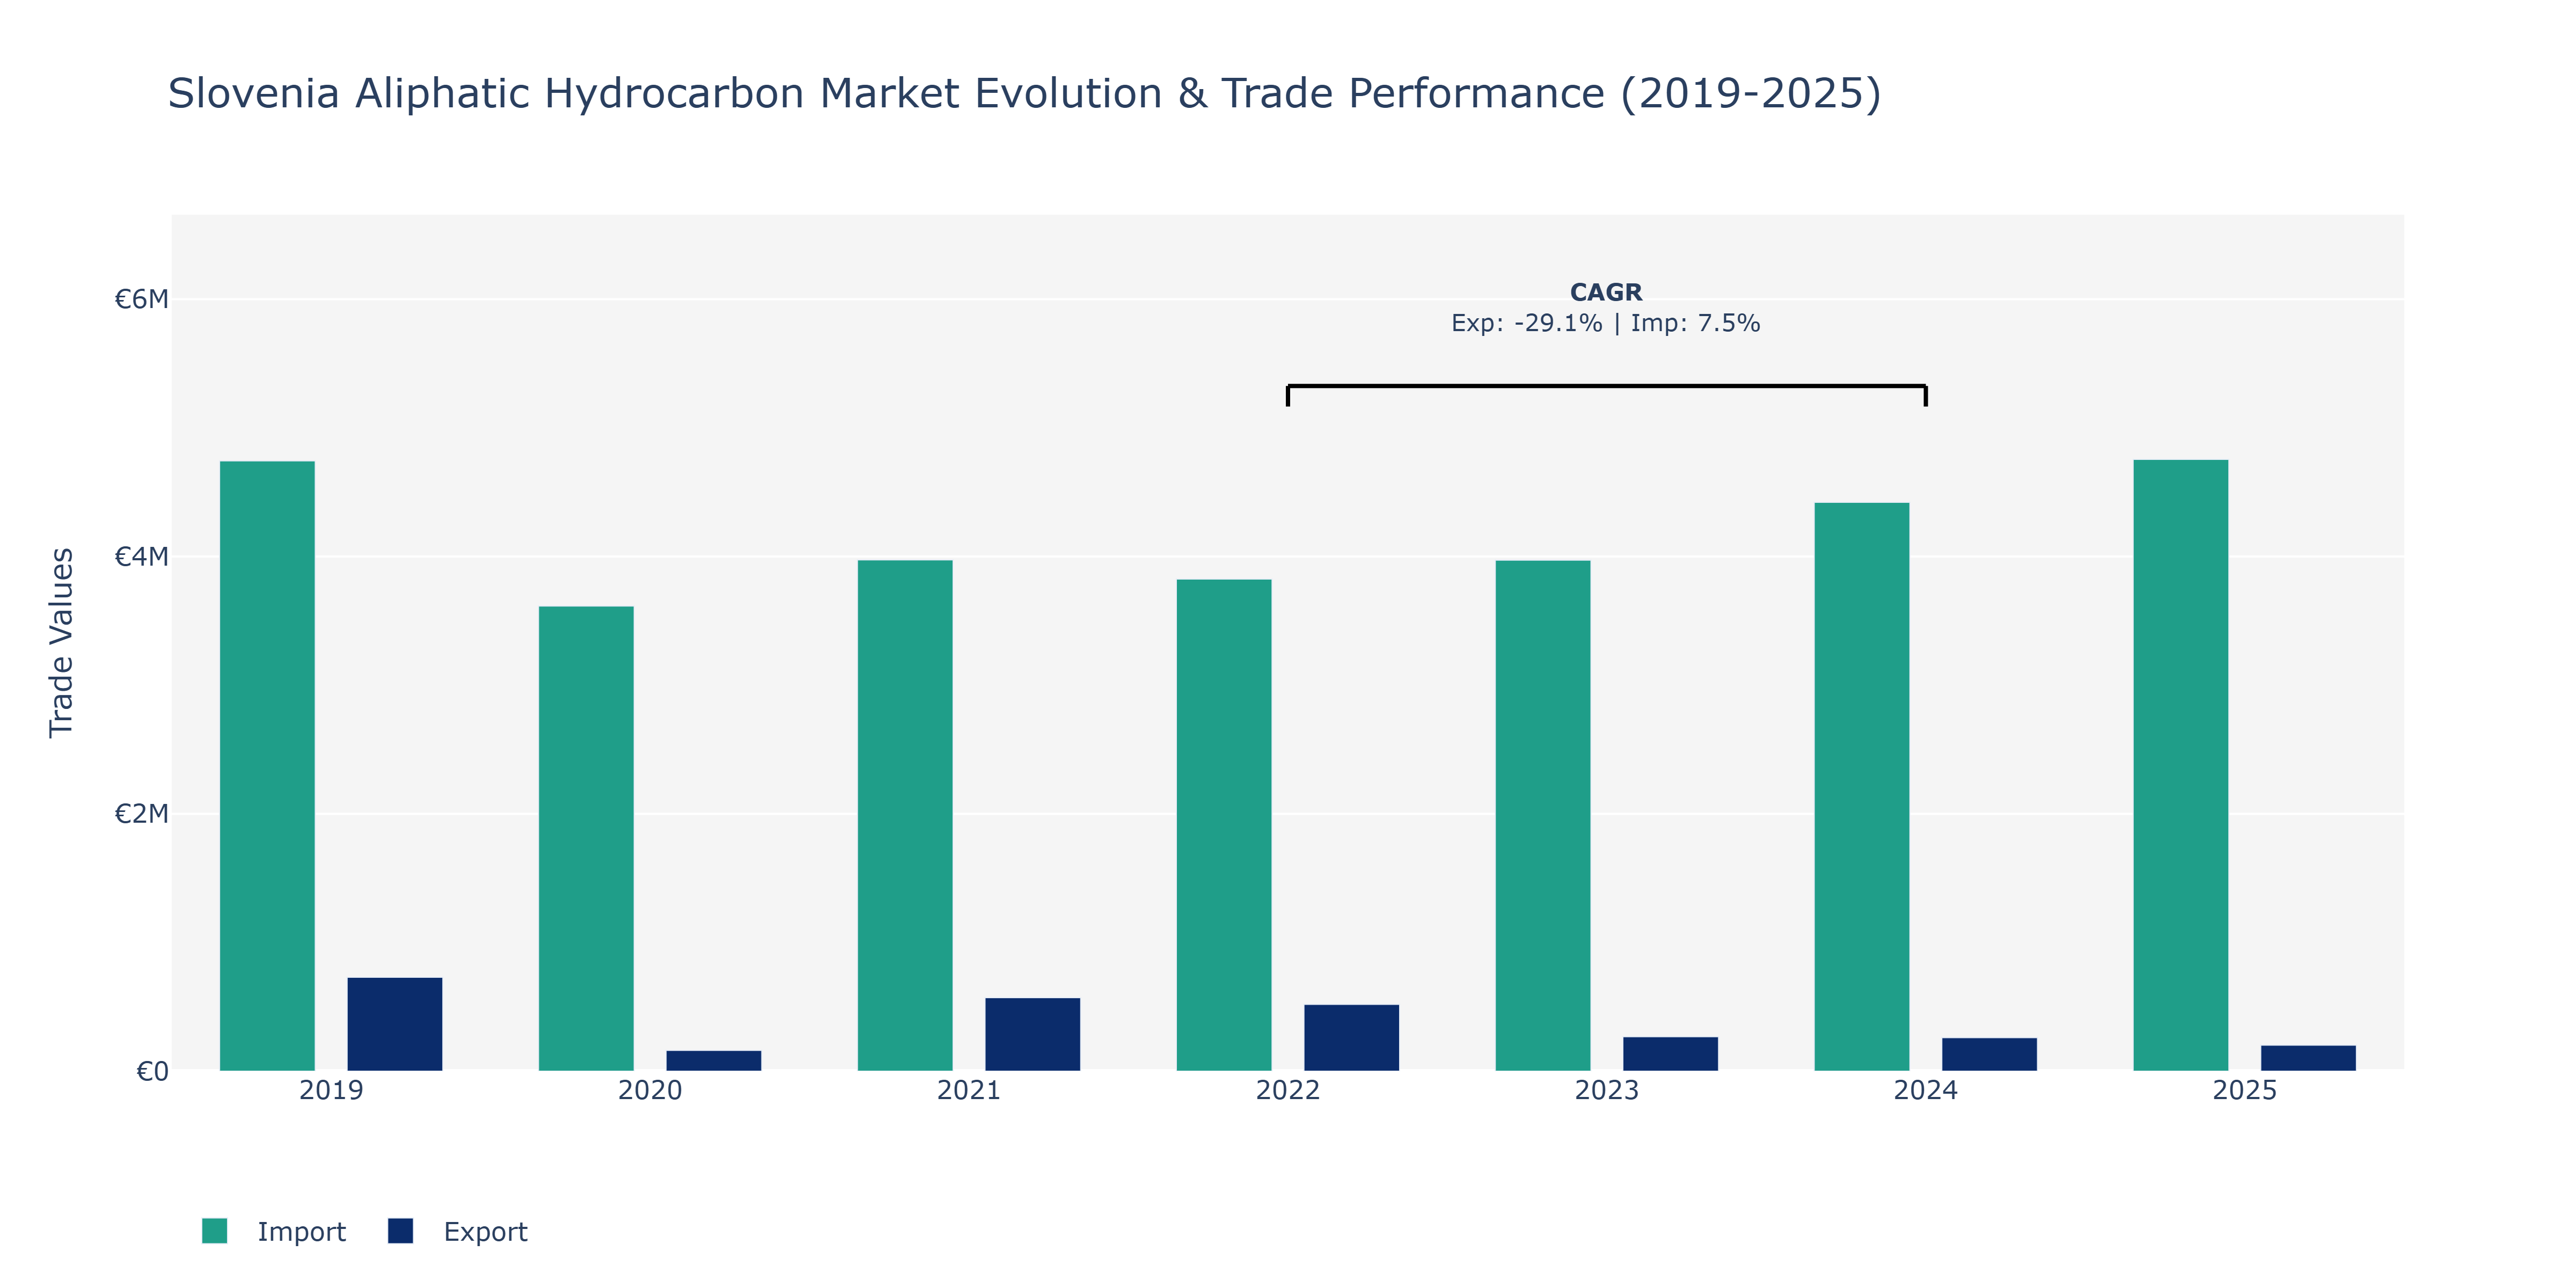
Between 2019 and 2025, Slovenia's Aliphatic Hydrocarbon Market saw noteworthy shifts in both exports and imports. Exports demonstrated a fluctuating pattern, peaking at €729.33 thousand in 2019 before experiencing a sharp decline to €161.89 thousand in 2020, followed by a gradual recovery in the subsequent years. On the other hand, imports showcased a more stable trend, with a peak of €4.42 million in 2024. The decline in exports in 2020 could be attributed to global economic uncertainties impacting demand, while the consistent growth in imports reflects Slovenia's reliance on external sources for aliphatic hydrocarbons, potentially due to domestic production constraints or specific quality requirements. The market may have witnessed increased competition, technological advancements in production, or shifting consumer preferences, influencing trade dynamics. To maintain competitiveness, market players might need to focus on product diversification, cost efficiencies, and sustainability measures.
Key Highlights of the Report:
- Slovenia Aliphatic Hydrocarbon Market Outlook
- Market Size of Slovenia Aliphatic Hydrocarbon Market, 2025
- Forecast of Slovenia Aliphatic Hydrocarbon Market, 2032
- Historical Data and Forecast of Slovenia Aliphatic Hydrocarbon Revenues & Volume for the Period 2022-2032F
- Slovenia Aliphatic Hydrocarbon Market Trend Evolution
- Slovenia Aliphatic Hydrocarbon Market Drivers and Challenges
- Slovenia Aliphatic Hydrocarbon Price Trends
- Slovenia Aliphatic Hydrocarbon Porter's Five Forces
- Slovenia Aliphatic Hydrocarbon Industry Life Cycle
- Historical Data and Forecast of Slovenia Aliphatic Hydrocarbon Market Revenues & Volume By Type for the Period 2022-2032F
- Historical Data and Forecast of Slovenia Aliphatic Hydrocarbon Market Revenues & Volume By Alkanes for the Period 2022-2032F
- Historical Data and Forecast of Slovenia Aliphatic Hydrocarbon Market Revenues & Volume By Alkenes for the Period 2022-2032F
- Historical Data and Forecast of Slovenia Aliphatic Hydrocarbon Market Revenues & Volume By Alkynes for the Period 2022-2032F
- Historical Data and Forecast of Slovenia Aliphatic Hydrocarbon Market Revenues & Volume By Others for the Period 2022-2032F
- Historical Data and Forecast of Slovenia Aliphatic Hydrocarbon Market Revenues & Volume By Application for the Period 2022-2032F
- Historical Data and Forecast of Slovenia Aliphatic Hydrocarbon Market Revenues & Volume By Adhesives & Sealants for the Period 2022-2032F
- Historical Data and Forecast of Slovenia Aliphatic Hydrocarbon Market Revenues & Volume By Fuel & Energy for the Period 2022-2032F
- Historical Data and Forecast of Slovenia Aliphatic Hydrocarbon Market Revenues & Volume By Pharmaceuticals for the Period 2022-2032F
- Historical Data and Forecast of Slovenia Aliphatic Hydrocarbon Market Revenues & Volume By Others for the Period 2022-2032F
- Historical Data and Forecast of Slovenia Aliphatic Hydrocarbon Market Revenues & Volume By End User for the Period 2022-2032F
- Historical Data and Forecast of Slovenia Aliphatic Hydrocarbon Market Revenues & Volume By Chemicals for the Period 2022-2032F
- Historical Data and Forecast of Slovenia Aliphatic Hydrocarbon Market Revenues & Volume By Automotive for the Period 2022-2032F
- Historical Data and Forecast of Slovenia Aliphatic Hydrocarbon Market Revenues & Volume By Pharmaceuticals for the Period 2022-2032F
- Historical Data and Forecast of Slovenia Aliphatic Hydrocarbon Market Revenues & Volume By Others for the Period 2022-2032F
- Slovenia Aliphatic Hydrocarbon Import Export Trade Statistics
- Market Opportunity Assessment By Type
- Market Opportunity Assessment By Application
- Market Opportunity Assessment By End User
- Slovenia Aliphatic Hydrocarbon Top Companies Market Share
- Slovenia Aliphatic Hydrocarbon Competitive Benchmarking By Technical and Operational Parameters
- Slovenia Aliphatic Hydrocarbon Company Profiles
- Slovenia Aliphatic Hydrocarbon Key Strategic Recommendations
Frequently Asked Questions About the Market Study (FAQs):
6Wresearch actively monitors the Slovenia Aliphatic Hydrocarbon Market and publishes its comprehensive annual report, highlighting emerging trends, growth drivers, revenue analysis, and forecast outlook. Our insights help businesses to make data-backed strategic decisions with ongoing market dynamics. Our analysts track relevent industries related to the Slovenia Aliphatic Hydrocarbon Market, allowing our clients with actionable intelligence and reliable forecasts tailored to emerging regional needs.
Yes, we provide customisation as per your requirements. To learn more, feel free to contact us on sales@6wresearch.com
1 Executive Summary |
2 Introduction |
2.1 Key Highlights of the Report |
2.2 Report Description |
2.3 Market Scope & Segmentation |
2.4 Research Methodology |
2.5 Assumptions |
3 Slovenia Aliphatic Hydrocarbon Market Overview |
3.1 Slovenia Country Macro Economic Indicators |
3.2 Slovenia Aliphatic Hydrocarbon Market Revenues & Volume, 2022 & 2032F |
3.3 Slovenia Aliphatic Hydrocarbon Market - Industry Life Cycle |
3.4 Slovenia Aliphatic Hydrocarbon Market - Porter's Five Forces |
3.5 Slovenia Aliphatic Hydrocarbon Market Revenues & Volume Share, By Type, 2022 & 2032F |
3.6 Slovenia Aliphatic Hydrocarbon Market Revenues & Volume Share, By Application, 2022 & 2032F |
3.7 Slovenia Aliphatic Hydrocarbon Market Revenues & Volume Share, By End User, 2022 & 2032F |
4 Slovenia Aliphatic Hydrocarbon Market Dynamics |
4.1 Impact Analysis |
4.2 Market Drivers |
4.3 Market Restraints |
5 Slovenia Aliphatic Hydrocarbon Market Trends |
6 Slovenia Aliphatic Hydrocarbon Market, By Types |
6.1 Slovenia Aliphatic Hydrocarbon Market, By Type |
6.1.1 Overview and Analysis |
6.1.2 Slovenia Aliphatic Hydrocarbon Market Revenues & Volume, By Type, 2022 - 2032F |
6.1.3 Slovenia Aliphatic Hydrocarbon Market Revenues & Volume, By Alkanes, 2022 - 2032F |
6.1.4 Slovenia Aliphatic Hydrocarbon Market Revenues & Volume, By Alkenes, 2022 - 2032F |
6.1.5 Slovenia Aliphatic Hydrocarbon Market Revenues & Volume, By Alkynes, 2022 - 2032F |
6.1.6 Slovenia Aliphatic Hydrocarbon Market Revenues & Volume, By Others, 2022 - 2032F |
6.2 Slovenia Aliphatic Hydrocarbon Market, By Application |
6.2.1 Overview and Analysis |
6.2.2 Slovenia Aliphatic Hydrocarbon Market Revenues & Volume, By Adhesives & Sealants, 2022 - 2032F |
6.2.3 Slovenia Aliphatic Hydrocarbon Market Revenues & Volume, By Fuel & Energy, 2022 - 2032F |
6.2.4 Slovenia Aliphatic Hydrocarbon Market Revenues & Volume, By Pharmaceuticals, 2022 - 2032F |
6.2.5 Slovenia Aliphatic Hydrocarbon Market Revenues & Volume, By Others, 2022 - 2032F |
6.3 Slovenia Aliphatic Hydrocarbon Market, By End User |
6.3.1 Overview and Analysis |
6.3.2 Slovenia Aliphatic Hydrocarbon Market Revenues & Volume, By Chemicals, 2022 - 2032F |
6.3.3 Slovenia Aliphatic Hydrocarbon Market Revenues & Volume, By Automotive, 2022 - 2032F |
6.3.4 Slovenia Aliphatic Hydrocarbon Market Revenues & Volume, By Pharmaceuticals, 2022 - 2032F |
6.3.5 Slovenia Aliphatic Hydrocarbon Market Revenues & Volume, By Others, 2022 - 2032F |
7 Slovenia Aliphatic Hydrocarbon Market Import-Export Trade Statistics |
7.1 Slovenia Aliphatic Hydrocarbon Market Export to Major Countries |
7.2 Slovenia Aliphatic Hydrocarbon Market Imports from Major Countries |
8 Slovenia Aliphatic Hydrocarbon Market Key Performance Indicators |
9 Slovenia Aliphatic Hydrocarbon Market - Opportunity Assessment |
9.1 Slovenia Aliphatic Hydrocarbon Market Opportunity Assessment, By Type, 2022 & 2032F |
9.2 Slovenia Aliphatic Hydrocarbon Market Opportunity Assessment, By Application, 2022 & 2032F |
9.3 Slovenia Aliphatic Hydrocarbon Market Opportunity Assessment, By End User, 2022 & 2032F |
10 Slovenia Aliphatic Hydrocarbon Market - Competitive Landscape |
10.1 Slovenia Aliphatic Hydrocarbon Market Revenue Share, By Companies, 2025 |
10.2 Slovenia Aliphatic Hydrocarbon Market Competitive Benchmarking, By Operating and Technical Parameters |
11 Company Profiles |
12 Recommendations |
13 Disclaimer |
Global Go To Market Strategy - 2030
Export potential enables firms to identify high-growth global markets with greater confidence by combining advanced trade intelligence with a structured quantitative methodology. The framework analyzes emerging demand trends and country-level import patterns while integrating macroeconomic and trade datasets such as GDP and population forecasts, bilateral import–export flows, tariff structures, elasticity differentials between developed and developing economies, geographic distance, and import demand projections. Using weighted trade values from 2020–2024 as the base period to project country-to-country export potential for 2030, these inputs are operationalized through calculated drivers such as gravity model parameters, tariff impact factors, and projected GDP per-capita growth. Through an analysis of hidden potentials, demand hotspots, and market conditions that are most favorable to success, this method enables firms to focus on target countries, maximize returns, and global expansion with data, backed by accuracy.
By factoring in the projected importer demand gap that is currently unmet and could be potential opportunity, it identifies the potential for the Exporter (Country) among 190 countries, against the general trade analysis, which identifies the biggest importer or exporter.
To discover high-growth global markets and optimize your business strategy:
Click Here
Pricing
- Single User License$ 1,995
- Department License$ 2,400
- Site License$ 3,120
- Global License$ 3,795

Leadership Perspectives from Industry Events
Search
Thought Leadership and Analyst Meet


Our Clients
6WResearch In News
- Doha a strategic location for EV manufacturing hub: IPA Qatar
- Demand for luxury TVs surging in the GCC, says Samsung
- Empowering Growth: The Thriving Journey of Bangladesh’s Cable Industry
- Demand for luxury TVs surging in the GCC, says Samsung
- Video call with a traditional healer? Once unthinkable, it’s now common in South Africa
- Intelligent Buildings To Smooth GCC’s Path To Net Zero
Latest Reports
- Taiwan Airport Wireless Infrastructure Market (2026-2032)
- Vietnam Airport Wireless Infrastructure Market (2026-2032)
- Thailand Airport Wireless Infrastructure Market (2026-2032)
- South Korea Airport Wireless Infrastructure Market (2026-2032)
- Romania Airport Wireless Infrastructure Market (2026-2032)
- Qatar Airport Wireless Infrastructure Market (2026-2032)
- Philippines Airport Wireless Infrastructure Market (2026-2032)
- Japan Airport Wireless Infrastructure Market (2026-2032)
- Taiwan Airport Winter Services Market (2026-2032)
- Vietnam Airport Winter Services Market (2026-2032)
Industry Events and Analyst Meet

HIMTEX 2026

India Refining Summit 2026

India EV Show 2026

EV tech India Expo 2026

Auto Tech Asia 2026
Whitepaper
- Middle East & Africa Commercial Security Market Click here to view more.
- Middle East & Africa Fire Safety Systems & Equipment Market Click here to view more.
- GCC Drone Market Click here to view more.
- Middle East Lighting Fixture Market Click here to view more.
- GCC Physical & Perimeter Security Market Click here to view more.