Slovenia Basmati Rice Market (2026-2032) | Segmentation, Value, Share, Outlook, Analysis, Competitive Landscape, Forecast, Growth, Trends, Companies, Industry, Size & Revenue
Market Forecast By Type (Raw, Steamed, Parboiled), By Species (White, Brown), By Application (Food and Cosmetic, Personal Care), By Sales Channel (HORECA, Modern Trade, Convenience Store, Online Store, Traditional Grocery Stores) And Competitive Landscape
| Product Code: ETC9311824 | Publication Date: Sep 2024 | Updated Date: Apr 2026 | Product Type: Market Research Report | |
| Publisher: 6Wresearch | Author: Summon Dutta | No. of Pages: 75 | No. of Figures: 35 | No. of Tables: 20 |
Slovenia Basmati Rice Market Size (2020-2030)
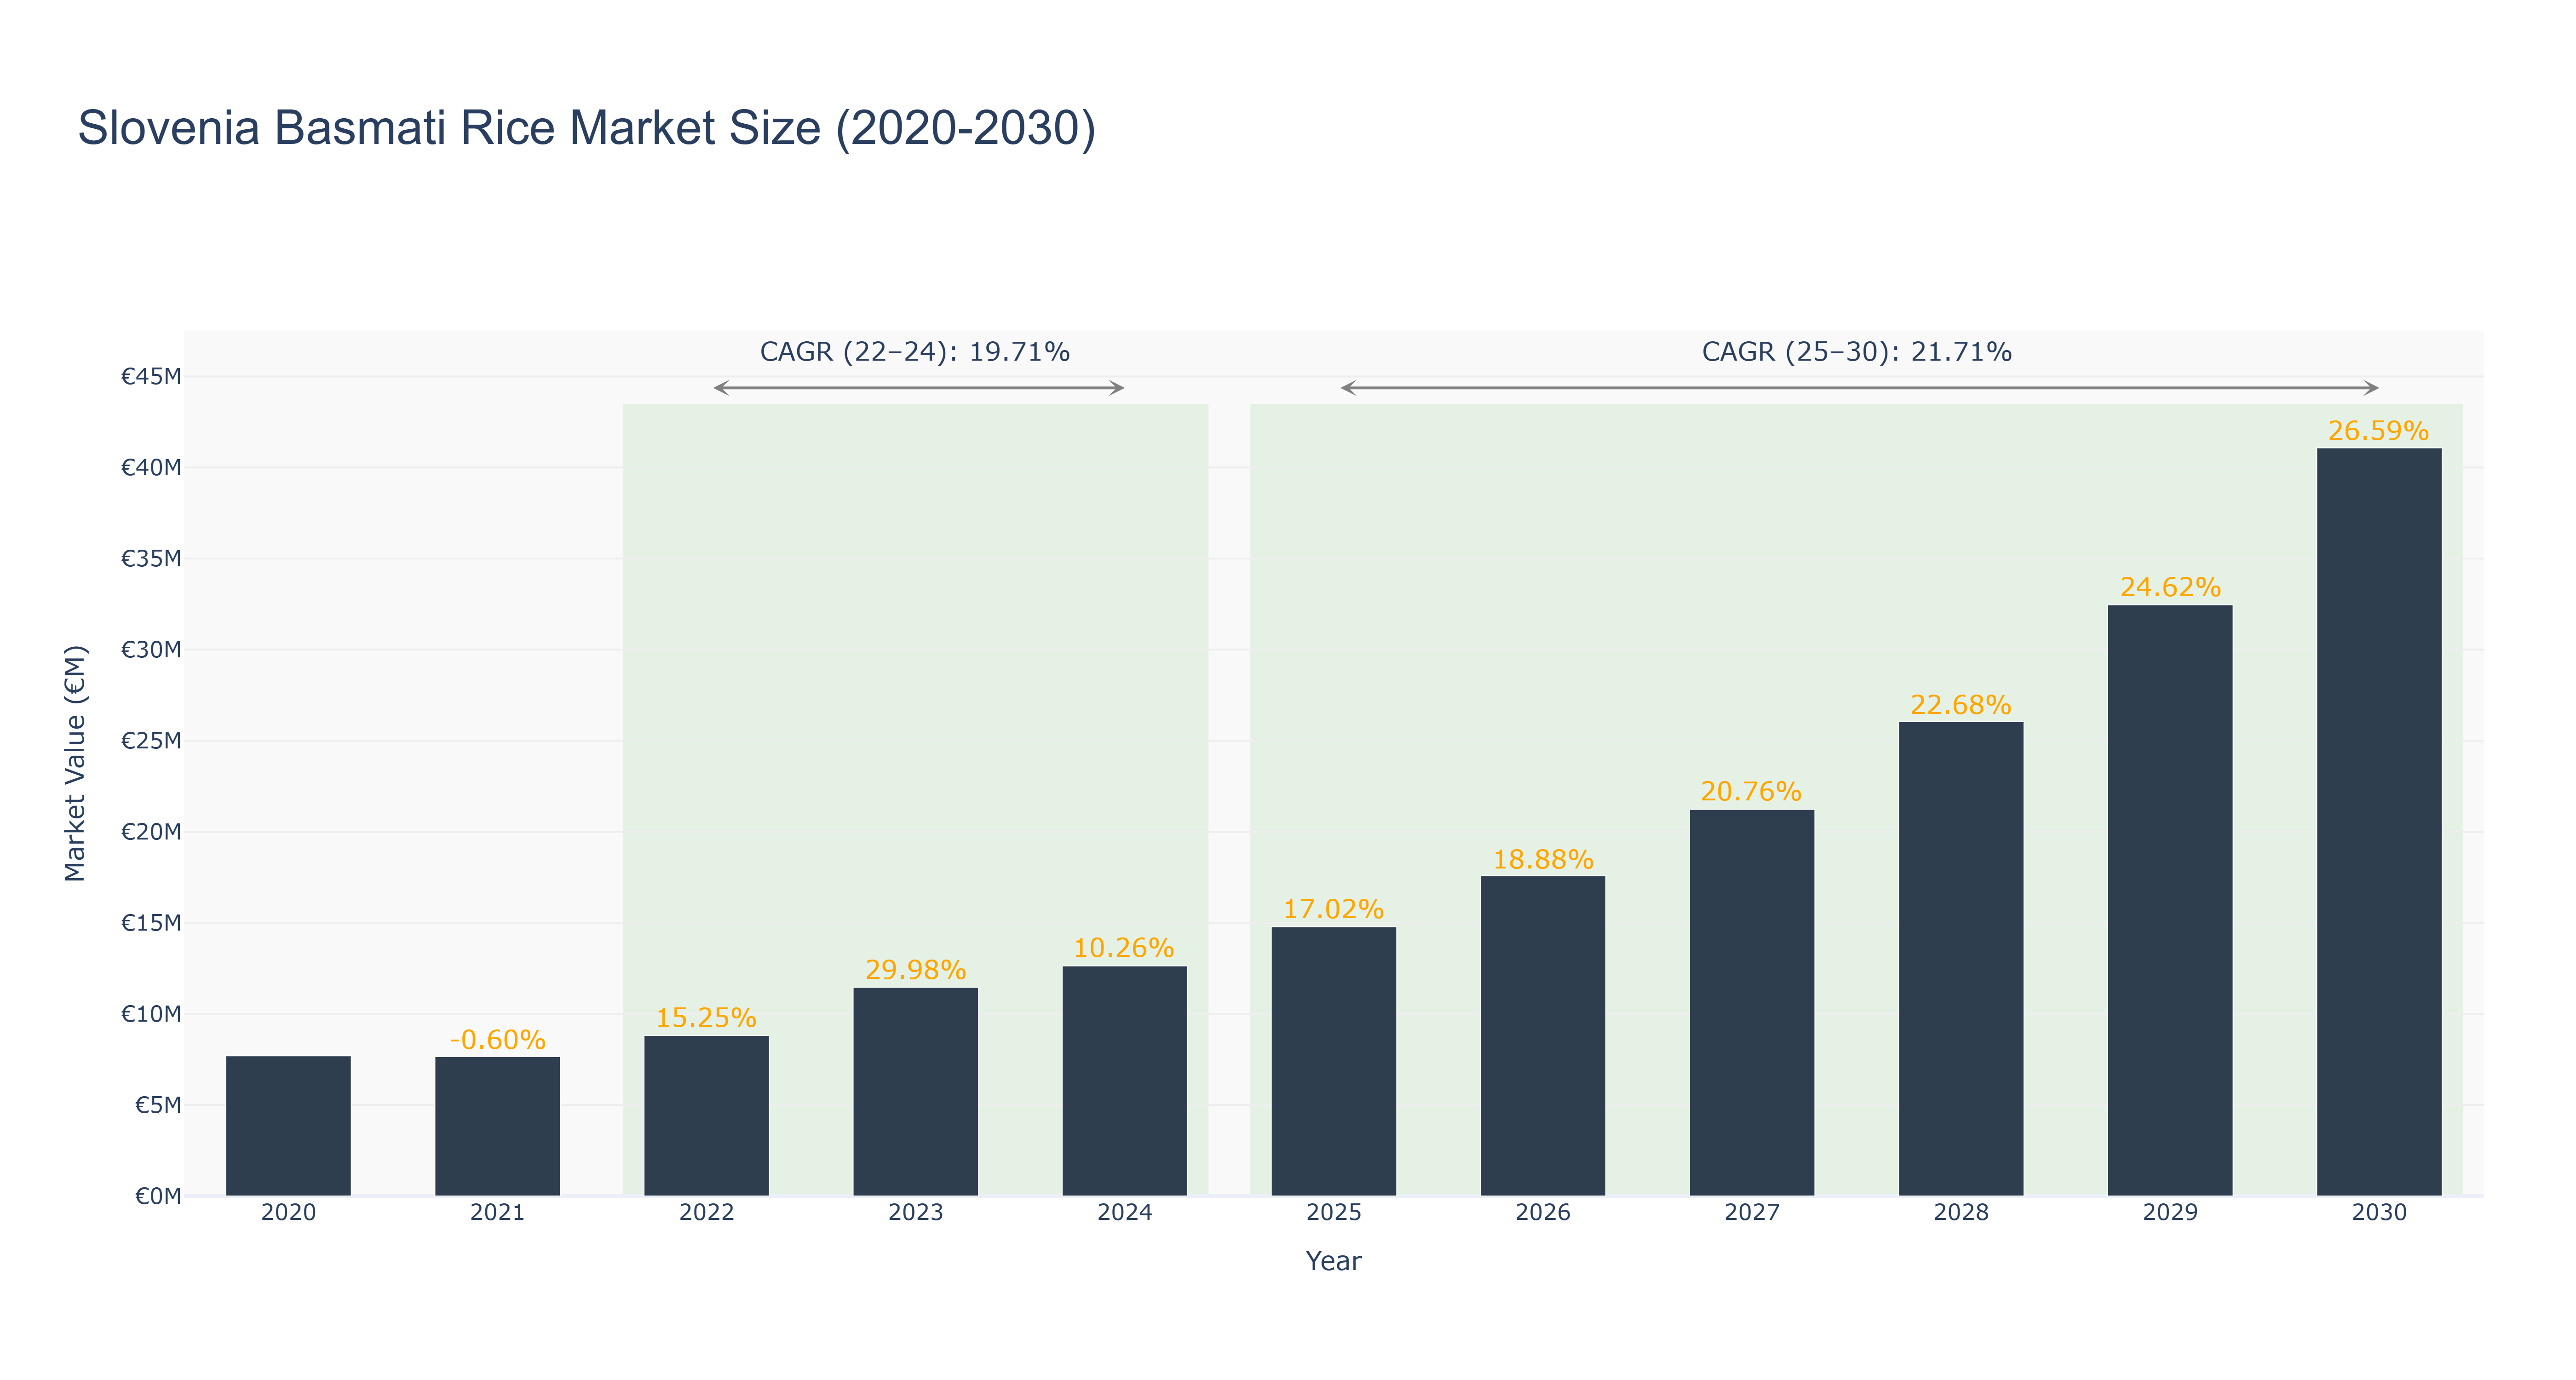
The Slovenia Basmati Rice Market experienced fluctuations from 2020 to 2024, peaking in 2023 with a market size of €11.46 million, reflecting significant growth of 29.98% from the previous year. The actual market sizes in 2021 and 2022 were €7.65 million and €8.82 million, respectively, with a notable recovery in 2022 driven by increasing consumer demand for premium rice varieties. The market is projected to continue its robust growth, with forecasted sizes reaching €14.79 million in 2025 and €41.08 million by 2030, corresponding to a compound annual growth rate (CAGR) of 21.71% for the 2025-2030 period. This growth is expected to be fueled by rising health consciousness among consumers and an expanding culinary interest in ethnic cuisines. Additionally, ongoing investments in agricultural technology and supply chain improvements are likely to enhance market dynamics in the coming years.
Slovenia Basmati Rice Market: Production & Trade Performance (2019-2025)
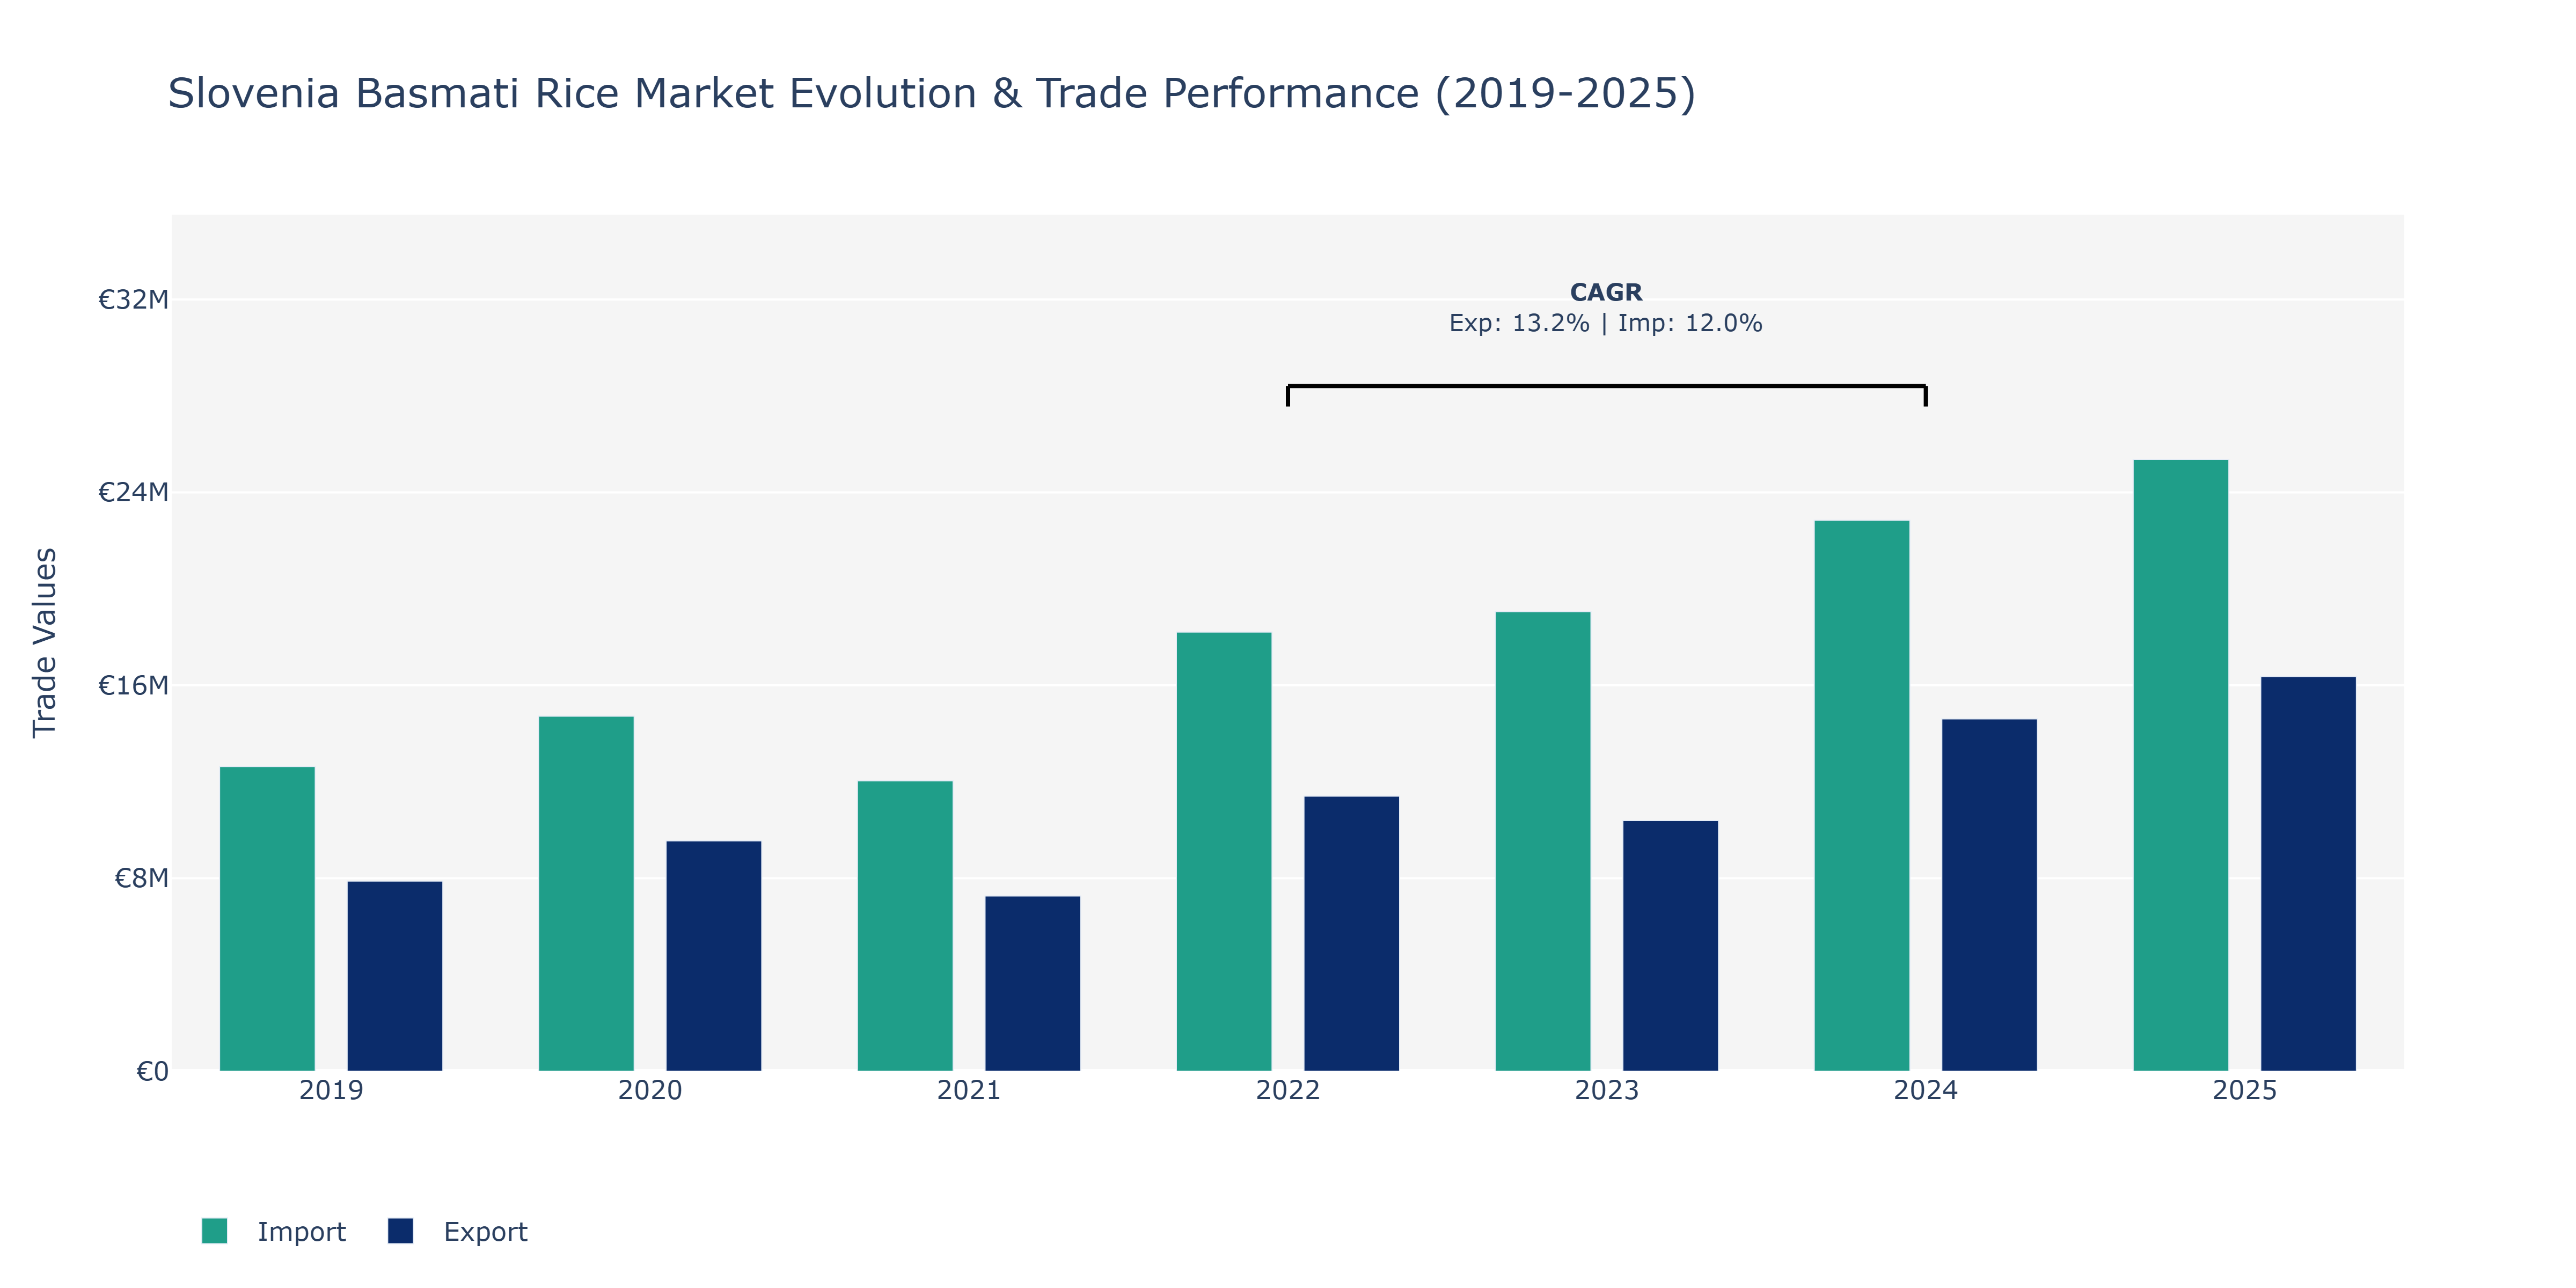
In the Slovenia Basmati Rice Market, exports and imports have displayed notable fluctuations between 2019 and 2025. Exports saw a steady increase from €7.88 million in 2019 to €16.36 million in 2025, with a remarkable peak in 2025. Conversely, imports followed a similar pattern, rising from €12.63 million in 2019 to €25.37 million in 2025. The peak points in 2025 reflect a growing demand for Basmati rice in Slovenia, possibly driven by shifting consumer preferences towards healthier and exotic food options. The upward trend in both exports and imports can be attributed to expanding trade partnerships, increased awareness of the product's quality and uniqueness, and the rise in disposable income among Slovenian consumers. The consistent growth in trade volumes underscores the market's resilience and attractiveness for rice producers and traders looking to capitalize on Slovenia's evolving culinary landscape.
Key Highlights of the Report:
- Slovenia Basmati Rice Market Outlook
- Market Size of Slovenia Basmati Rice Market, 2025
- Forecast of Slovenia Basmati Rice Market, 2032
- Historical Data and Forecast of Slovenia Basmati Rice Revenues & Volume for the Period 2022-2032F
- Slovenia Basmati Rice Market Trend Evolution
- Slovenia Basmati Rice Market Drivers and Challenges
- Slovenia Basmati Rice Price Trends
- Slovenia Basmati Rice Porter's Five Forces
- Slovenia Basmati Rice Industry Life Cycle
- Historical Data and Forecast of Slovenia Basmati Rice Market Revenues & Volume By Type for the Period 2022-2032F
- Historical Data and Forecast of Slovenia Basmati Rice Market Revenues & Volume By Raw for the Period 2022-2032F
- Historical Data and Forecast of Slovenia Basmati Rice Market Revenues & Volume By Steamed for the Period 2022-2032F
- Historical Data and Forecast of Slovenia Basmati Rice Market Revenues & Volume By Parboiled for the Period 2022-2032F
- Historical Data and Forecast of Slovenia Basmati Rice Market Revenues & Volume By Species for the Period 2022-2032F
- Historical Data and Forecast of Slovenia Basmati Rice Market Revenues & Volume By White for the Period 2022-2032F
- Historical Data and Forecast of Slovenia Basmati Rice Market Revenues & Volume By Brown for the Period 2022-2032F
- Historical Data and Forecast of Slovenia Basmati Rice Market Revenues & Volume By Application for the Period 2022-2032F
- Historical Data and Forecast of Slovenia Basmati Rice Market Revenues & Volume By Food and Cosmetic for the Period 2022-2032F
- Historical Data and Forecast of Slovenia Basmati Rice Market Revenues & Volume By Personal Care for the Period 2022-2032F
- Historical Data and Forecast of Slovenia Basmati Rice Market Revenues & Volume By Sales Channel for the Period 2022-2032F
- Historical Data and Forecast of Slovenia Basmati Rice Market Revenues & Volume By HORECA for the Period 2022-2032F
- Historical Data and Forecast of Slovenia Basmati Rice Market Revenues & Volume By Modern Trade for the Period 2022-2032F
- Historical Data and Forecast of Slovenia Basmati Rice Market Revenues & Volume By Convenience Store for the Period 2022-2032F
- Historical Data and Forecast of Slovenia Basmati Rice Market Revenues & Volume By Online Store for the Period 2022-2032F
- Historical Data and Forecast of Slovenia Basmati Rice Market Revenues & Volume By Traditional Grocery Stores for the Period 2022-2032F
- Slovenia Basmati Rice Import Export Trade Statistics
- Market Opportunity Assessment By Type
- Market Opportunity Assessment By Species
- Market Opportunity Assessment By Application
- Market Opportunity Assessment By Sales Channel
- Slovenia Basmati Rice Top Companies Market Share
- Slovenia Basmati Rice Competitive Benchmarking By Technical and Operational Parameters
- Slovenia Basmati Rice Company Profiles
- Slovenia Basmati Rice Key Strategic Recommendations
Frequently Asked Questions About the Market Study (FAQs):
6Wresearch actively monitors the Slovenia Basmati Rice Market and publishes its comprehensive annual report, highlighting emerging trends, growth drivers, revenue analysis, and forecast outlook. Our insights help businesses to make data-backed strategic decisions with ongoing market dynamics. Our analysts track relevent industries related to the Slovenia Basmati Rice Market, allowing our clients with actionable intelligence and reliable forecasts tailored to emerging regional needs.
Yes, we provide customisation as per your requirements. To learn more, feel free to contact us on sales@6wresearch.com
1 Executive Summary |
2 Introduction |
2.1 Key Highlights of the Report |
2.2 Report Description |
2.3 Market Scope & Segmentation |
2.4 Research Methodology |
2.5 Assumptions |
3 Slovenia Basmati Rice Market Overview |
3.1 Slovenia Country Macro Economic Indicators |
3.2 Slovenia Basmati Rice Market Revenues & Volume, 2022 & 2032F |
3.3 Slovenia Basmati Rice Market - Industry Life Cycle |
3.4 Slovenia Basmati Rice Market - Porter's Five Forces |
3.5 Slovenia Basmati Rice Market Revenues & Volume Share, By Type, 2022 & 2032F |
3.6 Slovenia Basmati Rice Market Revenues & Volume Share, By Species, 2022 & 2032F |
3.7 Slovenia Basmati Rice Market Revenues & Volume Share, By Application, 2022 & 2032F |
3.8 Slovenia Basmati Rice Market Revenues & Volume Share, By Sales Channel, 2022 & 2032F |
4 Slovenia Basmati Rice Market Dynamics |
4.1 Impact Analysis |
4.2 Market Drivers |
4.3 Market Restraints |
5 Slovenia Basmati Rice Market Trends |
6 Slovenia Basmati Rice Market, By Types |
6.1 Slovenia Basmati Rice Market, By Type |
6.1.1 Overview and Analysis |
6.1.2 Slovenia Basmati Rice Market Revenues & Volume, By Type, 2022-2032F |
6.1.3 Slovenia Basmati Rice Market Revenues & Volume, By Raw, 2022-2032F |
6.1.4 Slovenia Basmati Rice Market Revenues & Volume, By Steamed, 2022-2032F |
6.1.5 Slovenia Basmati Rice Market Revenues & Volume, By Parboiled, 2022-2032F |
6.2 Slovenia Basmati Rice Market, By Species |
6.2.1 Overview and Analysis |
6.2.2 Slovenia Basmati Rice Market Revenues & Volume, By White, 2022-2032F |
6.2.3 Slovenia Basmati Rice Market Revenues & Volume, By Brown, 2022-2032F |
6.3 Slovenia Basmati Rice Market, By Application |
6.3.1 Overview and Analysis |
6.3.2 Slovenia Basmati Rice Market Revenues & Volume, By Food and Cosmetic, 2022-2032F |
6.3.3 Slovenia Basmati Rice Market Revenues & Volume, By Personal Care, 2022-2032F |
6.4 Slovenia Basmati Rice Market, By Sales Channel |
6.4.1 Overview and Analysis |
6.4.2 Slovenia Basmati Rice Market Revenues & Volume, By HORECA, 2022-2032F |
6.4.3 Slovenia Basmati Rice Market Revenues & Volume, By Modern Trade, 2022-2032F |
6.4.4 Slovenia Basmati Rice Market Revenues & Volume, By Convenience Store, 2022-2032F |
6.4.5 Slovenia Basmati Rice Market Revenues & Volume, By Online Store, 2022-2032F |
6.4.6 Slovenia Basmati Rice Market Revenues & Volume, By Traditional Grocery Stores, 2022-2032F |
7 Slovenia Basmati Rice Market Import-Export Trade Statistics |
7.1 Slovenia Basmati Rice Market Export to Major Countries |
7.2 Slovenia Basmati Rice Market Imports from Major Countries |
8 Slovenia Basmati Rice Market Key Performance Indicators |
9 Slovenia Basmati Rice Market - Opportunity Assessment |
9.1 Slovenia Basmati Rice Market Opportunity Assessment, By Type, 2022 & 2032F |
9.2 Slovenia Basmati Rice Market Opportunity Assessment, By Species, 2022 & 2032F |
9.3 Slovenia Basmati Rice Market Opportunity Assessment, By Application, 2022 & 2032F |
9.4 Slovenia Basmati Rice Market Opportunity Assessment, By Sales Channel, 2022 & 2032F |
10 Slovenia Basmati Rice Market - Competitive Landscape |
10.1 Slovenia Basmati Rice Market Revenue Share, By Companies, 2025 |
10.2 Slovenia Basmati Rice Market Competitive Benchmarking, By Operating and Technical Parameters |
11 Company Profiles |
12 Recommendations |
13 Disclaimer |
Export potential assessment - trade Analytics for 2030
Export potential enables firms to identify high-growth global markets with greater confidence by combining advanced trade intelligence with a structured quantitative methodology. The framework analyzes emerging demand trends and country-level import patterns while integrating macroeconomic and trade datasets such as GDP and population forecasts, bilateral import–export flows, tariff structures, elasticity differentials between developed and developing economies, geographic distance, and import demand projections. Using weighted trade values from 2020–2024 as the base period to project country-to-country export potential for 2030, these inputs are operationalized through calculated drivers such as gravity model parameters, tariff impact factors, and projected GDP per-capita growth. Through an analysis of hidden potentials, demand hotspots, and market conditions that are most favorable to success, this method enables firms to focus on target countries, maximize returns, and global expansion with data, backed by accuracy.
By factoring in the projected importer demand gap that is currently unmet and could be potential opportunity, it identifies the potential for the Exporter (Country) among 190 countries, against the general trade analysis, which identifies the biggest importer or exporter.
To discover high-growth global markets and optimize your business strategy:
Click Here
Pricing
- Single User License$ 1,995
- Department License$ 2,400
- Site License$ 3,120
- Global License$ 3,795

Search
Thought Leadership and Analyst Meet


Our Clients
Latest Reports
- Canada Cloud CFD Market (2026-2032) | Size & Revenue, Industry, Growth, Competitive Landscape, Forecast, Segmentation, Value, Outlook, Trends, Share, Analysis, Companies
- Taiwan Food Delivery Platform Market (2026-2032) | Companies, Outlook, Analysis, Trends, Value, Revenue, Segmentation, Share, Forecast, Competitive Landscape, Growth, Size & Forecast
- United Kingdom (UK) Long-term Care Insurance Market (2026-2032) | Growth, Share, Consumer Insights, Drivers, Opportunities, Competition, Pricing Analysis, Segments, Restraints, Companies, Competitive, Value, Outlook, Size, Demand, Analysis, Challenges, Strategic Insights, Investment Trends, Revenue, Trends, Supply, Forecast
- United Kingdom (UK) Long Term Care Market (2026-2032) | Companies, Outlook, Analysis, Trends, Value, Revenue, Segmentation, Share, Forecast, Competitive Landscape, Growth, Size & Forecast
- Iraq Insulation and Waterproofing Market (2026-2032) | Outlook, Drivers, Growth, Size, Share, Industry, Revenue, Trends, Demand, Competitive, Strategic Insights, Opportunities, Segments, Companies, Challenges, Strategy, Consumer Insights, Analysis, Investment Trends, Value, Segmentation, Forecast, Restraints
- India Switchgear Market Outlook (2026-2032) | Size, Share, Trends, Growth, Revenue, Forecast, Analysis, Value, Outlook
- Pakistan Contraceptive Implants Market (2025-2031) | Demand, Growth, Size, Share, Industry, Pricing Analysis, Competitive, Strategic Insights, Strategy, Consumer Insights, Analysis, Investment Trends, Opportunities, Revenue, Segments, Value, Segmentation, Supply, Forecast, Restraints, Outlook, Competition, Drivers, Trends, Companies, Challenges
- Sri Lanka Packaging Market (2026-2032) | Outlook, Competition, Drivers, Trends, Demand, Pricing Analysis, Competitive, Strategic Insights, Companies, Challenges, Strategy, Consumer Insights, Analysis, Investment Trends, Opportunities, Growth, Size, Share, Industry, Revenue, Segments, Value, Segmentation, Supply, Forecast, Restraints
- India Kids Watches Market (2026-2032) | Strategy, Consumer Insights, Analysis, Investment Trends, Opportunities, Growth, Size, Share, Industry, Revenue, Segments, Value, Segmentation, Supply, Forecast, Restraints, Outlook, Competition, Drivers, Trends, Demand, Pricing Analysis, Competitive, Strategic Insights, Companies, Challenges
- Saudi Arabia Core Assurance Service Market (2025-2031) | Strategy, Consumer Insights, Analysis, Investment Trends, Opportunities, Growth, Size, Share, Industry, Revenue, Segments, Value, Segmentation, Supply, Forecast, Restraints, Outlook, Competition, Drivers, Trends, Demand, Pricing Analysis, Competitive, Strategic Insights, Companies, Challenges
Industry Events and Analyst Meet

India EV Show 2026

EV tech India Expo 2026

Auto Tech Asia 2026

Battery Tech India 2026

Smart Production Solutions Guangzhou 2026
Whitepaper
- Middle East & Africa Commercial Security Market Click here to view more.
- Middle East & Africa Fire Safety Systems & Equipment Market Click here to view more.
- GCC Drone Market Click here to view more.
- Middle East Lighting Fixture Market Click here to view more.
- GCC Physical & Perimeter Security Market Click here to view more.
6WResearch In News
- Doha a strategic location for EV manufacturing hub: IPA Qatar
- Demand for luxury TVs surging in the GCC, says Samsung
- Empowering Growth: The Thriving Journey of Bangladesh’s Cable Industry
- Demand for luxury TVs surging in the GCC, says Samsung
- Video call with a traditional healer? Once unthinkable, it’s now common in South Africa
- Intelligent Buildings To Smooth GCC’s Path To Net Zero