Slovenia Bio Compatible Dental Materials Market (2026-2032) | Opportunities, Strategy, Drivers, Forecast, Consumer Insights, Industry, Segments, Analysis, Size, Competition, Supply, Revenue, Challenges, Companies, Investment Trends, Strategic Insights, Growth, Pricing Analysis, Competitive, Segmentation, Restraints, Demand, Trends, Outlook, Value, Share
Market Forecast By Material Type (Bio-Ceramics, Bio-Polymers, Bio-Metals), By Application (Dental Crowns, Braces, Dental Implants), By End User (Clinics, Orthodontics, Dental Labs), By Source (Biomass, Plant-Based, Sugar-Based), By Environmental Impact (Biodegradable, Non-Toxic, Durable) And Competitive Landscape
| Product Code: ETC11452836 | Publication Date: Apr 2025 | Updated Date: Apr 2026 | Product Type: Market Research Report | |
| Publisher: 6Wresearch | No. of Pages: 65 | No. of Figures: 34 | No. of Tables: 19 | |
Slovenia Bio Compatible Dental Materials Market Size (2020-2030)
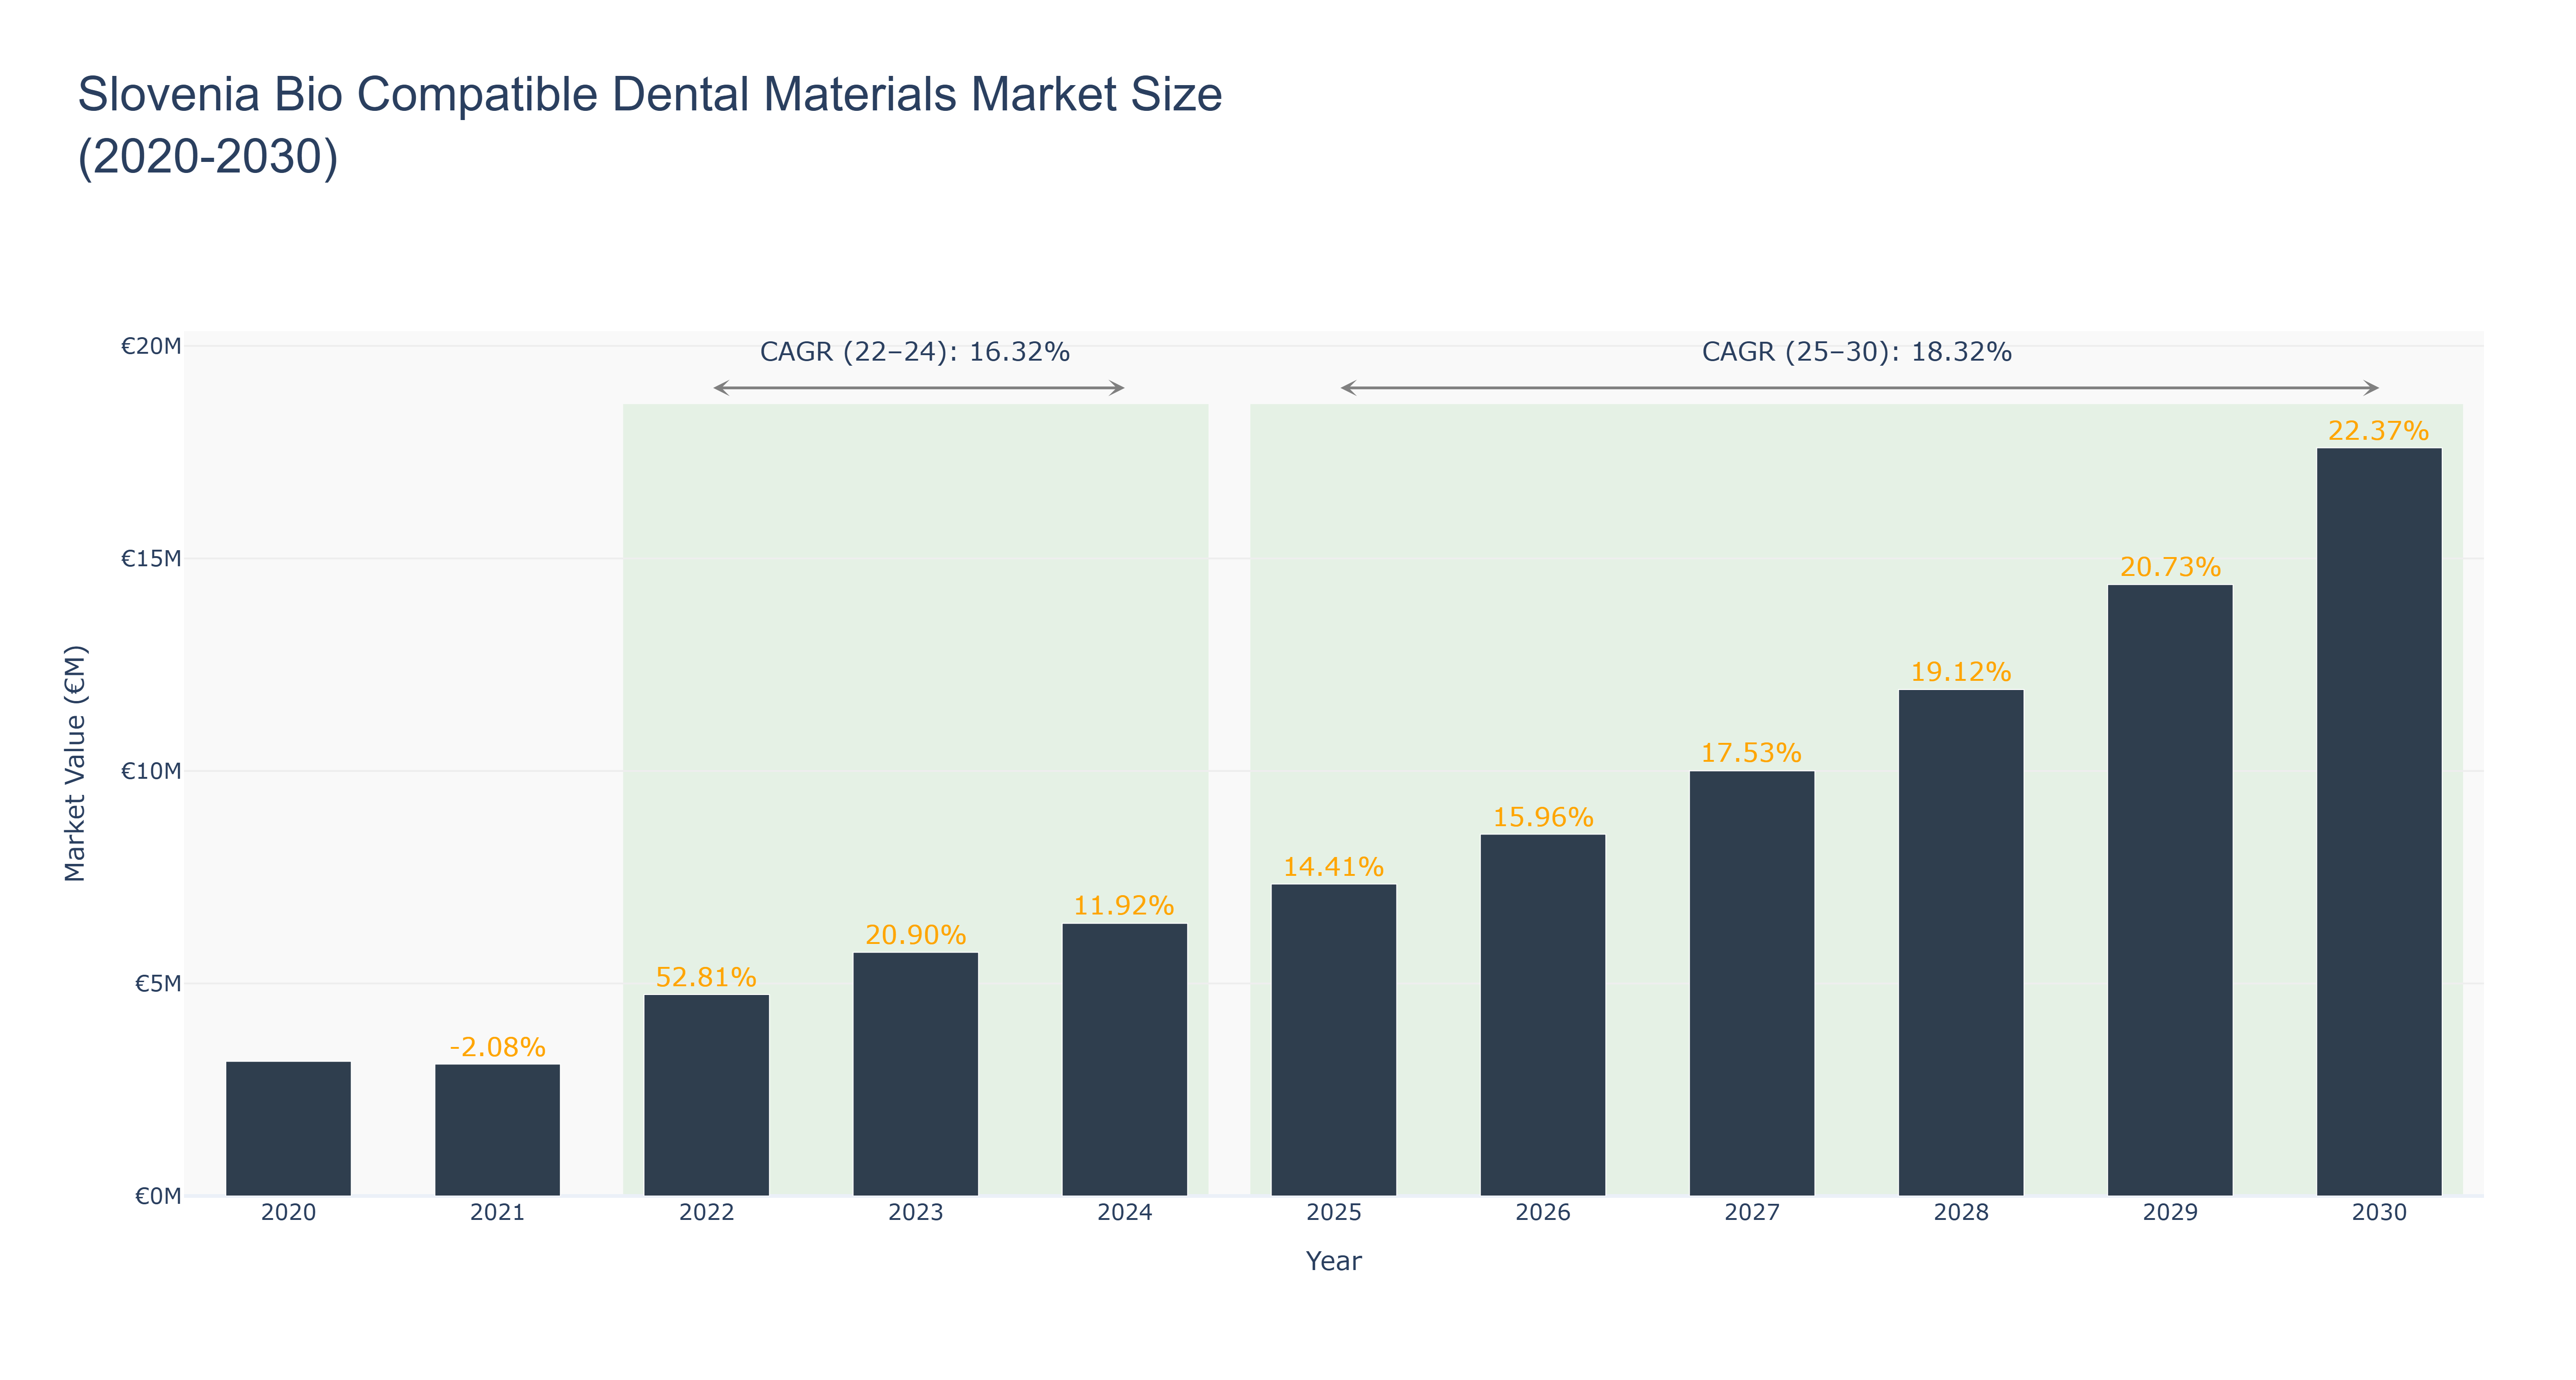
The Slovenia Bio Compatible Dental Materials Market has demonstrated significant volatility between 2020 and 2024, peaking at €5.73 million in 2023, following a notable growth rate of 20.90%. After a decline in 2021, the market recovered robustly, with a CAGR of 16.32% from 2022 to 2024, driven by increasing dental health awareness and advancements in dental materials technology. Looking ahead to the forecasted period from 2025 to 2030, the market is projected to continue its upward trajectory, reaching €17.60 million by 2030, with a CAGR of 18.32%. This anticipated growth is likely fueled by the rising demand for aesthetic dentistry and biocompatible materials, alongside ongoing innovations in dental product formulations. As Slovenia’s healthcare sector evolves, investments in dental infrastructure and technology are expected to further enhance market dynamics, positioning it for sustained expansion in the coming years.
Slovenia Bio Compatible Dental Materials Market: Production & Trade Performance (2019-2025)
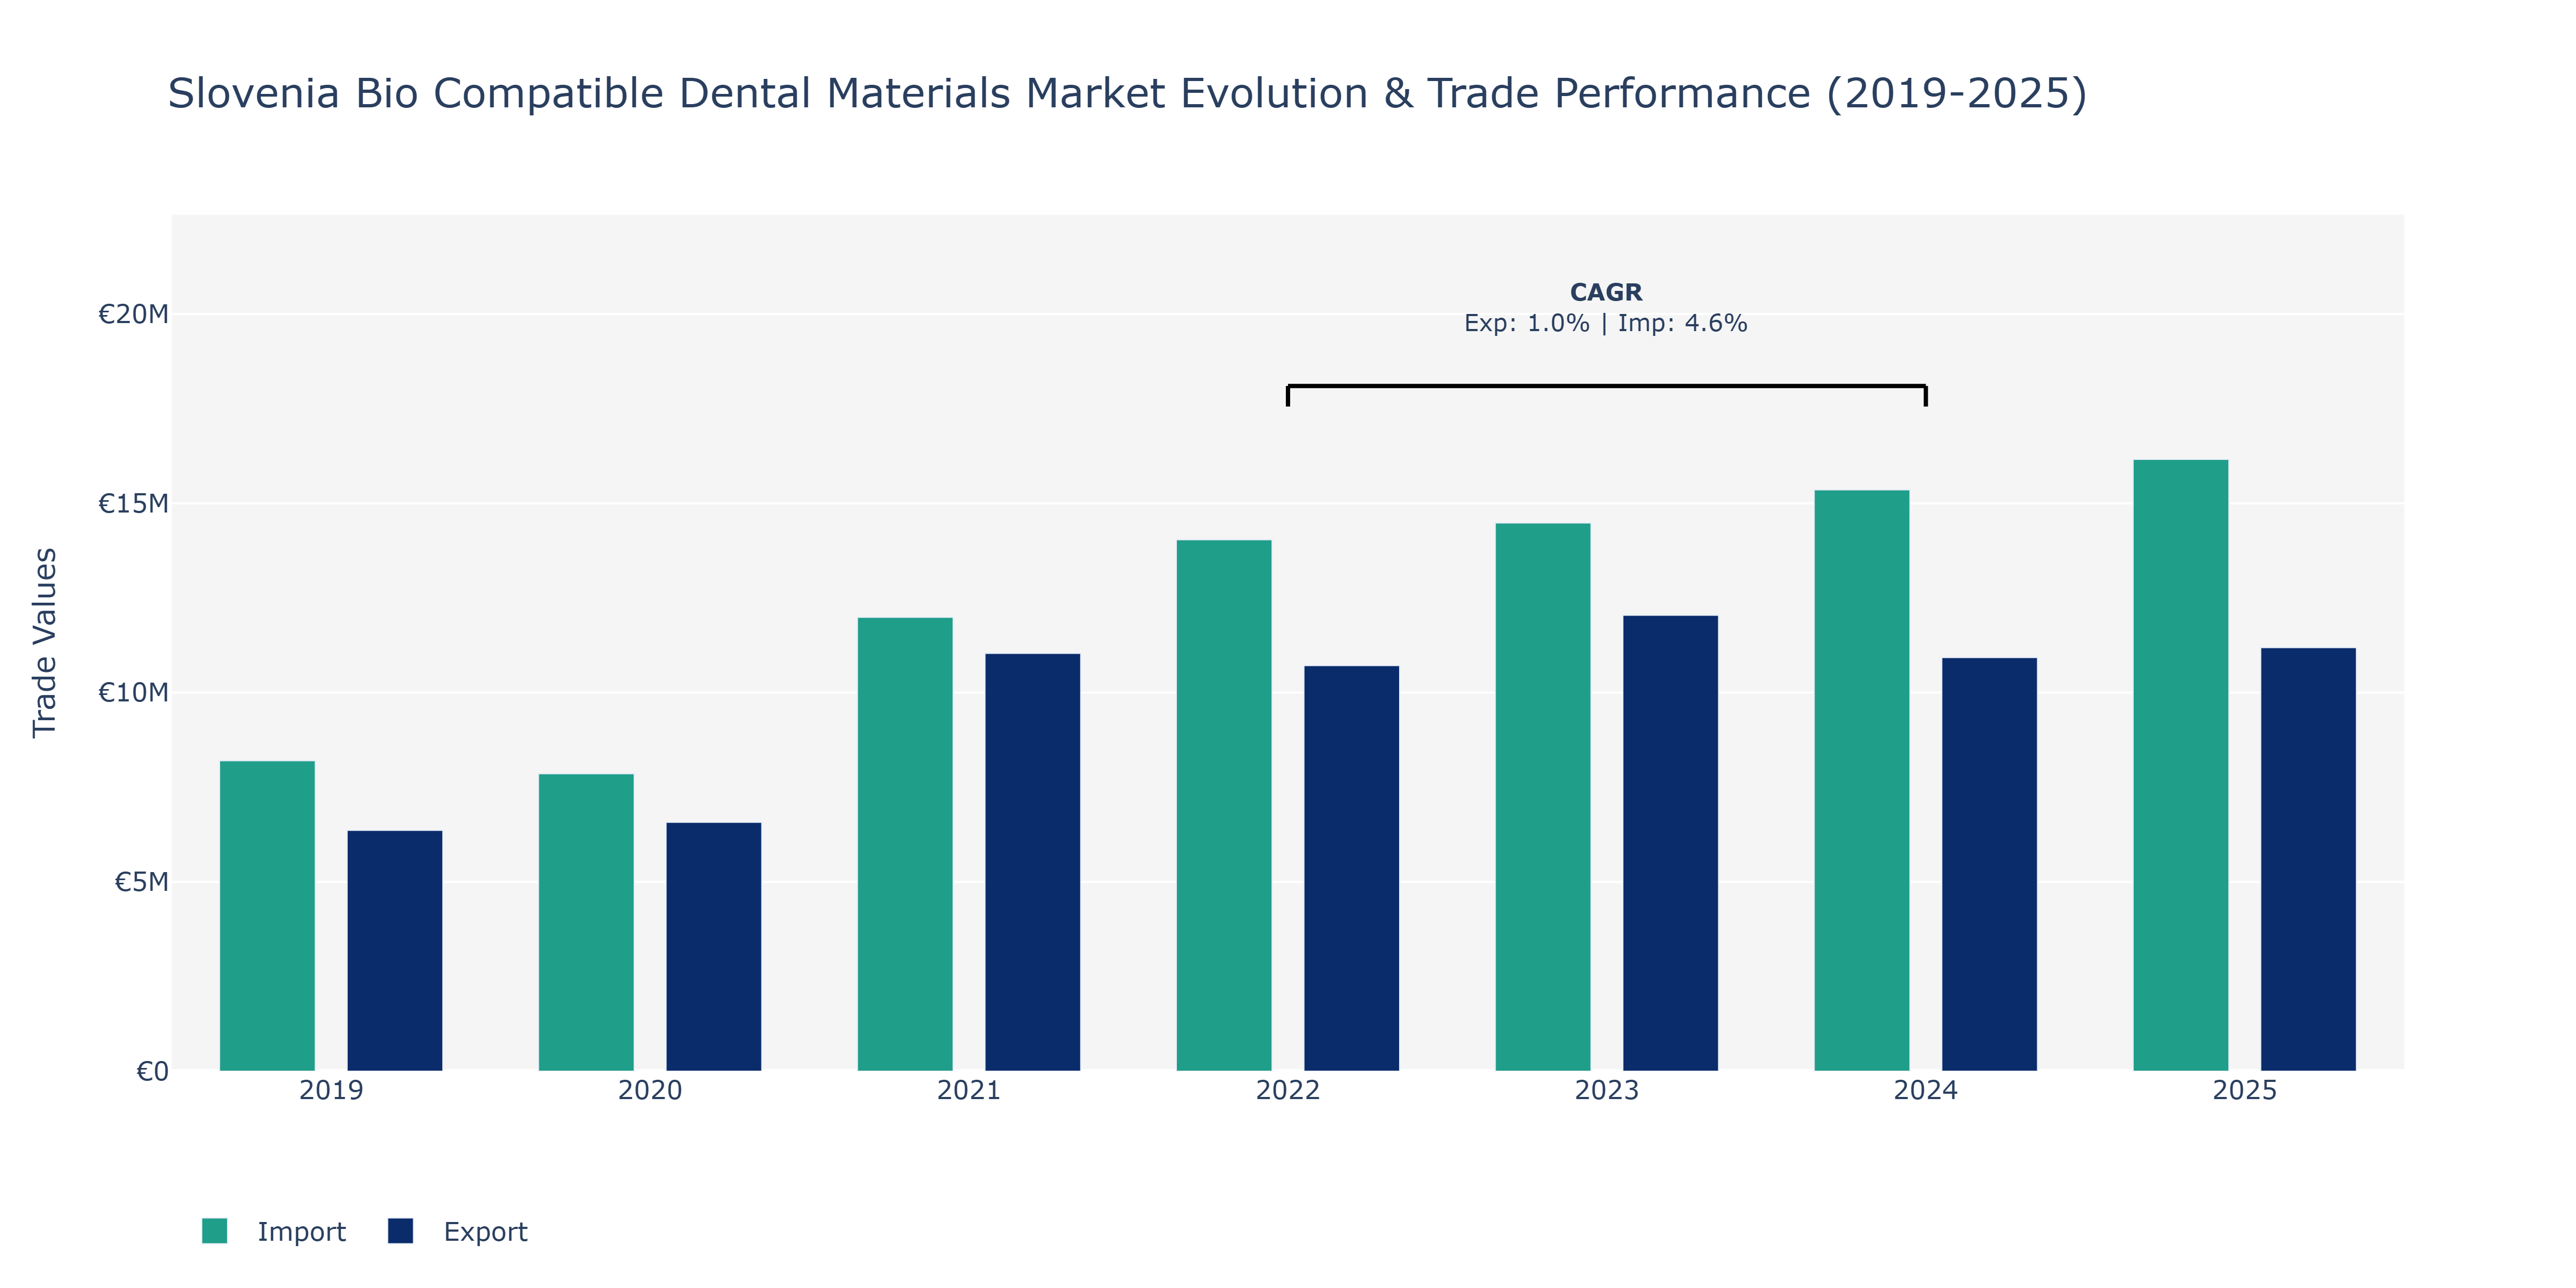
The Slovenia Bio Compatible Dental Materials Market witnessed fluctuations in both Exports and Imports from 2019 to 2025. Exports showed a steady growth trajectory, increasing from €6.36 million in 2019 to €11.88 million in 2025, with peaks in 2021 and 2023. Conversely, Imports followed a fluctuating pattern, starting at €8.2 million in 2019, peaking in 2025 at €16.16 million. The rise in Exports can be attributed to the increasing demand for bio-compatible dental materials globally, driven by technological advancements and a growing focus on environmentally friendly products in the dental industry. On the other hand, the fluctuations in Imports could be influenced by changing supplier relationships, market dynamics, and regulatory factors impacting the procurement of these specialized materials. The higher growth rate in Imports compared to Exports indicates a possible shift towards sourcing a broader range of bio-compatible dental materials from international markets, reflecting a dynamic landscape in the industry.
Key Highlights of the Report:
- Slovenia Bio Compatible Dental Materials Market Outlook
- Market Size of Slovenia Bio Compatible Dental Materials Market, 2025
- Forecast of Slovenia Bio Compatible Dental Materials Market, 2032
- Historical Data and Forecast of Slovenia Bio Compatible Dental Materials Revenues & Volume for the Period 2022-2032F
- Slovenia Bio Compatible Dental Materials Market Trend Evolution
- Slovenia Bio Compatible Dental Materials Market Drivers and Challenges
- Slovenia Bio Compatible Dental Materials Price Trends
- Slovenia Bio Compatible Dental Materials Porter's Five Forces
- Slovenia Bio Compatible Dental Materials Industry Life Cycle
- Historical Data and Forecast of Slovenia Bio Compatible Dental Materials Market Revenues & Volume By Material Type for the Period 2022-2032F
- Historical Data and Forecast of Slovenia Bio Compatible Dental Materials Market Revenues & Volume By Bio-Ceramics for the Period 2022-2032F
- Historical Data and Forecast of Slovenia Bio Compatible Dental Materials Market Revenues & Volume By Bio-Polymers for the Period 2022-2032F
- Historical Data and Forecast of Slovenia Bio Compatible Dental Materials Market Revenues & Volume By Bio-Metals for the Period 2022-2032F
- Historical Data and Forecast of Slovenia Bio Compatible Dental Materials Market Revenues & Volume By Application for the Period 2022-2032F
- Historical Data and Forecast of Slovenia Bio Compatible Dental Materials Market Revenues & Volume By Dental Crowns for the Period 2022-2032F
- Historical Data and Forecast of Slovenia Bio Compatible Dental Materials Market Revenues & Volume By Braces for the Period 2022-2032F
- Historical Data and Forecast of Slovenia Bio Compatible Dental Materials Market Revenues & Volume By Dental Implants for the Period 2022-2032F
- Historical Data and Forecast of Slovenia Bio Compatible Dental Materials Market Revenues & Volume By End User for the Period 2022-2032F
- Historical Data and Forecast of Slovenia Bio Compatible Dental Materials Market Revenues & Volume By Clinics for the Period 2022-2032F
- Historical Data and Forecast of Slovenia Bio Compatible Dental Materials Market Revenues & Volume By Orthodontics for the Period 2022-2032F
- Historical Data and Forecast of Slovenia Bio Compatible Dental Materials Market Revenues & Volume By Dental Labs for the Period 2022-2032F
- Historical Data and Forecast of Slovenia Bio Compatible Dental Materials Market Revenues & Volume By Source for the Period 2022-2032F
- Historical Data and Forecast of Slovenia Bio Compatible Dental Materials Market Revenues & Volume By Biomass for the Period 2022-2032F
- Historical Data and Forecast of Slovenia Bio Compatible Dental Materials Market Revenues & Volume By Plant-Based for the Period 2022-2032F
- Historical Data and Forecast of Slovenia Bio Compatible Dental Materials Market Revenues & Volume By Sugar-Based for the Period 2022-2032F
- Historical Data and Forecast of Slovenia Bio Compatible Dental Materials Market Revenues & Volume By Environmental Impact for the Period 2022-2032F
- Historical Data and Forecast of Slovenia Bio Compatible Dental Materials Market Revenues & Volume By Biodegradable for the Period 2022-2032F
- Historical Data and Forecast of Slovenia Bio Compatible Dental Materials Market Revenues & Volume By Non-Toxic for the Period 2022-2032F
- Historical Data and Forecast of Slovenia Bio Compatible Dental Materials Market Revenues & Volume By Durable for the Period 2022-2032F
- Slovenia Bio Compatible Dental Materials Import Export Trade Statistics
- Market Opportunity Assessment By Material Type
- Market Opportunity Assessment By Application
- Market Opportunity Assessment By End User
- Market Opportunity Assessment By Source
- Market Opportunity Assessment By Environmental Impact
- Slovenia Bio Compatible Dental Materials Top Companies Market Share
- Slovenia Bio Compatible Dental Materials Competitive Benchmarking By Technical and Operational Parameters
- Slovenia Bio Compatible Dental Materials Company Profiles
- Slovenia Bio Compatible Dental Materials Key Strategic Recommendations
Frequently Asked Questions About the Market Study (FAQs):
6Wresearch actively monitors the Slovenia Bio Compatible Dental Materials Market and publishes its comprehensive annual report, highlighting emerging trends, growth drivers, revenue analysis, and forecast outlook. Our insights help businesses to make data-backed strategic decisions with ongoing market dynamics. Our analysts track relevent industries related to the Slovenia Bio Compatible Dental Materials Market, allowing our clients with actionable intelligence and reliable forecasts tailored to emerging regional needs.
Yes, we provide customisation as per your requirements. To learn more, feel free to contact us on sales@6wresearch.com
1 Executive Summary |
2 Introduction |
2.1 Key Highlights of the Report |
2.2 Report Description |
2.3 Market Scope & Segmentation |
2.4 Research Methodology |
2.5 Assumptions |
3 Slovenia Bio Compatible Dental Materials Market Overview |
3.1 Slovenia Country Macro Economic Indicators |
3.2 Slovenia Bio Compatible Dental Materials Market Revenues & Volume, 2022 & 2032F |
3.3 Slovenia Bio Compatible Dental Materials Market - Industry Life Cycle |
3.4 Slovenia Bio Compatible Dental Materials Market - Porter's Five Forces |
3.5 Slovenia Bio Compatible Dental Materials Market Revenues & Volume Share, By Material Type, 2022 & 2032F |
3.6 Slovenia Bio Compatible Dental Materials Market Revenues & Volume Share, By Application, 2022 & 2032F |
3.7 Slovenia Bio Compatible Dental Materials Market Revenues & Volume Share, By End User, 2022 & 2032F |
3.8 Slovenia Bio Compatible Dental Materials Market Revenues & Volume Share, By Source, 2022 & 2032F |
3.9 Slovenia Bio Compatible Dental Materials Market Revenues & Volume Share, By Environmental Impact, 2022 & 2032F |
4 Slovenia Bio Compatible Dental Materials Market Dynamics |
4.1 Impact Analysis |
4.2 Market Drivers |
4.2.1 Increasing awareness and demand for environmentally friendly dental materials |
4.2.2 Growing prevalence of dental diseases and disorders |
4.2.3 Technological advancements in bio compatible dental materials |
4.3 Market Restraints |
4.3.1 High cost associated with bio compatible dental materials |
4.3.2 Limited availability of skilled professionals for handling these materials |
4.3.3 Stringent regulations and approval processes for bio compatible materials |
5 Slovenia Bio Compatible Dental Materials Market Trends |
6 Slovenia Bio Compatible Dental Materials Market, By Types |
6.1 Slovenia Bio Compatible Dental Materials Market, By Material Type |
6.1.1 Overview and Analysis |
6.1.2 Slovenia Bio Compatible Dental Materials Market Revenues & Volume, By Material Type, 2022 - 2032F |
6.1.3 Slovenia Bio Compatible Dental Materials Market Revenues & Volume, By Bio-Ceramics, 2022 - 2032F |
6.1.4 Slovenia Bio Compatible Dental Materials Market Revenues & Volume, By Bio-Polymers, 2022 - 2032F |
6.1.5 Slovenia Bio Compatible Dental Materials Market Revenues & Volume, By Bio-Metals, 2022 - 2032F |
6.2 Slovenia Bio Compatible Dental Materials Market, By Application |
6.2.1 Overview and Analysis |
6.2.2 Slovenia Bio Compatible Dental Materials Market Revenues & Volume, By Dental Crowns, 2022 - 2032F |
6.2.3 Slovenia Bio Compatible Dental Materials Market Revenues & Volume, By Braces, 2022 - 2032F |
6.2.4 Slovenia Bio Compatible Dental Materials Market Revenues & Volume, By Dental Implants, 2022 - 2032F |
6.3 Slovenia Bio Compatible Dental Materials Market, By End User |
6.3.1 Overview and Analysis |
6.3.2 Slovenia Bio Compatible Dental Materials Market Revenues & Volume, By Clinics, 2022 - 2032F |
6.3.3 Slovenia Bio Compatible Dental Materials Market Revenues & Volume, By Orthodontics, 2022 - 2032F |
6.3.4 Slovenia Bio Compatible Dental Materials Market Revenues & Volume, By Dental Labs, 2022 - 2032F |
6.4 Slovenia Bio Compatible Dental Materials Market, By Source |
6.4.1 Overview and Analysis |
6.4.2 Slovenia Bio Compatible Dental Materials Market Revenues & Volume, By Biomass, 2022 - 2032F |
6.4.3 Slovenia Bio Compatible Dental Materials Market Revenues & Volume, By Plant-Based, 2022 - 2032F |
6.4.4 Slovenia Bio Compatible Dental Materials Market Revenues & Volume, By Sugar-Based, 2022 - 2032F |
6.5 Slovenia Bio Compatible Dental Materials Market, By Environmental Impact |
6.5.1 Overview and Analysis |
6.5.2 Slovenia Bio Compatible Dental Materials Market Revenues & Volume, By Biodegradable, 2022 - 2032F |
6.5.3 Slovenia Bio Compatible Dental Materials Market Revenues & Volume, By Non-Toxic, 2022 - 2032F |
6.5.4 Slovenia Bio Compatible Dental Materials Market Revenues & Volume, By Durable, 2022 - 2032F |
7 Slovenia Bio Compatible Dental Materials Market Import-Export Trade Statistics |
7.1 Slovenia Bio Compatible Dental Materials Market Export to Major Countries |
7.2 Slovenia Bio Compatible Dental Materials Market Imports from Major Countries |
8 Slovenia Bio Compatible Dental Materials Market Key Performance Indicators |
8.1 Adoption rate of bio compatible dental materials by dental clinics |
8.2 Number of research studies and publications on bio compatible dental materials |
8.3 Percentage of dental professionals trained in the use of bio compatible materials |
9 Slovenia Bio Compatible Dental Materials Market - Opportunity Assessment |
9.1 Slovenia Bio Compatible Dental Materials Market Opportunity Assessment, By Material Type, 2022 & 2032F |
9.2 Slovenia Bio Compatible Dental Materials Market Opportunity Assessment, By Application, 2022 & 2032F |
9.3 Slovenia Bio Compatible Dental Materials Market Opportunity Assessment, By End User, 2022 & 2032F |
9.4 Slovenia Bio Compatible Dental Materials Market Opportunity Assessment, By Source, 2022 & 2032F |
9.5 Slovenia Bio Compatible Dental Materials Market Opportunity Assessment, By Environmental Impact, 2022 & 2032F |
10 Slovenia Bio Compatible Dental Materials Market - Competitive Landscape |
10.1 Slovenia Bio Compatible Dental Materials Market Revenue Share, By Companies, 2025 |
10.2 Slovenia Bio Compatible Dental Materials Market Competitive Benchmarking, By Operating and Technical Parameters |
11 Company Profiles |
12 Recommendations |
13 Disclaimer |
Global Go To Market Strategy - 2030
Export potential enables firms to identify high-growth global markets with greater confidence by combining advanced trade intelligence with a structured quantitative methodology. The framework analyzes emerging demand trends and country-level import patterns while integrating macroeconomic and trade datasets such as GDP and population forecasts, bilateral import–export flows, tariff structures, elasticity differentials between developed and developing economies, geographic distance, and import demand projections. Using weighted trade values from 2020–2024 as the base period to project country-to-country export potential for 2030, these inputs are operationalized through calculated drivers such as gravity model parameters, tariff impact factors, and projected GDP per-capita growth. Through an analysis of hidden potentials, demand hotspots, and market conditions that are most favorable to success, this method enables firms to focus on target countries, maximize returns, and global expansion with data, backed by accuracy.
By factoring in the projected importer demand gap that is currently unmet and could be potential opportunity, it identifies the potential for the Exporter (Country) among 190 countries, against the general trade analysis, which identifies the biggest importer or exporter.
To discover high-growth global markets and optimize your business strategy:
Click Here
Pricing
- Single User License$ 1,995
- Department License$ 2,400
- Site License$ 3,120
- Global License$ 3,795

Leadership Perspectives from Industry Events
Search
Thought Leadership and Analyst Meet


Our Clients
6WResearch In News
- Doha a strategic location for EV manufacturing hub: IPA Qatar
- Demand for luxury TVs surging in the GCC, says Samsung
- Empowering Growth: The Thriving Journey of Bangladesh’s Cable Industry
- Demand for luxury TVs surging in the GCC, says Samsung
- Video call with a traditional healer? Once unthinkable, it’s now common in South Africa
- Intelligent Buildings To Smooth GCC’s Path To Net Zero
Latest Reports
- Taiwan Airport Wireless Infrastructure Market (2026-2032)
- Vietnam Airport Wireless Infrastructure Market (2026-2032)
- Thailand Airport Wireless Infrastructure Market (2026-2032)
- South Korea Airport Wireless Infrastructure Market (2026-2032)
- Romania Airport Wireless Infrastructure Market (2026-2032)
- Qatar Airport Wireless Infrastructure Market (2026-2032)
- Philippines Airport Wireless Infrastructure Market (2026-2032)
- Japan Airport Wireless Infrastructure Market (2026-2032)
- Taiwan Airport Winter Services Market (2026-2032)
- Vietnam Airport Winter Services Market (2026-2032)
Industry Events and Analyst Meet

HIMTEX 2026

India Refining Summit 2026

India EV Show 2026

EV tech India Expo 2026

Auto Tech Asia 2026
Whitepaper
- Middle East & Africa Commercial Security Market Click here to view more.
- Middle East & Africa Fire Safety Systems & Equipment Market Click here to view more.
- GCC Drone Market Click here to view more.
- Middle East Lighting Fixture Market Click here to view more.
- GCC Physical & Perimeter Security Market Click here to view more.