Slovenia Black Tea Extract Market (2026-2032) | Outlook, Competitive Landscape, Share, Value, Industry, Companies, Growth, Segmentation, Forecast, Size & Revenue, Analysis, Trends
Market Forecast By Form (Powder, Liquid, Encapsulated), By Type (Hot Water Soluble (HWS), Cold Water Soluble (CWS)), By Application (Beverages, Functional Food, Cosmetics and Beauty Supplements, Dietary Supplements, Others) And Competitive Landscape
| Product Code: ETC9312036 | Publication Date: Sep 2024 | Updated Date: Apr 2026 | Product Type: Market Research Report | |
| Publisher: 6Wresearch | Author: Summon Dutta | No. of Pages: 75 | No. of Figures: 35 | No. of Tables: 20 |
Slovenia Black Tea Extract Market Size (2020-2030)
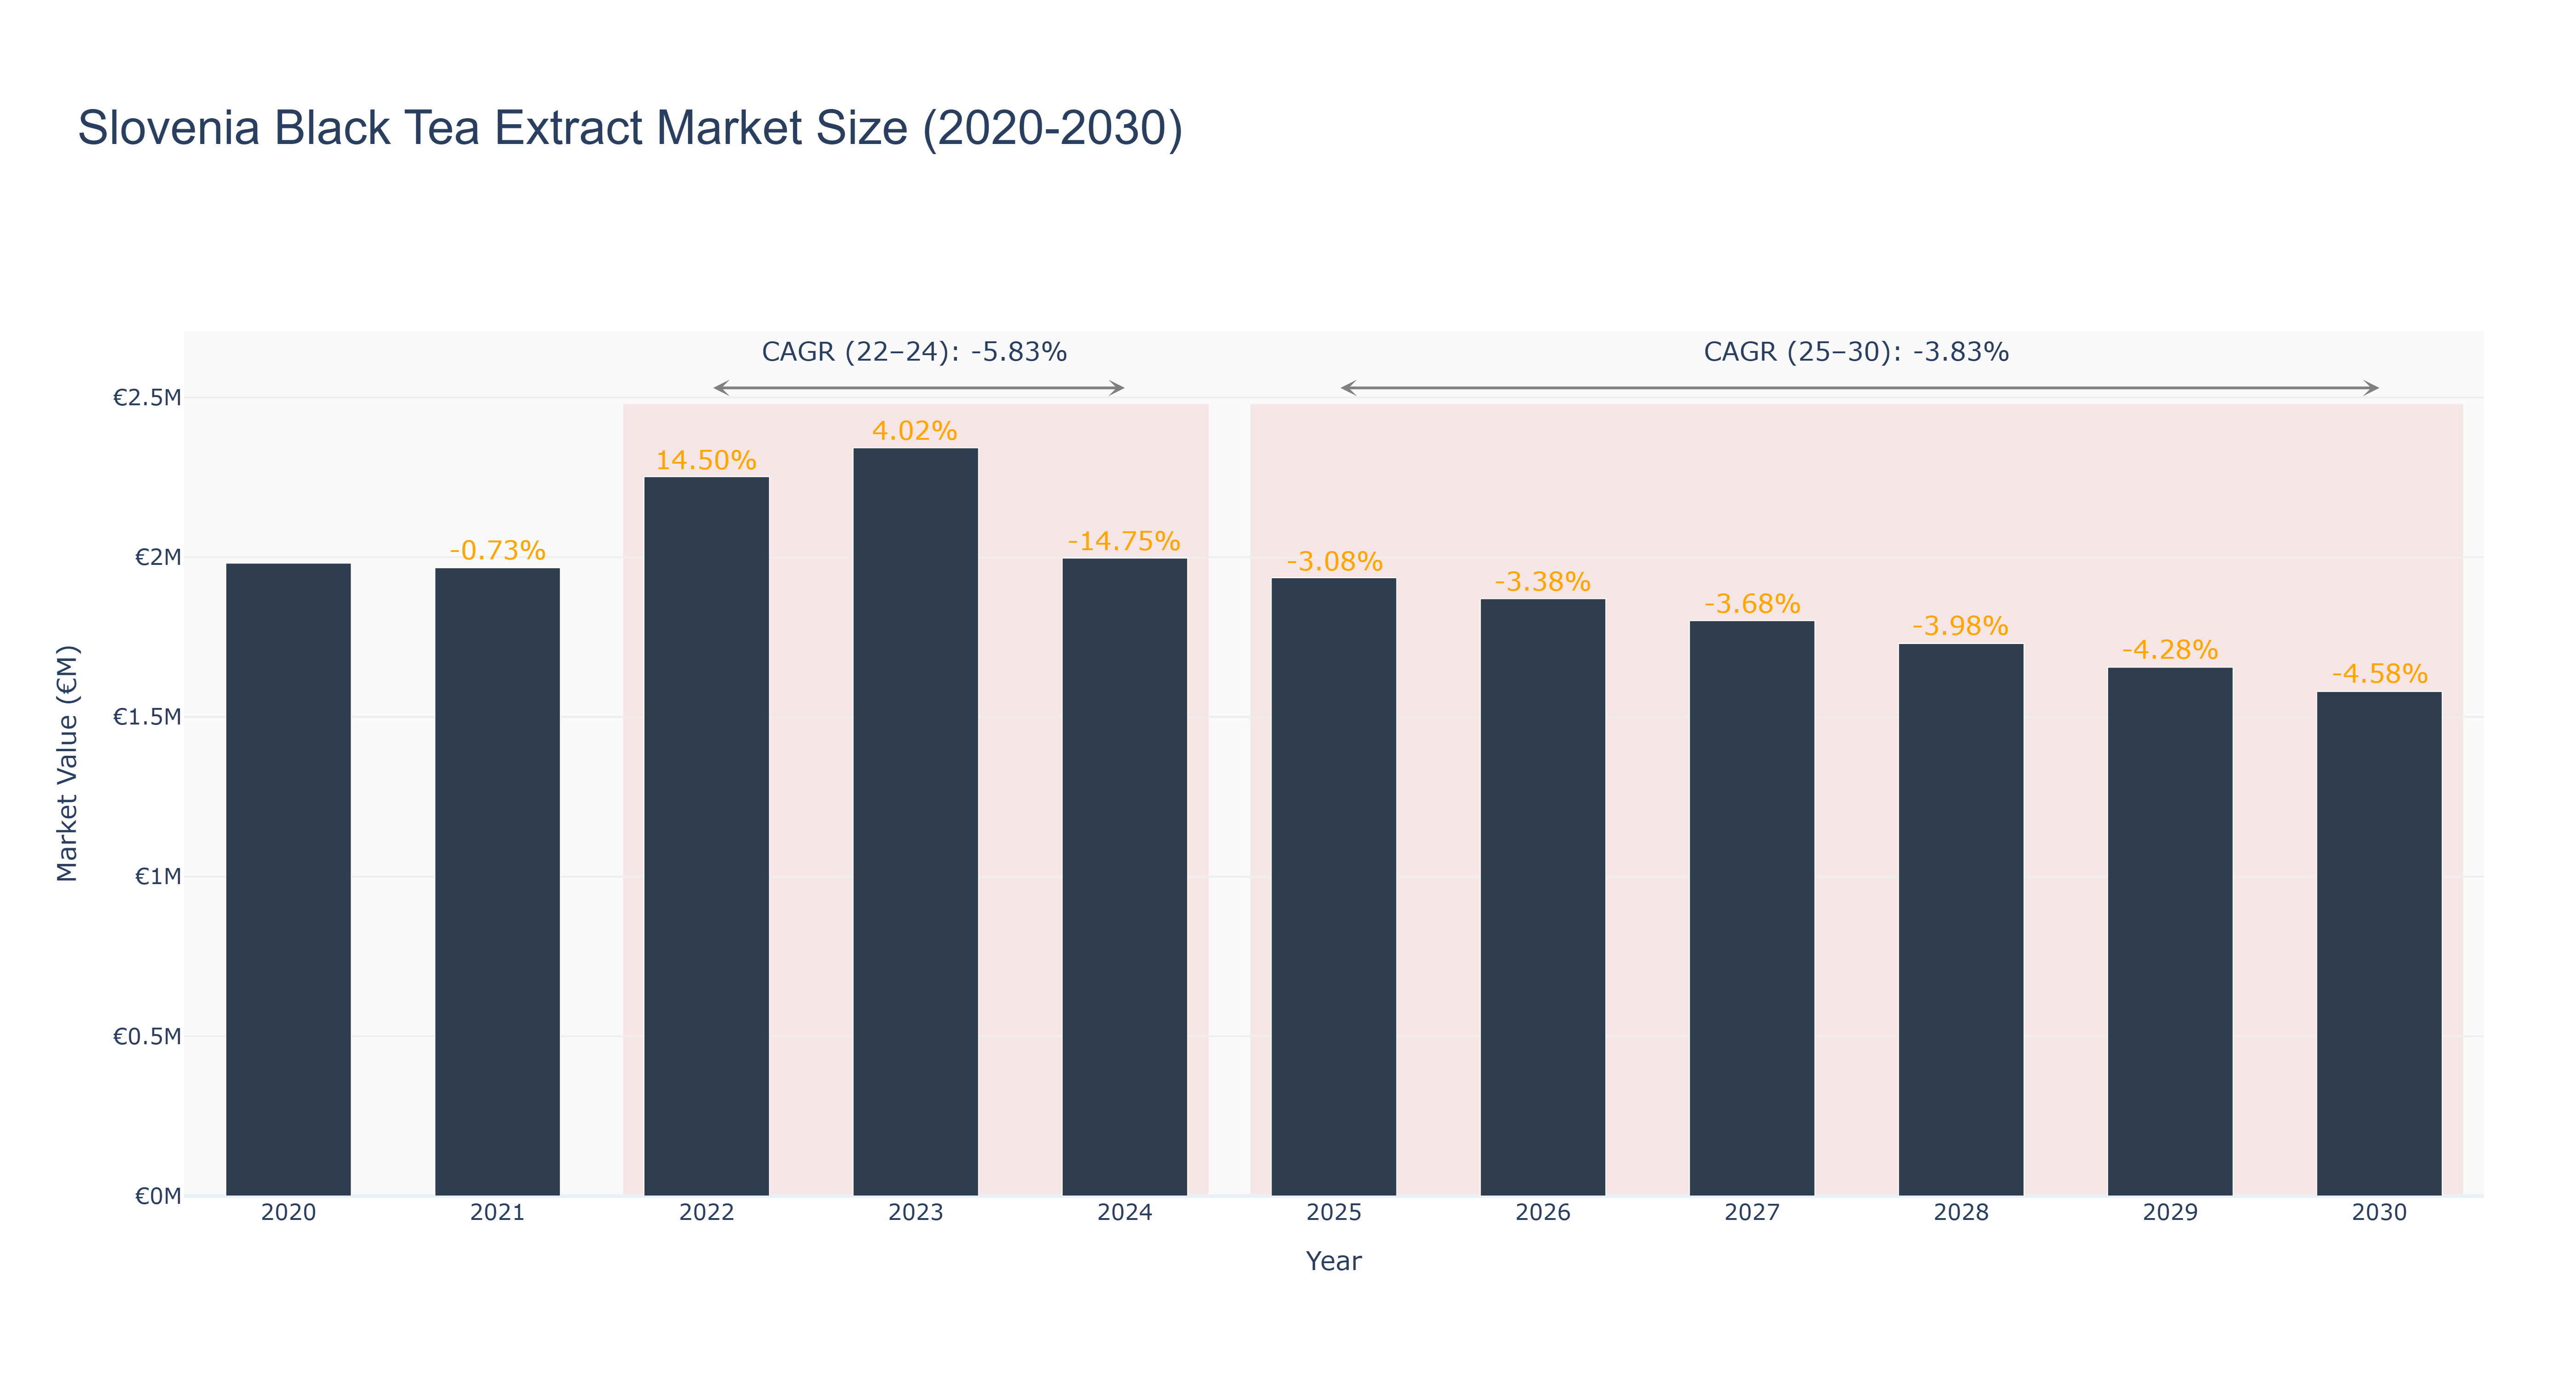
Slovenia Black Tea Extract Market has shown a declining trend in recent years. The peak market size of €2.34 million was observed in 2023, followed by a decrease to €2.00 million in 2024. The forecasted market size is expected to continue decreasing from €1.94 million in 2025 to €1.58 million in 2030, with a CAGR of -3.83%. The market experienced a significant drop in size from 2024 to 2025, potentially due to changing consumer preferences or economic factors impacting the demand for black tea extract products. Looking ahead, industry drivers such as health-conscious consumer trends and increasing awareness of the benefits of black tea extracts may drive market growth. Recent developments in Slovenia's herbal products sector, including government initiatives to promote local herbal products, could further boost the market in the near future.
Slovenia Black Tea Extract Market: Production & Trade Performance (2019-2025)
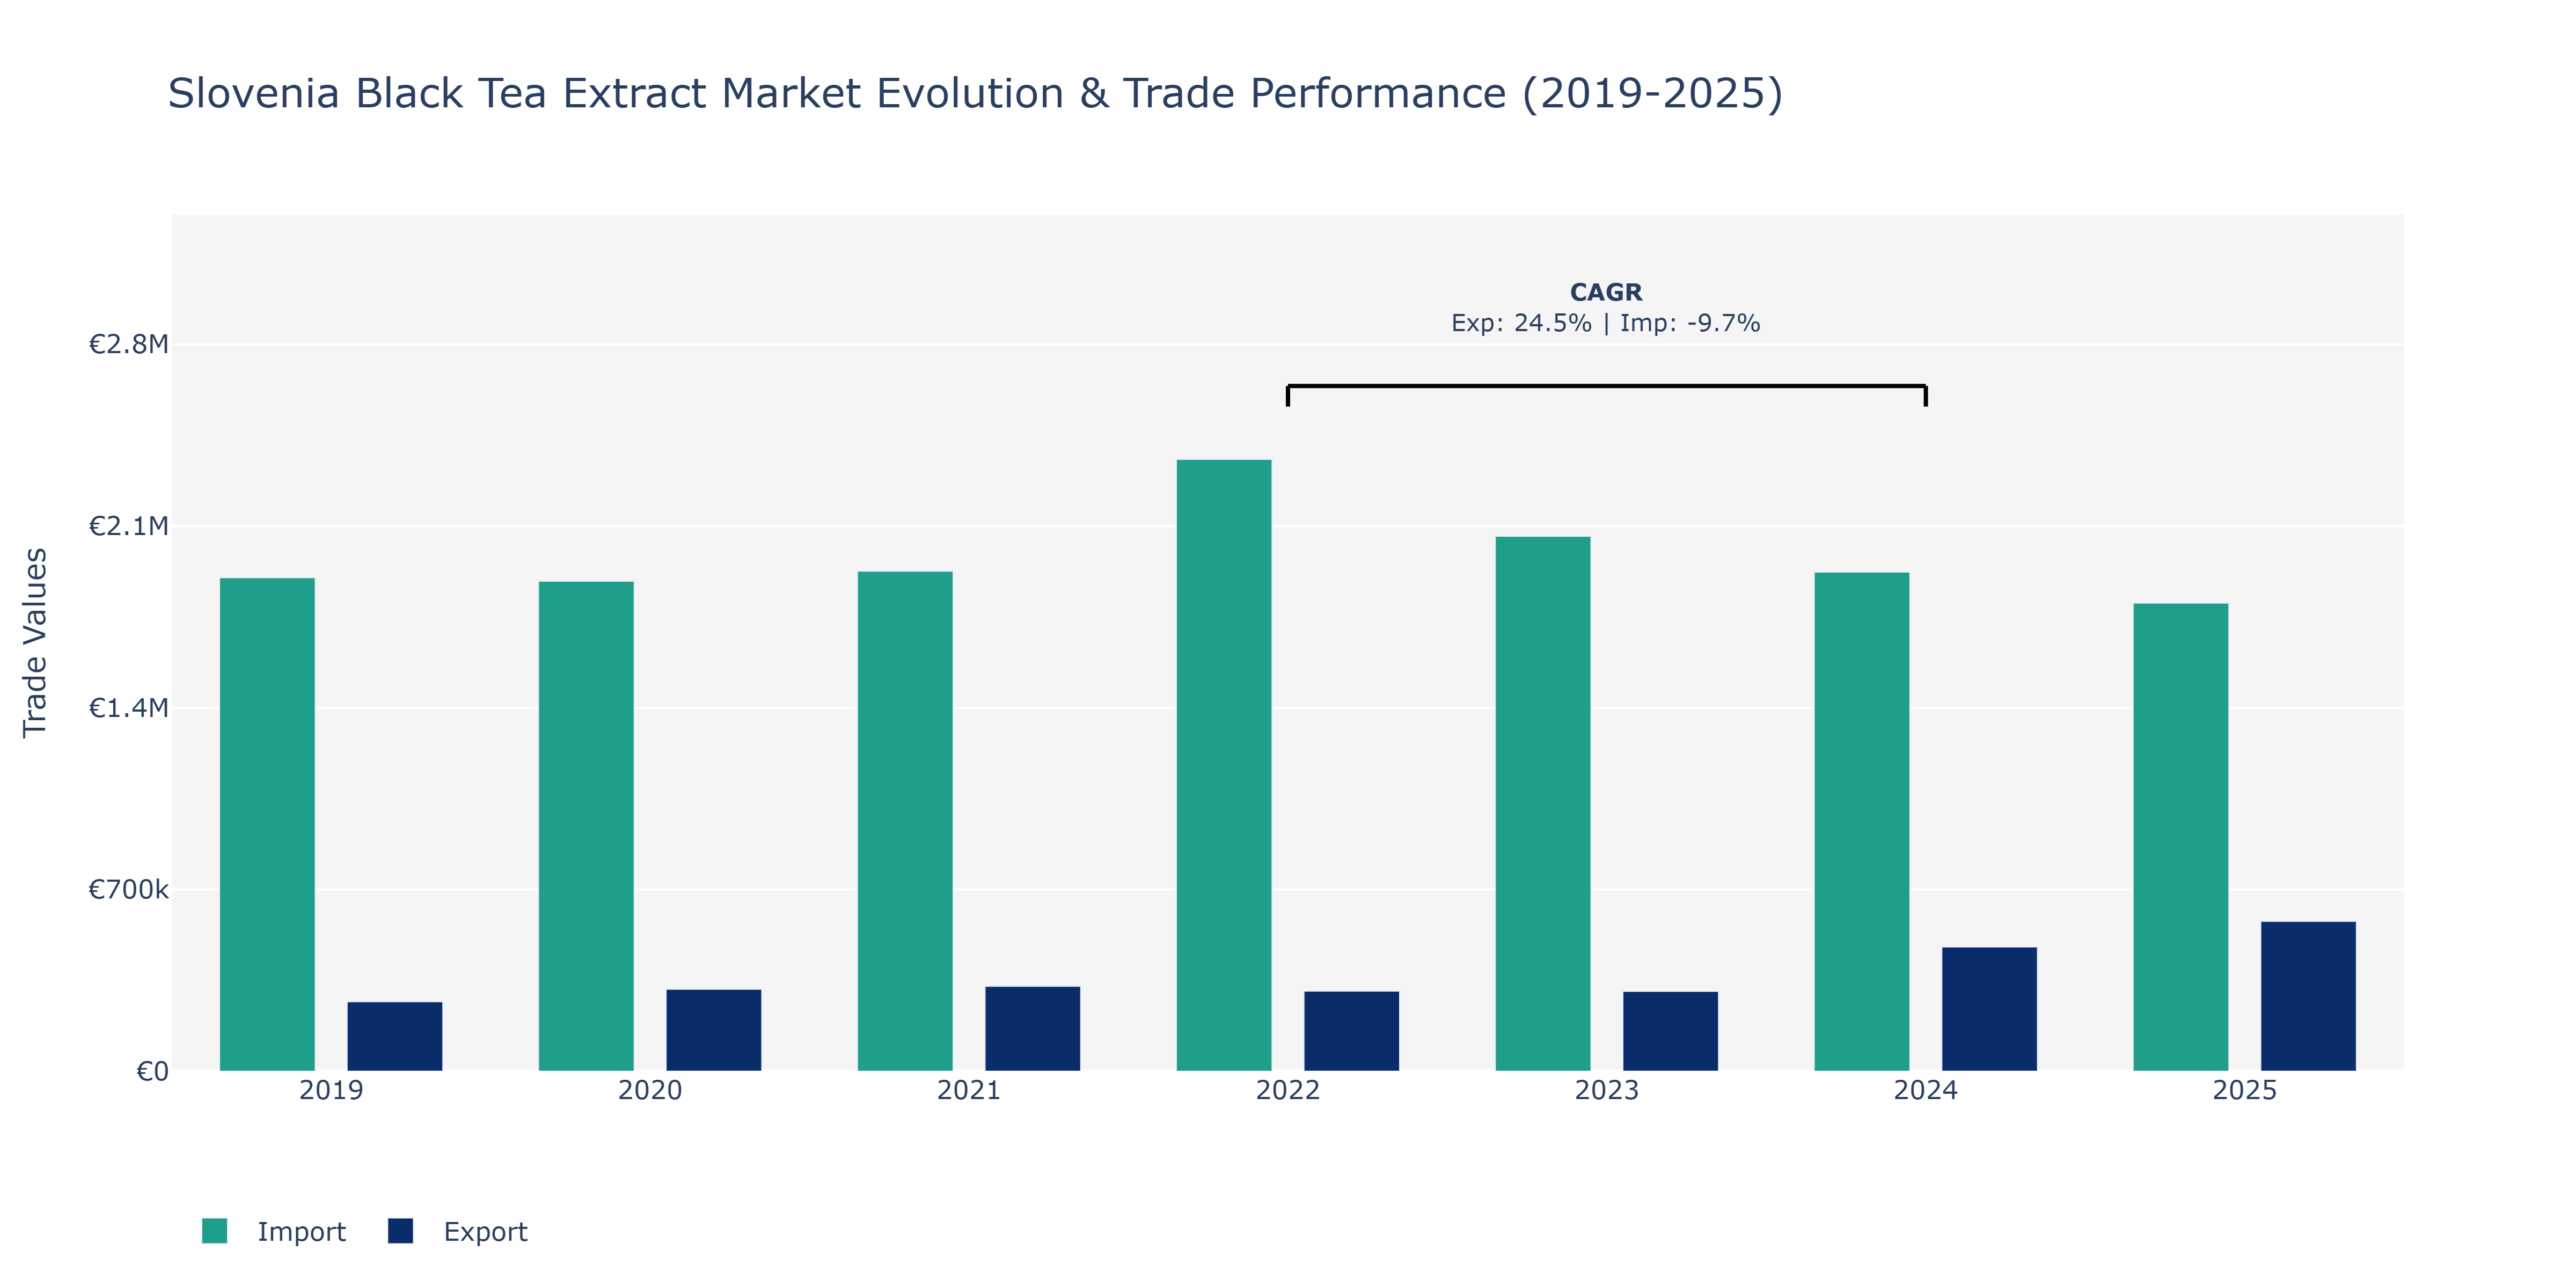
Between 2019 and 2025, Slovenia's Black Tea Extract Market experienced fluctuating trends in both exports and imports. The market saw a notable increase in exports from €267.94 thousand in 2019 to €577.46 thousand in 2025, showing a consistent upward trajectory. In contrast, imports varied more, reaching a peak of €2.36 million in 2022 but declining to €1.8 million in 2025. The significant jump in exports can be attributed to the growing global demand for natural and healthy ingredients, with black tea extract being recognized for its health benefits and antioxidant properties. On the other hand, the fluctuating Import value may be influenced by changing consumer preferences, trade policies, or fluctuations in the availability of raw materials. Slovenia's focus on quality production and innovative product development likely contributed to the market's export growth, while the decline in imports could signal a shift towards more self-sustainable sourcing strategies within the region.
Key Highlights of the Report:
- Slovenia Black Tea Extract Market Outlook
- Market Size of Slovenia Black Tea Extract Market, 2025
- Forecast of Slovenia Black Tea Extract Market, 2032
- Historical Data and Forecast of Slovenia Black Tea Extract Revenues & Volume for the Period 2022-2032F
- Slovenia Black Tea Extract Market Trend Evolution
- Slovenia Black Tea Extract Market Drivers and Challenges
- Slovenia Black Tea Extract Price Trends
- Slovenia Black Tea Extract Porter's Five Forces
- Slovenia Black Tea Extract Industry Life Cycle
- Historical Data and Forecast of Slovenia Black Tea Extract Market Revenues & Volume By Form for the Period 2022-2032F
- Historical Data and Forecast of Slovenia Black Tea Extract Market Revenues & Volume By Powder for the Period 2022-2032F
- Historical Data and Forecast of Slovenia Black Tea Extract Market Revenues & Volume By Liquid for the Period 2022-2032F
- Historical Data and Forecast of Slovenia Black Tea Extract Market Revenues & Volume By Encapsulated for the Period 2022-2032F
- Historical Data and Forecast of Slovenia Black Tea Extract Market Revenues & Volume By Type for the Period 2022-2032F
- Historical Data and Forecast of Slovenia Black Tea Extract Market Revenues & Volume By Hot Water Soluble (HWS) for the Period 2022-2032F
- Historical Data and Forecast of Slovenia Black Tea Extract Market Revenues & Volume By Cold Water Soluble (CWS) for the Period 2022-2032F
- Historical Data and Forecast of Slovenia Black Tea Extract Market Revenues & Volume By Application for the Period 2022-2032F
- Historical Data and Forecast of Slovenia Black Tea Extract Market Revenues & Volume By Beverages for the Period 2022-2032F
- Historical Data and Forecast of Slovenia Black Tea Extract Market Revenues & Volume By Functional Food for the Period 2022-2032F
- Historical Data and Forecast of Slovenia Black Tea Extract Market Revenues & Volume By Cosmetics and Beauty Supplements for the Period 2022-2032F
- Historical Data and Forecast of Slovenia Black Tea Extract Market Revenues & Volume By Dietary Supplements for the Period 2022-2032F
- Historical Data and Forecast of Slovenia Black Tea Extract Market Revenues & Volume By Others for the Period 2022-2032F
- Slovenia Black Tea Extract Import Export Trade Statistics
- Market Opportunity Assessment By Form
- Market Opportunity Assessment By Type
- Market Opportunity Assessment By Application
- Slovenia Black Tea Extract Top Companies Market Share
- Slovenia Black Tea Extract Competitive Benchmarking By Technical and Operational Parameters
- Slovenia Black Tea Extract Company Profiles
- Slovenia Black Tea Extract Key Strategic Recommendations
Frequently Asked Questions About the Market Study (FAQs):
6Wresearch actively monitors the Slovenia Black Tea Extract Market and publishes its comprehensive annual report, highlighting emerging trends, growth drivers, revenue analysis, and forecast outlook. Our insights help businesses to make data-backed strategic decisions with ongoing market dynamics. Our analysts track relevent industries related to the Slovenia Black Tea Extract Market, allowing our clients with actionable intelligence and reliable forecasts tailored to emerging regional needs.
Yes, we provide customisation as per your requirements. To learn more, feel free to contact us on sales@6wresearch.com
1 Executive Summary |
2 Introduction |
2.1 Key Highlights of the Report |
2.2 Report Description |
2.3 Market Scope & Segmentation |
2.4 Research Methodology |
2.5 Assumptions |
3 Slovenia Black Tea Extract Market Overview |
3.1 Slovenia Country Macro Economic Indicators |
3.2 Slovenia Black Tea Extract Market Revenues & Volume, 2022 & 2032F |
3.3 Slovenia Black Tea Extract Market - Industry Life Cycle |
3.4 Slovenia Black Tea Extract Market - Porter's Five Forces |
3.5 Slovenia Black Tea Extract Market Revenues & Volume Share, By Form, 2022 & 2032F |
3.6 Slovenia Black Tea Extract Market Revenues & Volume Share, By Type, 2022 & 2032F |
3.7 Slovenia Black Tea Extract Market Revenues & Volume Share, By Application, 2022 & 2032F |
4 Slovenia Black Tea Extract Market Dynamics |
4.1 Impact Analysis |
4.2 Market Drivers |
4.3 Market Restraints |
5 Slovenia Black Tea Extract Market Trends |
6 Slovenia Black Tea Extract Market, By Types |
6.1 Slovenia Black Tea Extract Market, By Form |
6.1.1 Overview and Analysis |
6.1.2 Slovenia Black Tea Extract Market Revenues & Volume, By Form, 2022-2032F |
6.1.3 Slovenia Black Tea Extract Market Revenues & Volume, By Powder, 2022-2032F |
6.1.4 Slovenia Black Tea Extract Market Revenues & Volume, By Liquid, 2022-2032F |
6.1.5 Slovenia Black Tea Extract Market Revenues & Volume, By Encapsulated, 2022-2032F |
6.2 Slovenia Black Tea Extract Market, By Type |
6.2.1 Overview and Analysis |
6.2.2 Slovenia Black Tea Extract Market Revenues & Volume, By Hot Water Soluble (HWS), 2022-2032F |
6.2.3 Slovenia Black Tea Extract Market Revenues & Volume, By Cold Water Soluble (CWS), 2022-2032F |
6.3 Slovenia Black Tea Extract Market, By Application |
6.3.1 Overview and Analysis |
6.3.2 Slovenia Black Tea Extract Market Revenues & Volume, By Beverages, 2022-2032F |
6.3.3 Slovenia Black Tea Extract Market Revenues & Volume, By Functional Food, 2022-2032F |
6.3.4 Slovenia Black Tea Extract Market Revenues & Volume, By Cosmetics and Beauty Supplements, 2022-2032F |
6.3.5 Slovenia Black Tea Extract Market Revenues & Volume, By Dietary Supplements, 2022-2032F |
6.3.6 Slovenia Black Tea Extract Market Revenues & Volume, By Others, 2022-2032F |
7 Slovenia Black Tea Extract Market Import-Export Trade Statistics |
7.1 Slovenia Black Tea Extract Market Export to Major Countries |
7.2 Slovenia Black Tea Extract Market Imports from Major Countries |
8 Slovenia Black Tea Extract Market Key Performance Indicators |
9 Slovenia Black Tea Extract Market - Opportunity Assessment |
9.1 Slovenia Black Tea Extract Market Opportunity Assessment, By Form, 2022 & 2032F |
9.2 Slovenia Black Tea Extract Market Opportunity Assessment, By Type, 2022 & 2032F |
9.3 Slovenia Black Tea Extract Market Opportunity Assessment, By Application, 2022 & 2032F |
10 Slovenia Black Tea Extract Market - Competitive Landscape |
10.1 Slovenia Black Tea Extract Market Revenue Share, By Companies, 2025 |
10.2 Slovenia Black Tea Extract Market Competitive Benchmarking, By Operating and Technical Parameters |
11 Company Profiles |
12 Recommendations |
13 Disclaimer |
Export potential assessment - trade Analytics for 2030
Export potential enables firms to identify high-growth global markets with greater confidence by combining advanced trade intelligence with a structured quantitative methodology. The framework analyzes emerging demand trends and country-level import patterns while integrating macroeconomic and trade datasets such as GDP and population forecasts, bilateral import–export flows, tariff structures, elasticity differentials between developed and developing economies, geographic distance, and import demand projections. Using weighted trade values from 2020–2024 as the base period to project country-to-country export potential for 2030, these inputs are operationalized through calculated drivers such as gravity model parameters, tariff impact factors, and projected GDP per-capita growth. Through an analysis of hidden potentials, demand hotspots, and market conditions that are most favorable to success, this method enables firms to focus on target countries, maximize returns, and global expansion with data, backed by accuracy.
By factoring in the projected importer demand gap that is currently unmet and could be potential opportunity, it identifies the potential for the Exporter (Country) among 190 countries, against the general trade analysis, which identifies the biggest importer or exporter.
To discover high-growth global markets and optimize your business strategy:
Click Here
Pricing
- Single User License$ 1,995
- Department License$ 2,400
- Site License$ 3,120
- Global License$ 3,795

Search
Thought Leadership and Analyst Meet


Our Clients
Latest Reports
- India Ultrasonic Smart Water Meter Market (2026-2032) | Outlook, Competition, Drivers, Trends, Demand, Competitive, Strategic Insights, Companies, Challenges, Strategy, Consumer Insights, Analysis, Opportunities, Growth, Size, Share, Industry, Revenue, Segments, Value, Segmentation, Supply, Forecast, Restraints,
- India Electromagnetic Bulk Flow Meter Market (2026-2032) | Analysis, Challenges, Strategic Insights, Supply, Forecast, Growth, Share, Consumer Insights, Competitive, Value, Outlook, Size & Demand,
- India Battery Powered Bulk Flow Meter Market (2026-2032) | Outlook, Analysis, Competitive Landscape, Growth, Size, Trends, Value, Revenue, Companies, Segmentation, Share & Forecast
- Bosnia and Herzegovina Fuel-Efficient Winglets Market (2026-2032) | Growth, Competition, Strategy, Restraints, Trends, Challenges, segmentation, Value, Outlook, Investment Opportunities, Analysis, Revenue, Companies, Insights, Pricing, Size, Drivers, Demand, Share, Forecast
- Canada Cloud CFD Market (2026-2032) | Size & Revenue, Industry, Growth, Competitive Landscape, Forecast, Segmentation, Value, Outlook, Trends, Share, Analysis, Companies
- Taiwan Food Delivery Platform Market (2026-2032) | Companies, Outlook, Analysis, Trends, Value, Revenue, Segmentation, Share, Forecast, Competitive Landscape, Growth, Size & Forecast
- United Kingdom (UK) Long-term Care Insurance Market (2026-2032) | Growth, Share, Consumer Insights, Drivers, Opportunities, Competition, Pricing Analysis, Segments, Restraints, Companies, Competitive, Value, Outlook, Size, Demand, Analysis, Challenges, Strategic Insights, Investment Trends, Revenue, Trends, Supply, Forecast
- United Kingdom (UK) Long Term Care Market (2026-2032) | Companies, Outlook, Analysis, Trends, Value, Revenue, Segmentation, Share, Forecast, Competitive Landscape, Growth, Size & Forecast
- Iraq Insulation and Waterproofing Market (2026-2032) | Outlook, Drivers, Growth, Size, Share, Industry, Revenue, Trends, Demand, Competitive, Strategic Insights, Opportunities, Segments, Companies, Challenges, Strategy, Consumer Insights, Analysis, Investment Trends, Value, Segmentation, Forecast, Restraints
- India Switchgear Market Outlook (2026-2032) | Size, Share, Trends, Growth, Revenue, Forecast, Analysis, Value, Outlook
Industry Events and Analyst Meet

India EV Show 2026

EV tech India Expo 2026

Auto Tech Asia 2026

Battery Tech India 2026

Smart Production Solutions Guangzhou 2026
Whitepaper
- Middle East & Africa Commercial Security Market Click here to view more.
- Middle East & Africa Fire Safety Systems & Equipment Market Click here to view more.
- GCC Drone Market Click here to view more.
- Middle East Lighting Fixture Market Click here to view more.
- GCC Physical & Perimeter Security Market Click here to view more.
6WResearch In News
- Doha a strategic location for EV manufacturing hub: IPA Qatar
- Demand for luxury TVs surging in the GCC, says Samsung
- Empowering Growth: The Thriving Journey of Bangladesh’s Cable Industry
- Demand for luxury TVs surging in the GCC, says Samsung
- Video call with a traditional healer? Once unthinkable, it’s now common in South Africa
- Intelligent Buildings To Smooth GCC’s Path To Net Zero