Slovenia Butylated Triphenyl Phosphate Market (2026-2032) | Growth, Outlook, Segmentation, Value, Revenue, Industry, Analysis, Forecast, Size, Companies, Trends & Share
Market Forecast By Application (Lubricants, Hydraulic Fluids, Flame Retardants) And Competitive Landscape
| Product Code: ETC5657104 | Publication Date: Nov 2023 | Updated Date: Apr 2026 | Product Type: Market Research Report | |
| Publisher: 6Wresearch | Author: Ravi Bhandari | No. of Pages: 60 | No. of Figures: 30 | No. of Tables: 5 |
Slovenia Butylated Triphenyl Phosphate Market Size (2020-2030)
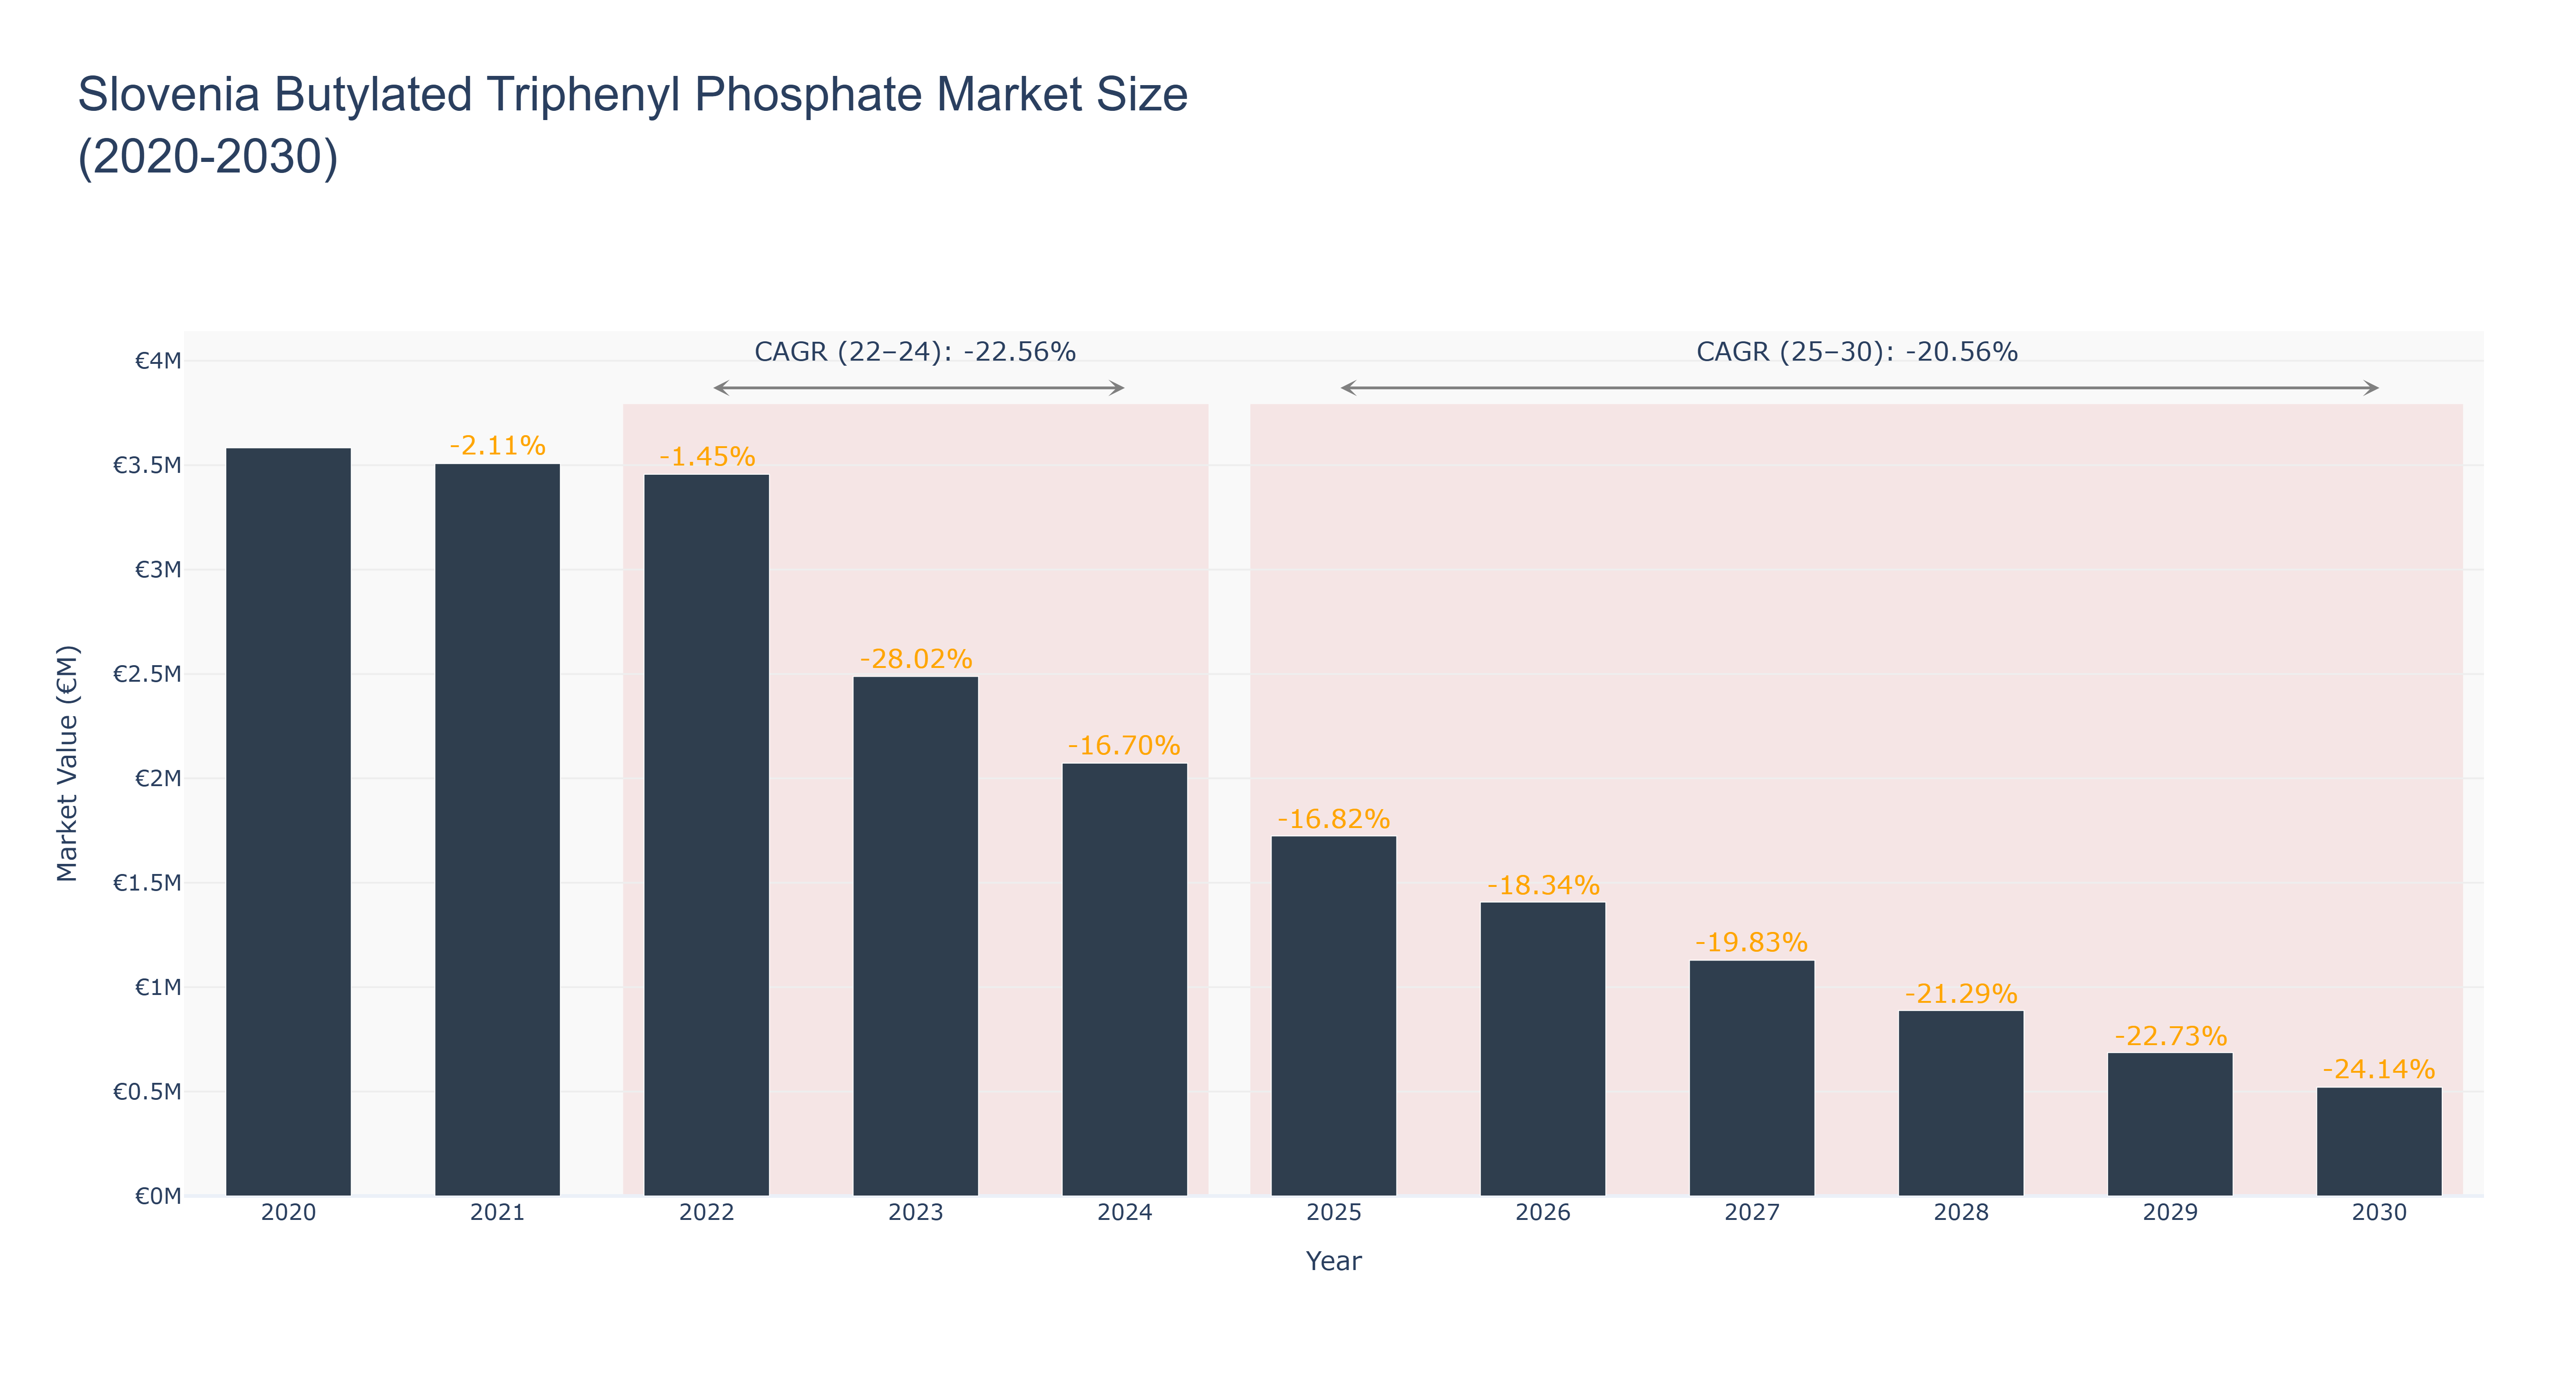
The Slovenia Butylated Triphenyl Phosphate Market experienced a peak market size of €3.58 million in 2020, followed by a steady decline over the years. The actual market size decreased to €1.72 million in 2025, with a projected further decline to €0.52 million by 2030. The CAGR for the period 2022-2024 was -22.56%, while for 2025-2030, it is estimated at -20.56%. This downward trend can be attributed to factors such as regulatory changes, shifting consumer preferences towards alternative products, and increased competition in the market. Looking ahead, the market is expected to focus on sustainability initiatives and product innovation to regain momentum. Recent developments include collaborations with research institutions to develop eco-friendly formulations, aiming to capture a niche market segment and drive future growth.
Slovenia Butylated Triphenyl Phosphate Market: Production & Trade Performance (2019-2025)
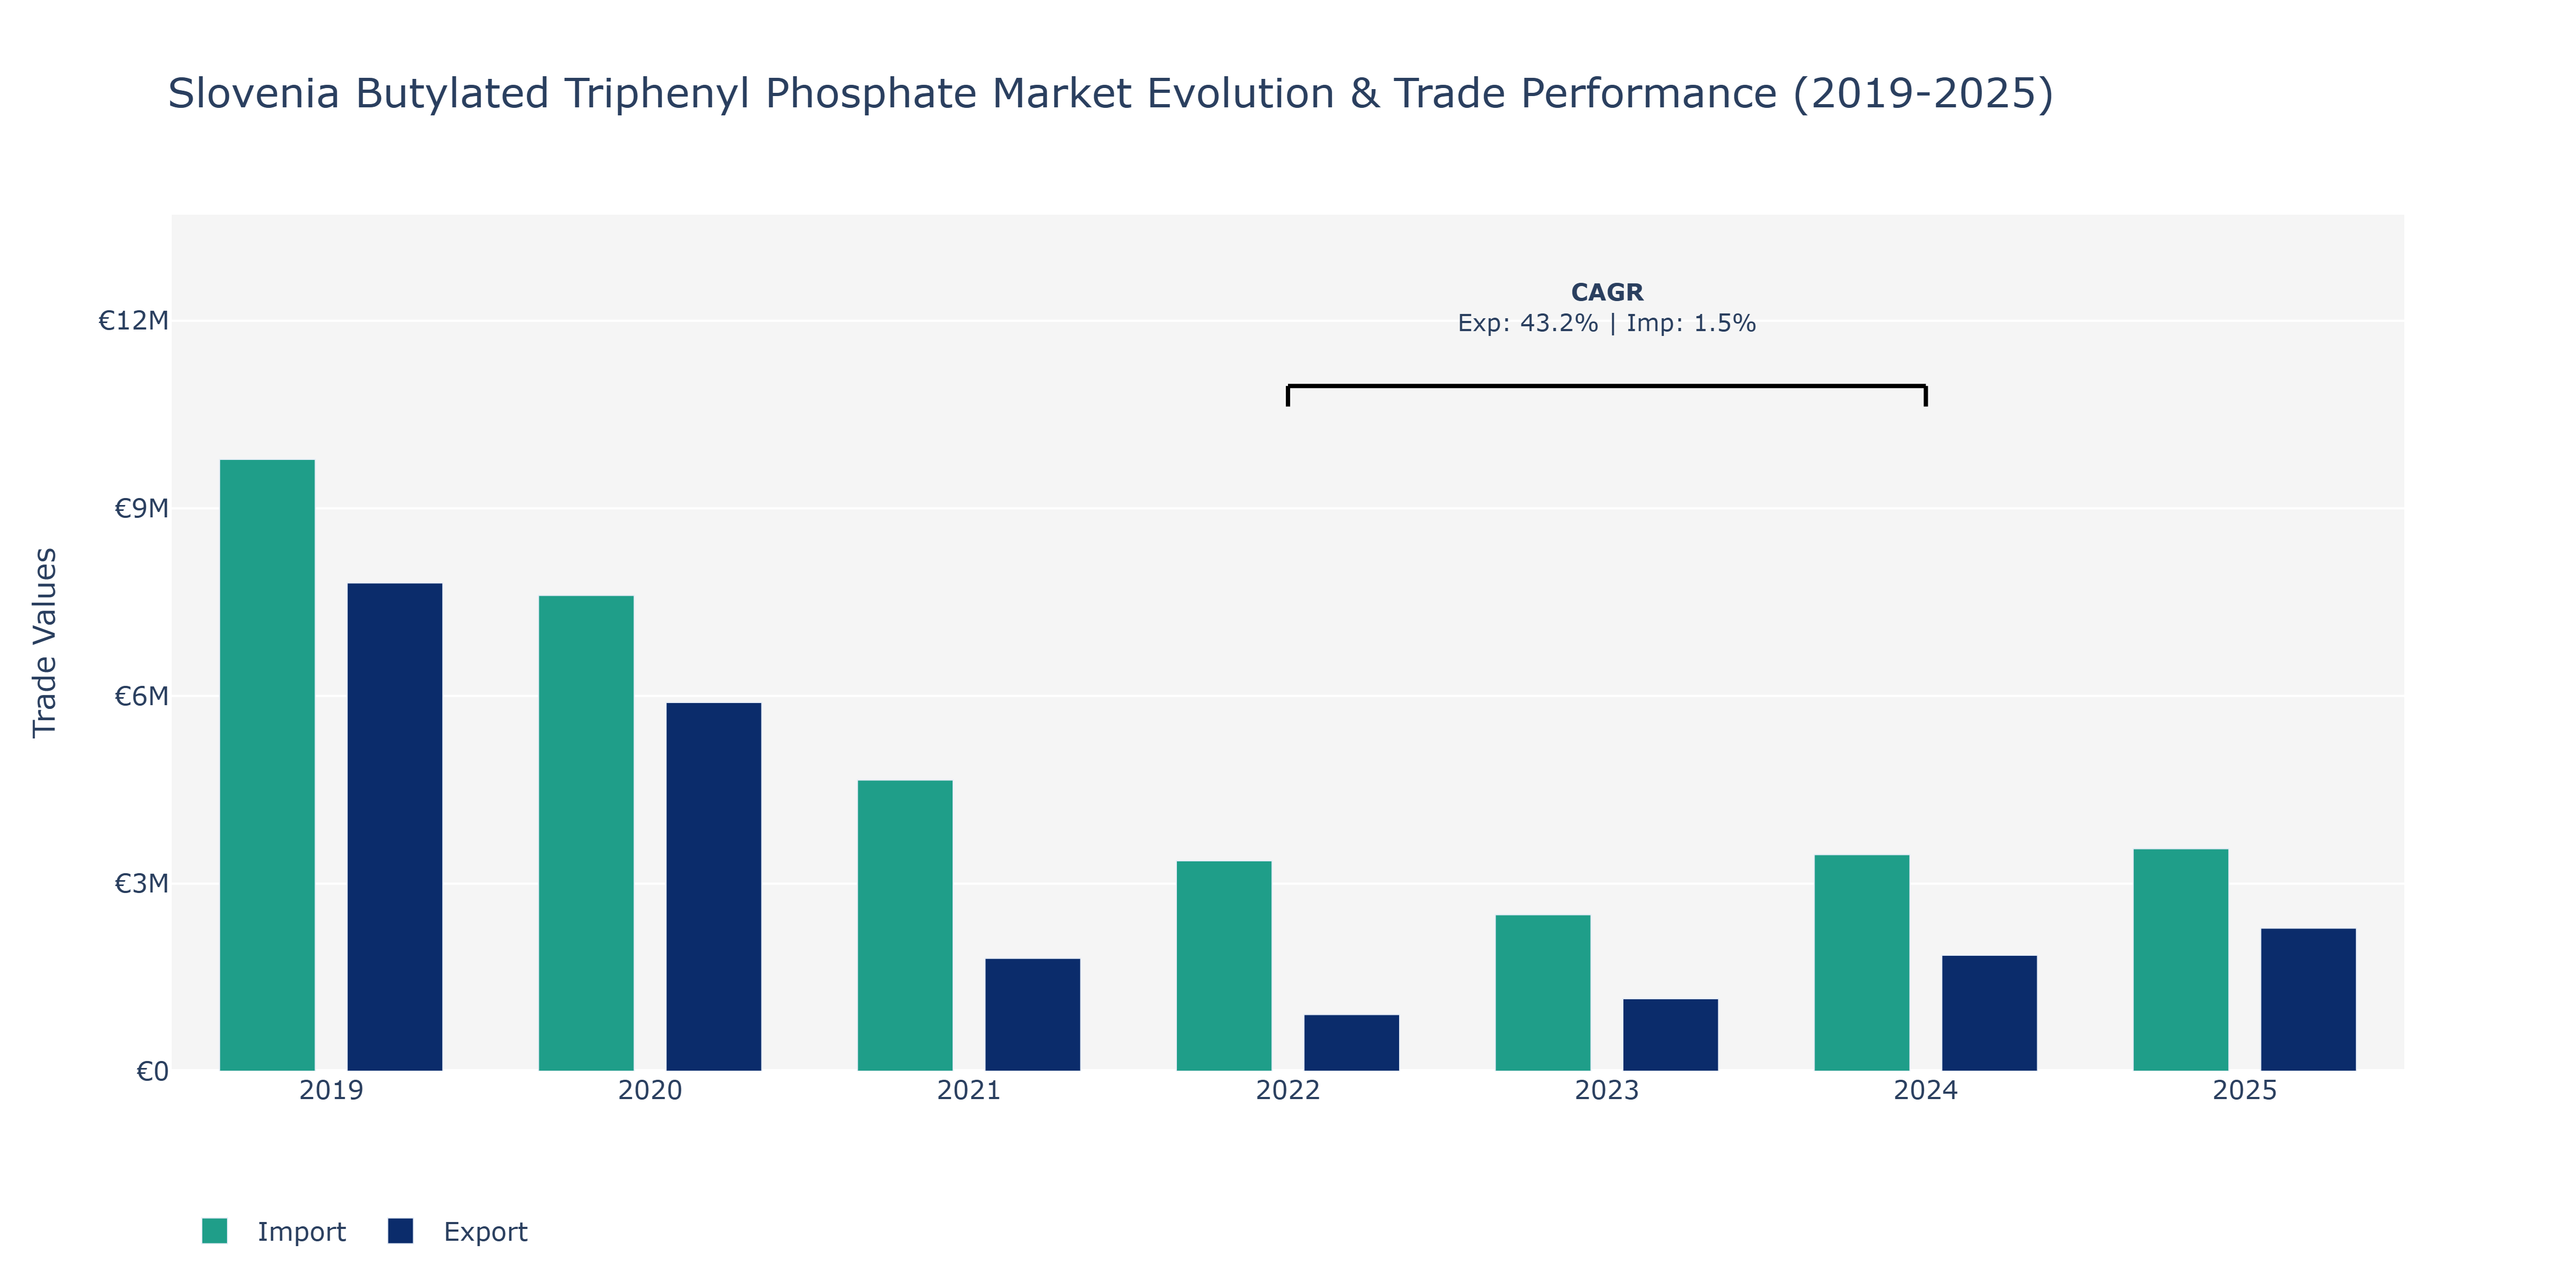
Between 2019 and 2025, Slovenia's Butylated Triphenyl Phosphate market witnessed varying trends in Exports and Imports. In 2019, Exports stood at approximately €7.81 million, dropping to about €1.81 million in 2021 before recovering slightly to €2.29 million in 2025. Imports followed a similar trajectory, decreasing from around €9.78 million in 2019 to about €2.5 million in 2023, then rising to approximately €3.56 million in 2025. The market experienced a significant drop in trade volumes in 2021, possibly due to global economic uncertainties impacting demand. The subsequent recovery in 2025 could be attributed to measures taken to stabilize the market and possibly increased demand for Butylated Triphenyl Phosphate in various industries. The CAGR for exports between 2022-2024 was notably high at 43.15%, indicating a strong growth phase for outbound shipments, possibly driven by enhanced product quality or expanded market reach within the EU. In contrast, the modest 1.45% CAGR for imports during the same period suggests a more stable and consistent pattern influenced by factors such as regulatory changes or evolving supplier relationships. The market's performance reflects a dynamic landscape influenced by both internal and external factors, necessitating a strategic approach to navigate future trade challenges and capitalize on emerging opportunities.
Key Highlights of the Report:
- Slovenia Butylated Triphenyl Phosphate Market Outlook
- Market Size of Slovenia Butylated Triphenyl Phosphate Market, 2025
- Forecast of Slovenia Butylated Triphenyl Phosphate Market, 2032
- Historical Data and Forecast of Slovenia Butylated Triphenyl Phosphate Revenues & Volume for the Period 2022-2032F
- Slovenia Butylated Triphenyl Phosphate Market Trend Evolution
- Slovenia Butylated Triphenyl Phosphate Market Drivers and Challenges
- Slovenia Butylated Triphenyl Phosphate Price Trends
- Slovenia Butylated Triphenyl Phosphate Porter`s Five Forces
- Slovenia Butylated Triphenyl Phosphate Industry Life Cycle
- Historical Data and Forecast of Slovenia Butylated Triphenyl Phosphate Market Revenues & Volume By Application for the Period 2022-2032F
- Historical Data and Forecast of Slovenia Butylated Triphenyl Phosphate Market Revenues & Volume By Lubricants for the Period 2022-2032F
- Historical Data and Forecast of Slovenia Butylated Triphenyl Phosphate Market Revenues & Volume By Hydraulic Fluids for the Period 2022-2032F
- Historical Data and Forecast of Slovenia Butylated Triphenyl Phosphate Market Revenues & Volume By Flame Retardants for the Period 2022-2032F
- Slovenia Butylated Triphenyl Phosphate Import Export Trade Statistics
- Market Opportunity Assessment By Application
- Slovenia Butylated Triphenyl Phosphate Top Companies Market Share
- Slovenia Butylated Triphenyl Phosphate Competitive Benchmarking By Technical and Operational Parameters
- Slovenia Butylated Triphenyl Phosphate Company Profiles
- Slovenia Butylated Triphenyl Phosphate Key Strategic Recommendations
Frequently Asked Questions About the Market Study (FAQs):
6Wresearch actively monitors the Slovenia Butylated Triphenyl Phosphate Market and publishes its comprehensive annual report, highlighting emerging trends, growth drivers, revenue analysis, and forecast outlook. Our insights help businesses to make data-backed strategic decisions with ongoing market dynamics. Our analysts track relevent industries related to the Slovenia Butylated Triphenyl Phosphate Market, allowing our clients with actionable intelligence and reliable forecasts tailored to emerging regional needs.
Yes, we provide customisation as per your requirements. To learn more, feel free to contact us on sales@6wresearch.com
1 Executive Summary |
2 Introduction |
2.1 Key Highlights of the Report |
2.2 Report Description |
2.3 Market Scope & Segmentation |
2.4 Research Methodology |
2.5 Assumptions |
3 Slovenia Butylated Triphenyl Phosphate Market Overview |
3.1 Slovenia Country Macro Economic Indicators |
3.2 Slovenia Butylated Triphenyl Phosphate Market Revenues & Volume, 2022 & 2032F |
3.3 Slovenia Butylated Triphenyl Phosphate Market - Industry Life Cycle |
3.4 Slovenia Butylated Triphenyl Phosphate Market - Porter's Five Forces |
3.5 Slovenia Butylated Triphenyl Phosphate Market Revenues & Volume Share, By Application, 2022 & 2032F |
4 Slovenia Butylated Triphenyl Phosphate Market Dynamics |
4.1 Impact Analysis |
4.2 Market Drivers |
4.2.1 Increasing demand for flame retardant chemicals in various industries |
4.2.2 Growing awareness about the benefits of butylated triphenyl phosphate in fire safety applications |
4.2.3 Favorable government regulations promoting the use of flame retardants |
4.3 Market Restraints |
4.3.1 Volatility in raw material prices impacting the production cost of butylated triphenyl phosphate |
4.3.2 Stringent environmental regulations regarding the use of certain chemicals |
4.3.3 Competition from alternative flame retardant products in the market |
5 Slovenia Butylated Triphenyl Phosphate Market Trends |
6 Slovenia Butylated Triphenyl Phosphate Market Segmentations |
6.1 Slovenia Butylated Triphenyl Phosphate Market, By Application |
6.1.1 Overview and Analysis |
6.1.2 Slovenia Butylated Triphenyl Phosphate Market Revenues & Volume, By Lubricants, 2022-2032F |
6.1.3 Slovenia Butylated Triphenyl Phosphate Market Revenues & Volume, By Hydraulic Fluids, 2022-2032F |
6.1.4 Slovenia Butylated Triphenyl Phosphate Market Revenues & Volume, By Flame Retardants, 2022-2032F |
7 Slovenia Butylated Triphenyl Phosphate Market Import-Export Trade Statistics |
7.1 Slovenia Butylated Triphenyl Phosphate Market Export to Major Countries |
7.2 Slovenia Butylated Triphenyl Phosphate Market Imports from Major Countries |
8 Slovenia Butylated Triphenyl Phosphate Market Key Performance Indicators |
8.1 Research and development investment in developing more efficient production processes |
8.2 Adoption rate of butylated triphenyl phosphate in key industries such as electronics, automotive, and construction |
8.3 Number of patents filed for new applications or formulations of butylated triphenyl phosphate |
9 Slovenia Butylated Triphenyl Phosphate Market - Opportunity Assessment |
9.1 Slovenia Butylated Triphenyl Phosphate Market Opportunity Assessment, By Application, 2022 & 2032F |
10 Slovenia Butylated Triphenyl Phosphate Market - Competitive Landscape |
10.1 Slovenia Butylated Triphenyl Phosphate Market Revenue Share, By Companies, 2025 |
10.2 Slovenia Butylated Triphenyl Phosphate Market Competitive Benchmarking, By Operating and Technical Parameters |
11 Company Profiles |
12 Recommendations | 13 Disclaimer |
Global Go To Market Strategy - 2030
Export potential enables firms to identify high-growth global markets with greater confidence by combining advanced trade intelligence with a structured quantitative methodology. The framework analyzes emerging demand trends and country-level import patterns while integrating macroeconomic and trade datasets such as GDP and population forecasts, bilateral import–export flows, tariff structures, elasticity differentials between developed and developing economies, geographic distance, and import demand projections. Using weighted trade values from 2020–2024 as the base period to project country-to-country export potential for 2030, these inputs are operationalized through calculated drivers such as gravity model parameters, tariff impact factors, and projected GDP per-capita growth. Through an analysis of hidden potentials, demand hotspots, and market conditions that are most favorable to success, this method enables firms to focus on target countries, maximize returns, and global expansion with data, backed by accuracy.
By factoring in the projected importer demand gap that is currently unmet and could be potential opportunity, it identifies the potential for the Exporter (Country) among 190 countries, against the general trade analysis, which identifies the biggest importer or exporter.
To discover high-growth global markets and optimize your business strategy:
Click Here
Pricing
- Single User License$ 1,995
- Department License$ 2,400
- Site License$ 3,120
- Global License$ 3,795

Leadership Perspectives from Industry Events
Search
Thought Leadership and Analyst Meet


Our Clients
6WResearch In News
- Doha a strategic location for EV manufacturing hub: IPA Qatar
- Demand for luxury TVs surging in the GCC, says Samsung
- Empowering Growth: The Thriving Journey of Bangladesh’s Cable Industry
- Demand for luxury TVs surging in the GCC, says Samsung
- Video call with a traditional healer? Once unthinkable, it’s now common in South Africa
- Intelligent Buildings To Smooth GCC’s Path To Net Zero
Latest Reports
- Taiwan Airport Wireless Infrastructure Market (2026-2032)
- Vietnam Airport Wireless Infrastructure Market (2026-2032)
- Thailand Airport Wireless Infrastructure Market (2026-2032)
- South Korea Airport Wireless Infrastructure Market (2026-2032)
- Romania Airport Wireless Infrastructure Market (2026-2032)
- Qatar Airport Wireless Infrastructure Market (2026-2032)
- Philippines Airport Wireless Infrastructure Market (2026-2032)
- Japan Airport Wireless Infrastructure Market (2026-2032)
- Taiwan Airport Winter Services Market (2026-2032)
- Vietnam Airport Winter Services Market (2026-2032)
Industry Events and Analyst Meet

HIMTEX 2026

India Refining Summit 2026

India EV Show 2026

EV tech India Expo 2026

Auto Tech Asia 2026
Whitepaper
- Middle East & Africa Commercial Security Market Click here to view more.
- Middle East & Africa Fire Safety Systems & Equipment Market Click here to view more.
- GCC Drone Market Click here to view more.
- Middle East Lighting Fixture Market Click here to view more.
- GCC Physical & Perimeter Security Market Click here to view more.