Slovenia Carbon Black Market (2026-2032) | Segmentation, Trends, Share, Value, Industry, Analysis, Outlook, Growth, Forecast, Size, Companies & Revenue
Market Forecast By Type (Furnace Black, Channel Black, Thermal Black, Acetylene Black, Others), By Grade (Standard, Specialty), By Application (Tires, High-performance Coatings, Plastics, Others) And Competitive Landscape
| Product Code: ETC4700055 | Publication Date: Nov 2023 | Updated Date: Apr 2026 | Product Type: Market Research Report | |
| Publisher: 6Wresearch | Author: Shubham Padhi | No. of Pages: 60 | No. of Figures: 30 | No. of Tables: 5 |
Slovenia Carbon Black Market Size (2020-2030)
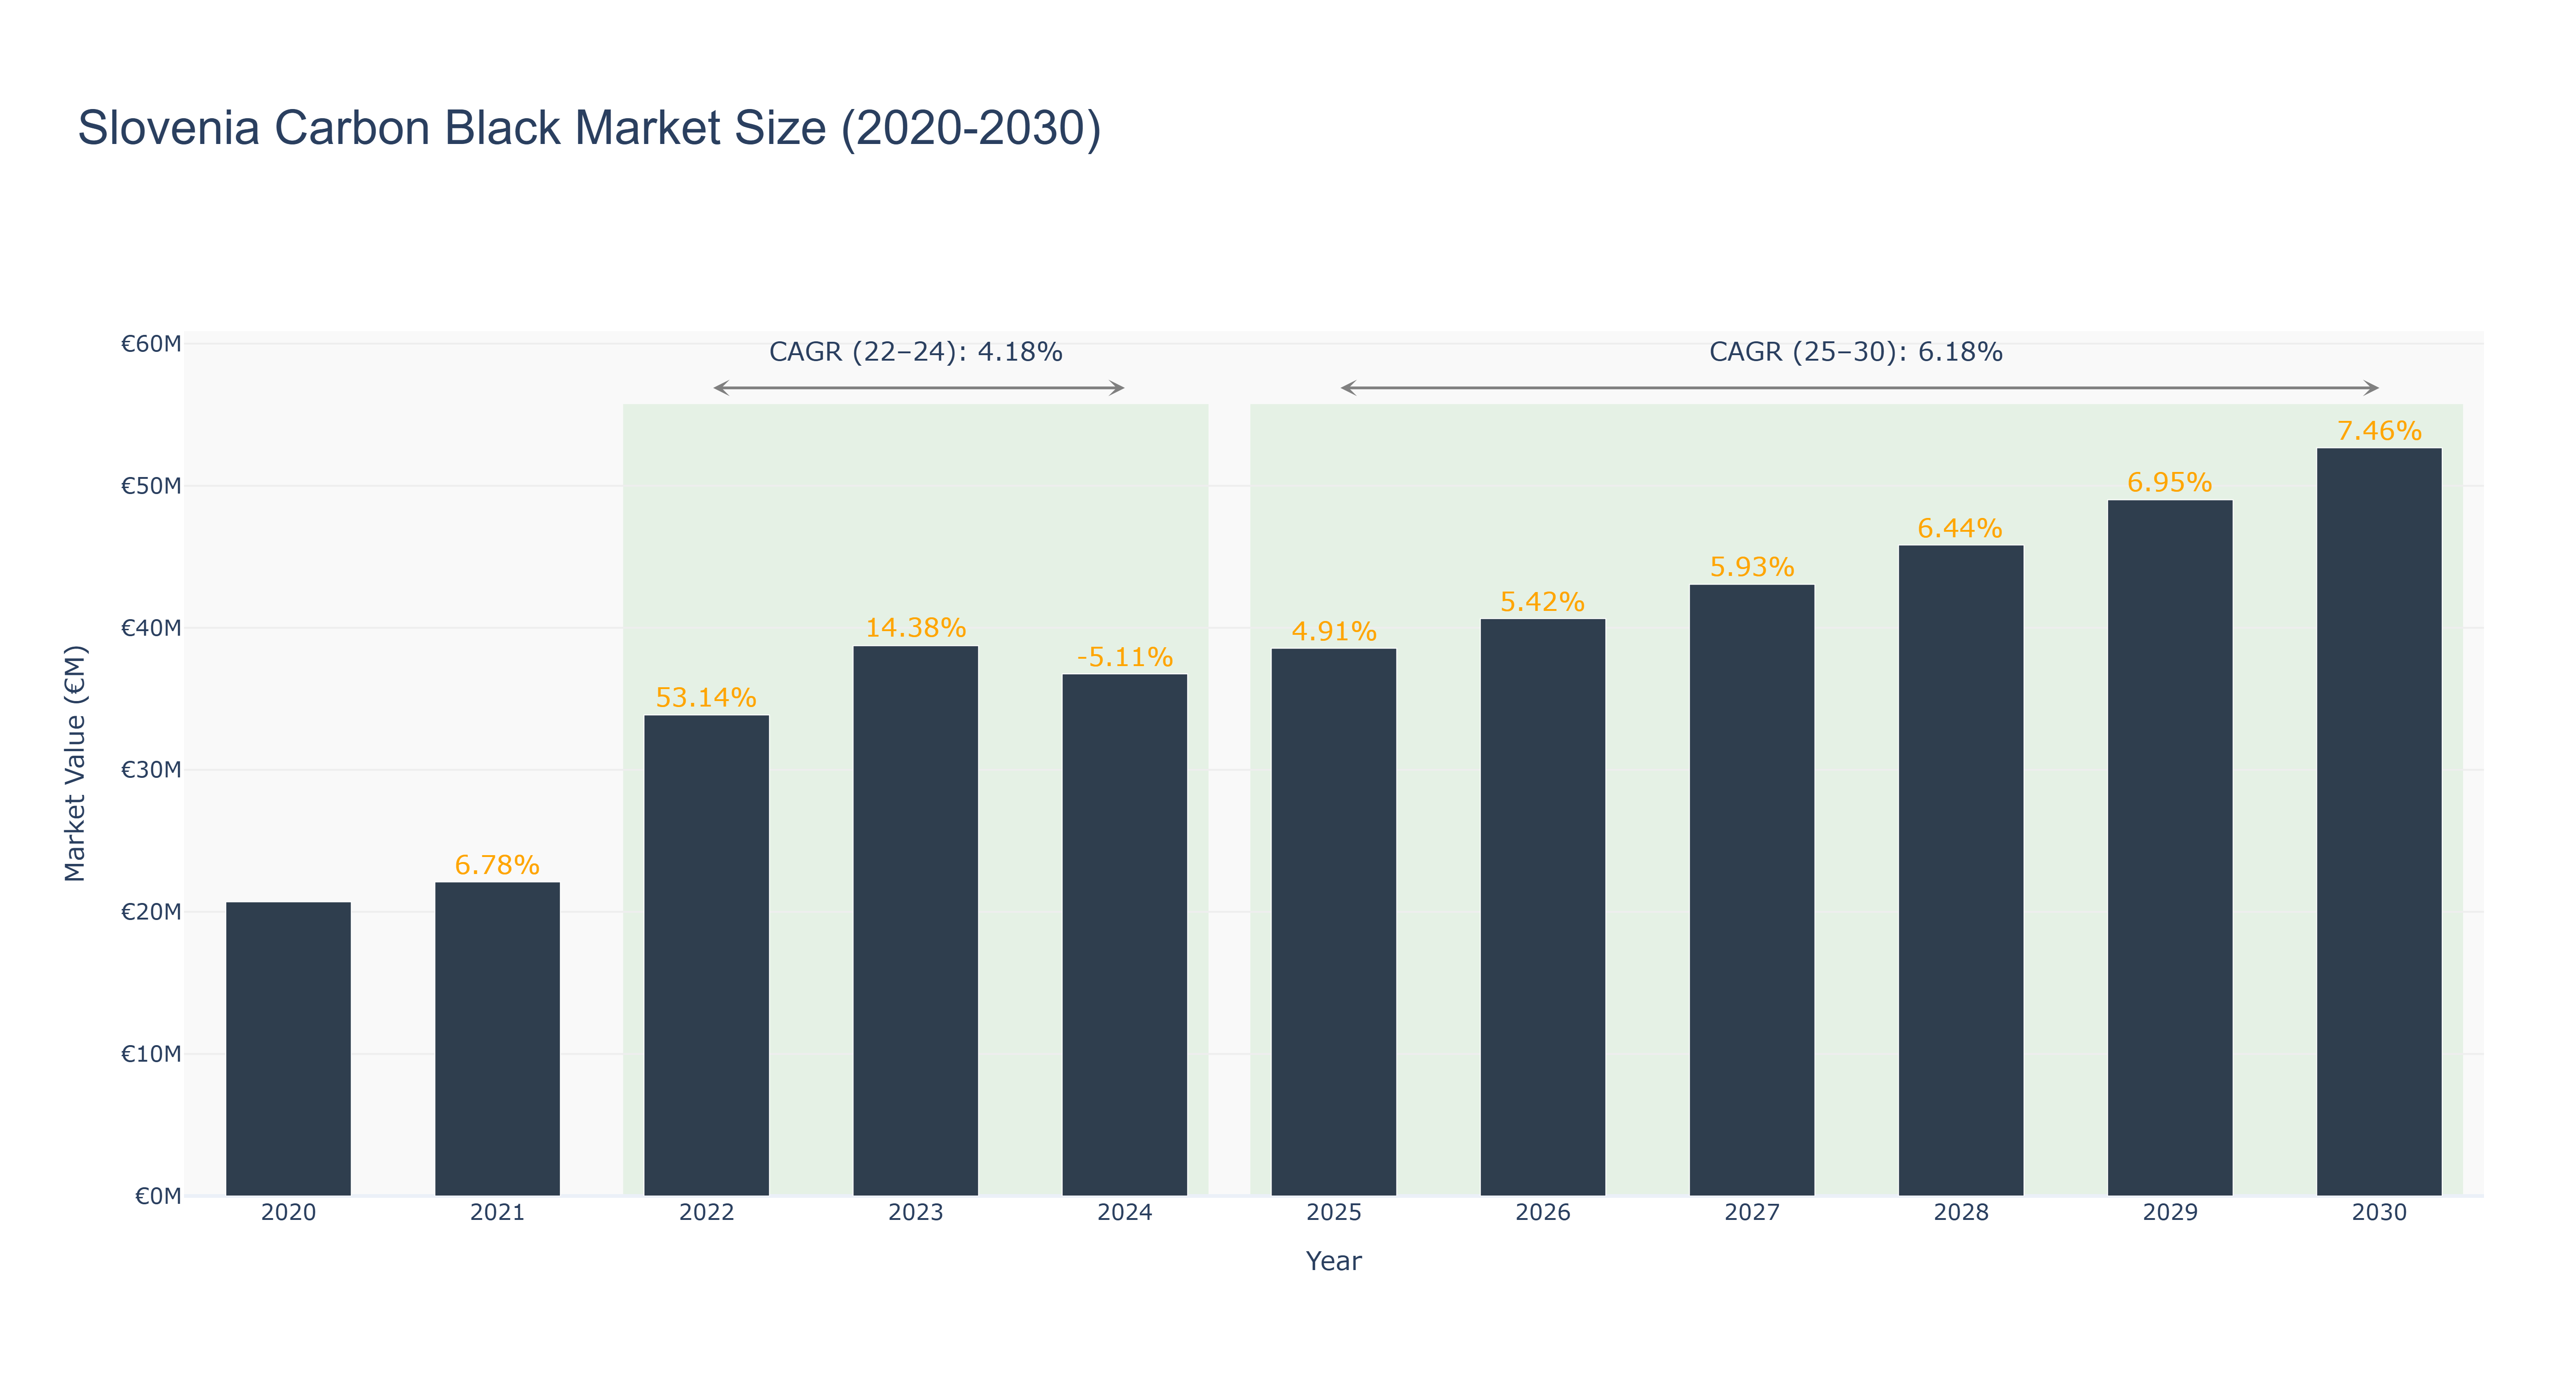
Slovenia Carbon Black Market has shown a steady growth trajectory over the years. The market peaked at €52.67 million in 2030, with a CAGR of 7.46% from 2025 to 2030. The actual market size saw fluctuations from €20.71 million in 2020 to €36.75 million in 2024, primarily influenced by global economic conditions. The forecasted growth can be attributed to increasing demand for carbon black in various industries, including automotive and construction, coupled with technological advancements. Recent developments in Slovenia's carbon black market include investments in sustainable production methods to meet environmental regulations, fostering future growth opportunities. Industry drivers such as rising urbanization and infrastructure projects are expected to further drive market expansion in the coming years.
Slovenia Carbon Black Market: Production & Trade Performance (2019-2025)
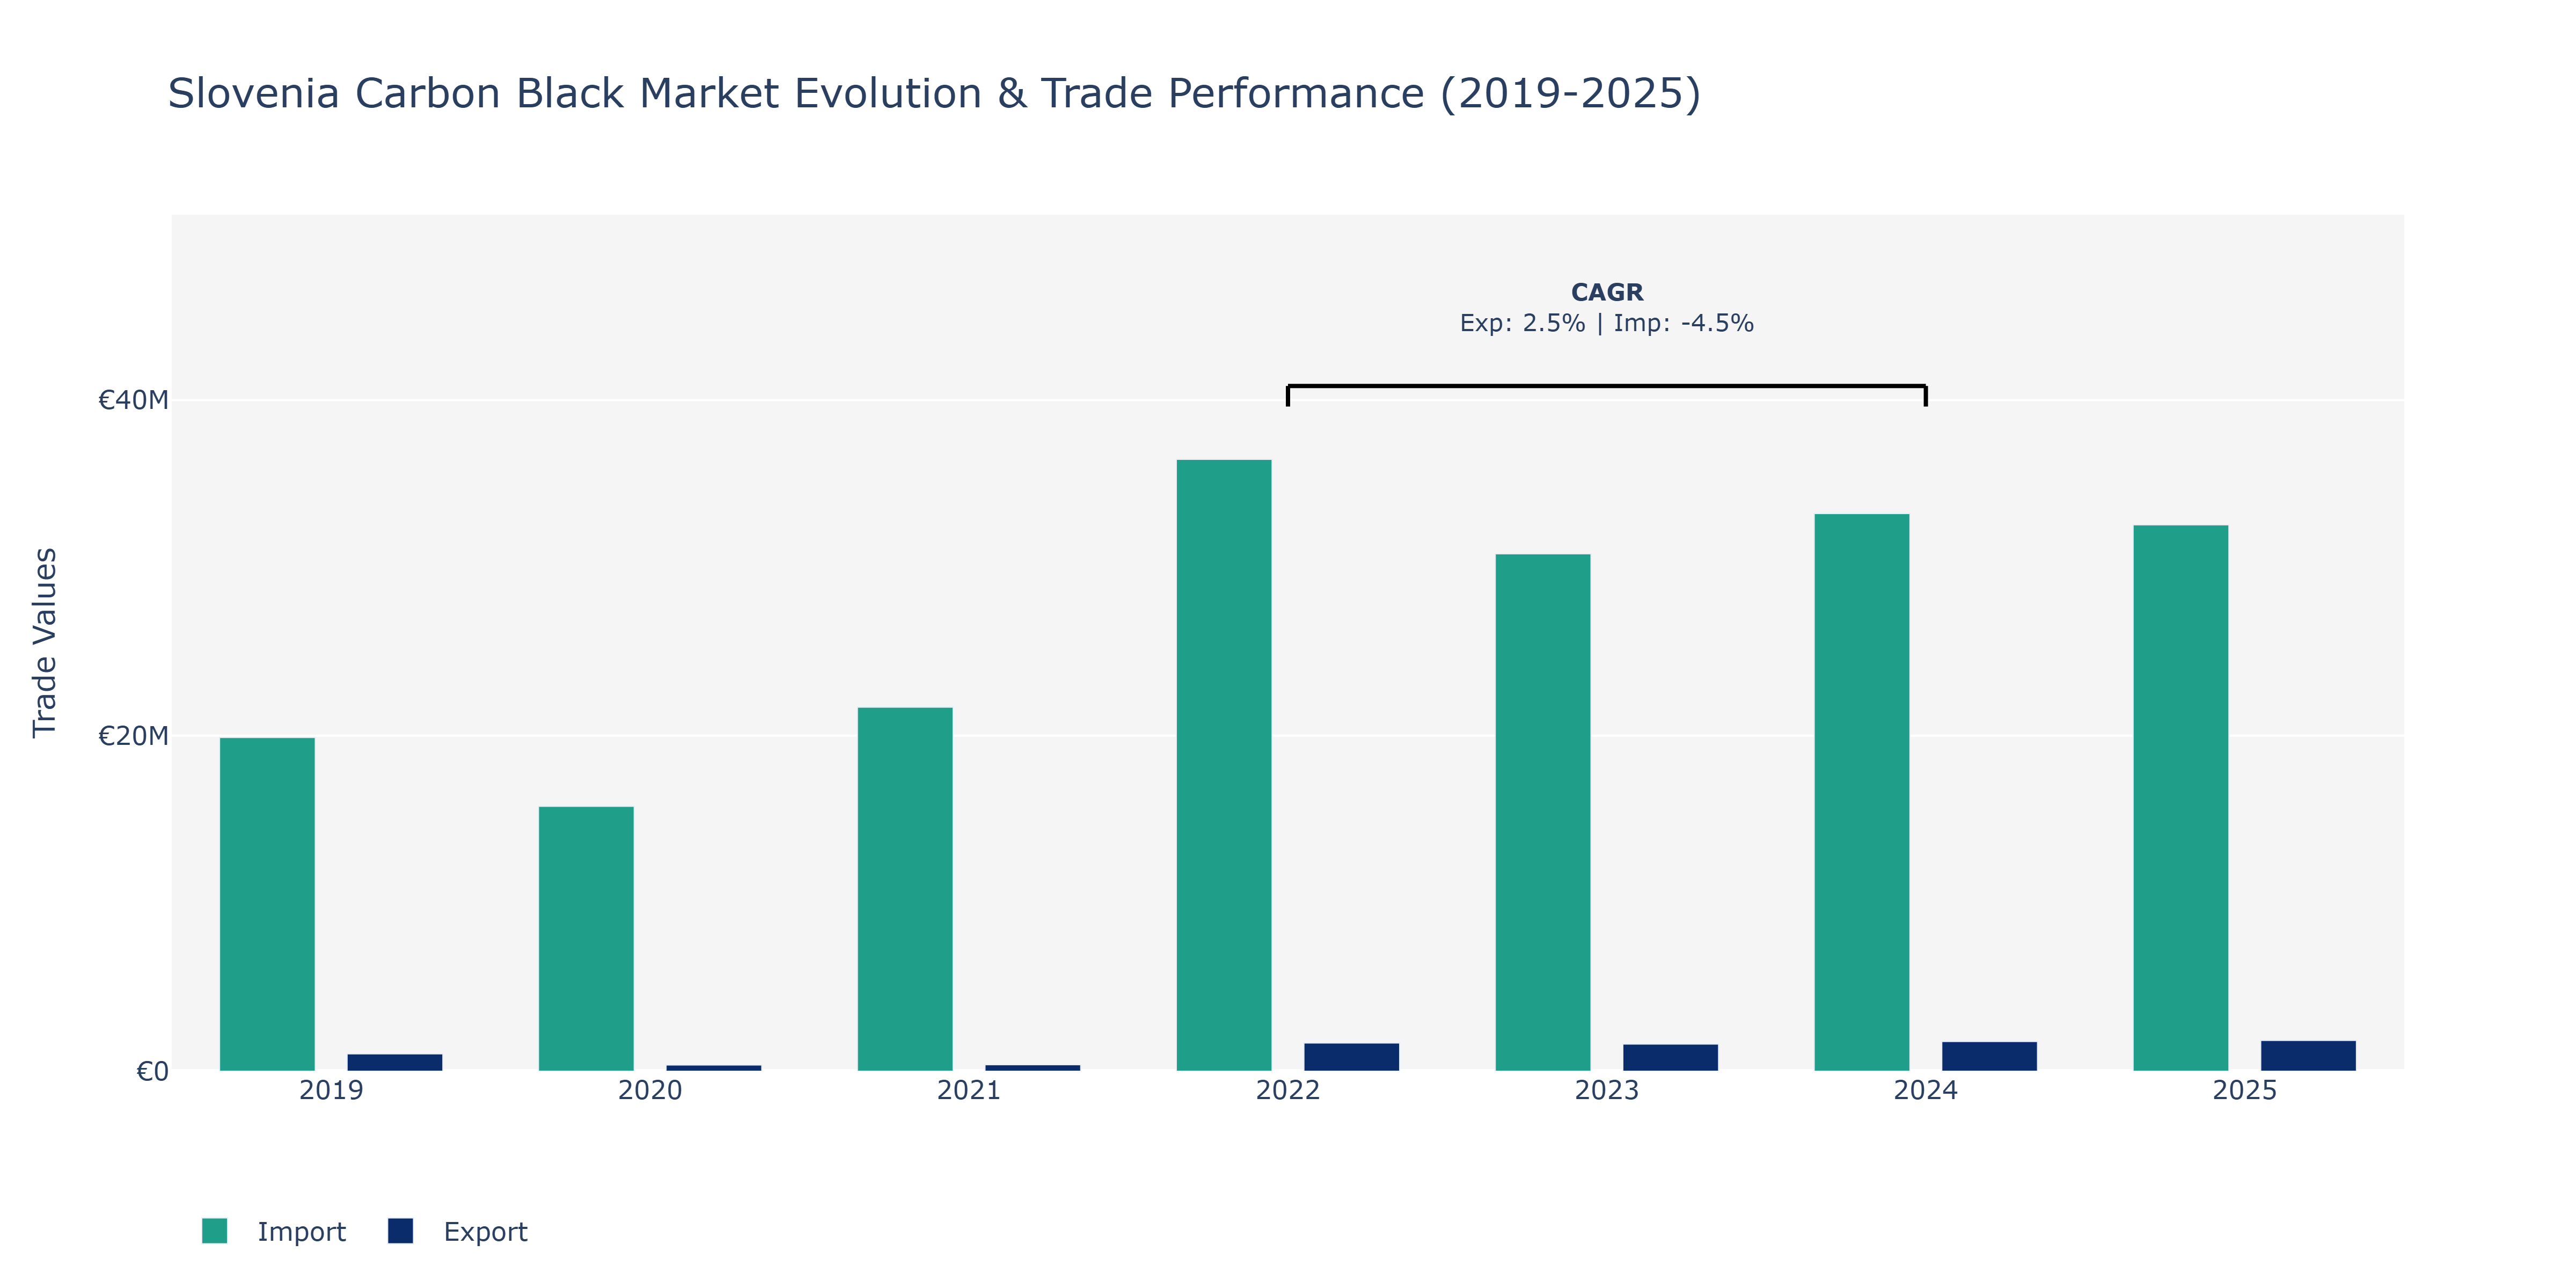
In the Slovenia Carbon Black Market, exports exhibited a fluctuating trend over the years, starting at €1.03 million in 2019, dropping to €368.79 thousand in 2020, and then gradually increasing to €1.83 million in 2025. Imports, on the other hand, followed a more stable trajectory, amounting to €19.89 million in 2019, decreasing to €15.79 million in 2020, and reaching €32.56 million by 2025. The peak points for exports and imports were observed in 2025, indicating a growing demand for carbon black products in Slovenia. The significant fluctuations in exports can be attributed to global market dynamics, including changes in demand from key industries like automotive and manufacturing. The steady increase in imports suggests a consistent need for raw materials to support various domestic sectors, reflecting Slovenia's reliance on international trade for meeting industrial requirements.
Key Highlights of the Report:
- Slovenia Carbon Black Market Outlook
- Market Size of Slovenia Carbon Black Market, 2025
- Forecast of Slovenia Carbon Black Market, 2032
- Historical Data and Forecast of Slovenia Carbon Black Revenues & Volume for the Period 2022-2032F
- Slovenia Carbon Black Market Trend Evolution
- Slovenia Carbon Black Market Drivers and Challenges
- Slovenia Carbon Black Price Trends
- Slovenia Carbon Black Porter`s Five Forces
- Slovenia Carbon Black Industry Life Cycle
- Historical Data and Forecast of Slovenia Carbon Black Market Revenues & Volume By Type for the Period 2022-2032F
- Historical Data and Forecast of Slovenia Carbon Black Market Revenues & Volume By Furnace Black for the Period 2022-2032F
- Historical Data and Forecast of Slovenia Carbon Black Market Revenues & Volume By Channel Black for the Period 2022-2032F
- Historical Data and Forecast of Slovenia Carbon Black Market Revenues & Volume By Thermal Black for the Period 2022-2032F
- Historical Data and Forecast of Slovenia Carbon Black Market Revenues & Volume By Acetylene Black for the Period 2022-2032F
- Historical Data and Forecast of Slovenia Carbon Black Market Revenues & Volume By Others for the Period 2022-2032F
- Historical Data and Forecast of Slovenia Carbon Black Market Revenues & Volume By Grade for the Period 2022-2032F
- Historical Data and Forecast of Slovenia Carbon Black Market Revenues & Volume By Standard for the Period 2022-2032F
- Historical Data and Forecast of Slovenia Carbon Black Market Revenues & Volume By Specialty for the Period 2022-2032F
- Historical Data and Forecast of Slovenia Carbon Black Market Revenues & Volume By Application for the Period 2022-2032F
- Historical Data and Forecast of Slovenia Carbon Black Market Revenues & Volume By Tires for the Period 2022-2032F
- Historical Data and Forecast of Slovenia Carbon Black Market Revenues & Volume By High-performance Coatings for the Period 2022-2032F
- Historical Data and Forecast of Slovenia Carbon Black Market Revenues & Volume By Plastics for the Period 2022-2032F
- Historical Data and Forecast of Slovenia Carbon Black Market Revenues & Volume By Others for the Period 2022-2032F
- Slovenia Carbon Black Import Export Trade Statistics
- Market Opportunity Assessment By Type
- Market Opportunity Assessment By Grade
- Market Opportunity Assessment By Application
- Slovenia Carbon Black Top Companies Market Share
- Slovenia Carbon Black Competitive Benchmarking By Technical and Operational Parameters
- Slovenia Carbon Black Company Profiles
- Slovenia Carbon Black Key Strategic Recommendations
Frequently Asked Questions About the Market Study (FAQs):
6Wresearch actively monitors the Slovenia Carbon Black Market and publishes its comprehensive annual report, highlighting emerging trends, growth drivers, revenue analysis, and forecast outlook. Our insights help businesses to make data-backed strategic decisions with ongoing market dynamics. Our analysts track relevent industries related to the Slovenia Carbon Black Market, allowing our clients with actionable intelligence and reliable forecasts tailored to emerging regional needs.
Yes, we provide customisation as per your requirements. To learn more, feel free to contact us on sales@6wresearch.com
1 Executive Summary |
2 Introduction |
2.1 Key Highlights of the Report |
2.2 Report Description |
2.3 Market Scope & Segmentation |
2.4 Research Methodology |
2.5 Assumptions |
3 Slovenia Carbon Black Market Overview |
3.1 Slovenia Country Macro Economic Indicators |
3.2 Slovenia Carbon Black Market Revenues & Volume, 2022 & 2032F |
3.3 Slovenia Carbon Black Market - Industry Life Cycle |
3.4 Slovenia Carbon Black Market - Porter's Five Forces |
3.5 Slovenia Carbon Black Market Revenues & Volume Share, By Type, 2022 & 2032F |
3.6 Slovenia Carbon Black Market Revenues & Volume Share, By Grade, 2022 & 2032F |
3.7 Slovenia Carbon Black Market Revenues & Volume Share, By Application, 2022 & 2032F |
4 Slovenia Carbon Black Market Dynamics |
4.1 Impact Analysis |
4.2 Market Drivers |
4.2.1 Growth in the automotive industry in Slovenia, leading to increased demand for carbon black in tire manufacturing. |
4.2.2 Growing construction sector in Slovenia, driving the demand for carbon black in construction materials. |
4.2.3 Increasing focus on sustainable practices and environmental regulations, leading to the use of carbon black in eco-friendly products. |
4.3 Market Restraints |
4.3.1 Fluctuating raw material prices impacting the production cost of carbon black. |
4.3.2 Competition from alternative materials affecting the market share of carbon black products. |
4.3.3 Economic uncertainties and market volatility impacting the overall demand for carbon black in Slovenia. |
5 Slovenia Carbon Black Market Trends |
6 Slovenia Carbon Black Market Segmentations |
6.1 Slovenia Carbon Black Market, By Type |
6.1.1 Overview and Analysis |
6.1.2 Slovenia Carbon Black Market Revenues & Volume, By Furnace Black, 2022-2032F |
6.1.3 Slovenia Carbon Black Market Revenues & Volume, By Channel Black, 2022-2032F |
6.1.4 Slovenia Carbon Black Market Revenues & Volume, By Thermal Black, 2022-2032F |
6.1.5 Slovenia Carbon Black Market Revenues & Volume, By Acetylene Black, 2022-2032F |
6.1.6 Slovenia Carbon Black Market Revenues & Volume, By Others, 2022-2032F |
6.2 Slovenia Carbon Black Market, By Grade |
6.2.1 Overview and Analysis |
6.2.2 Slovenia Carbon Black Market Revenues & Volume, By Standard, 2022-2032F |
6.2.3 Slovenia Carbon Black Market Revenues & Volume, By Specialty, 2022-2032F |
6.3 Slovenia Carbon Black Market, By Application |
6.3.1 Overview and Analysis |
6.3.2 Slovenia Carbon Black Market Revenues & Volume, By Tires, 2022-2032F |
6.3.3 Slovenia Carbon Black Market Revenues & Volume, By High-performance Coatings, 2022-2032F |
6.3.4 Slovenia Carbon Black Market Revenues & Volume, By Plastics, 2022-2032F |
6.3.5 Slovenia Carbon Black Market Revenues & Volume, By Others, 2022-2032F |
7 Slovenia Carbon Black Market Import-Export Trade Statistics |
7.1 Slovenia Carbon Black Market Export to Major Countries |
7.2 Slovenia Carbon Black Market Imports from Major Countries |
8 Slovenia Carbon Black Market Key Performance Indicators |
8.1 Environmental regulations compliance rate for carbon black manufacturers. |
8.2 Adoption rate of carbon black in new product development across industries. |
8.3 Investment in research and development for innovative applications of carbon black in Slovenia. |
9 Slovenia Carbon Black Market - Opportunity Assessment |
9.1 Slovenia Carbon Black Market Opportunity Assessment, By Type, 2022 & 2032F |
9.2 Slovenia Carbon Black Market Opportunity Assessment, By Grade, 2022 & 2032F |
9.3 Slovenia Carbon Black Market Opportunity Assessment, By Application, 2022 & 2032F |
10 Slovenia Carbon Black Market - Competitive Landscape |
10.1 Slovenia Carbon Black Market Revenue Share, By Companies, 2025 |
10.2 Slovenia Carbon Black Market Competitive Benchmarking, By Operating and Technical Parameters |
11 Company Profiles |
12 Recommendations | 13 Disclaimer |
Global Go To Market Strategy - 2030
Export potential enables firms to identify high-growth global markets with greater confidence by combining advanced trade intelligence with a structured quantitative methodology. The framework analyzes emerging demand trends and country-level import patterns while integrating macroeconomic and trade datasets such as GDP and population forecasts, bilateral import–export flows, tariff structures, elasticity differentials between developed and developing economies, geographic distance, and import demand projections. Using weighted trade values from 2020–2024 as the base period to project country-to-country export potential for 2030, these inputs are operationalized through calculated drivers such as gravity model parameters, tariff impact factors, and projected GDP per-capita growth. Through an analysis of hidden potentials, demand hotspots, and market conditions that are most favorable to success, this method enables firms to focus on target countries, maximize returns, and global expansion with data, backed by accuracy.
By factoring in the projected importer demand gap that is currently unmet and could be potential opportunity, it identifies the potential for the Exporter (Country) among 190 countries, against the general trade analysis, which identifies the biggest importer or exporter.
To discover high-growth global markets and optimize your business strategy:
Click Here
Pricing
- Single User License$ 1,995
- Department License$ 2,400
- Site License$ 3,120
- Global License$ 3,795

Leadership Perspectives from Industry Events
Search
Thought Leadership and Analyst Meet


Our Clients
6WResearch In News
- Doha a strategic location for EV manufacturing hub: IPA Qatar
- Demand for luxury TVs surging in the GCC, says Samsung
- Empowering Growth: The Thriving Journey of Bangladesh’s Cable Industry
- Demand for luxury TVs surging in the GCC, says Samsung
- Video call with a traditional healer? Once unthinkable, it’s now common in South Africa
- Intelligent Buildings To Smooth GCC’s Path To Net Zero
Latest Reports
- Taiwan Airport Wireless Infrastructure Market (2026-2032)
- Vietnam Airport Wireless Infrastructure Market (2026-2032)
- Thailand Airport Wireless Infrastructure Market (2026-2032)
- South Korea Airport Wireless Infrastructure Market (2026-2032)
- Romania Airport Wireless Infrastructure Market (2026-2032)
- Qatar Airport Wireless Infrastructure Market (2026-2032)
- Philippines Airport Wireless Infrastructure Market (2026-2032)
- Japan Airport Wireless Infrastructure Market (2026-2032)
- Taiwan Airport Winter Services Market (2026-2032)
- Vietnam Airport Winter Services Market (2026-2032)
Industry Events and Analyst Meet

HIMTEX 2026

India Refining Summit 2026

India EV Show 2026

EV tech India Expo 2026

Auto Tech Asia 2026
Whitepaper
- Middle East & Africa Commercial Security Market Click here to view more.
- Middle East & Africa Fire Safety Systems & Equipment Market Click here to view more.
- GCC Drone Market Click here to view more.
- Middle East Lighting Fixture Market Click here to view more.
- GCC Physical & Perimeter Security Market Click here to view more.