Slovenia Cocoa butter Market (2026-2032) | Growth, Value, Companies, Share, Revenue, Size, Forecast, Segmentation, Trends, Outlook, Analysis & Industry
Market Forecast By Types (organic, conventional, deodorized), By Form (solid, Liquid), By End-user (Food Industry, Pharmaceutical Industry, Aromatherapy, Cosmetics, Personal Care Industry), By Packaging (Tins, Cartons, Plastic Containers, Paper Containers, Others), By Distribution Channel (Direct Sales, Indirect Sales) And Competitive Landscape
| Product Code: ETC4711493 | Publication Date: Nov 2023 | Updated Date: Apr 2026 | Product Type: Market Research Report | |
| Publisher: 6Wresearch | Author: Shubham Padhi | No. of Pages: 60 | No. of Figures: 30 | No. of Tables: 5 |
Slovenia Cocoa Butter Market Size (2020-2030)
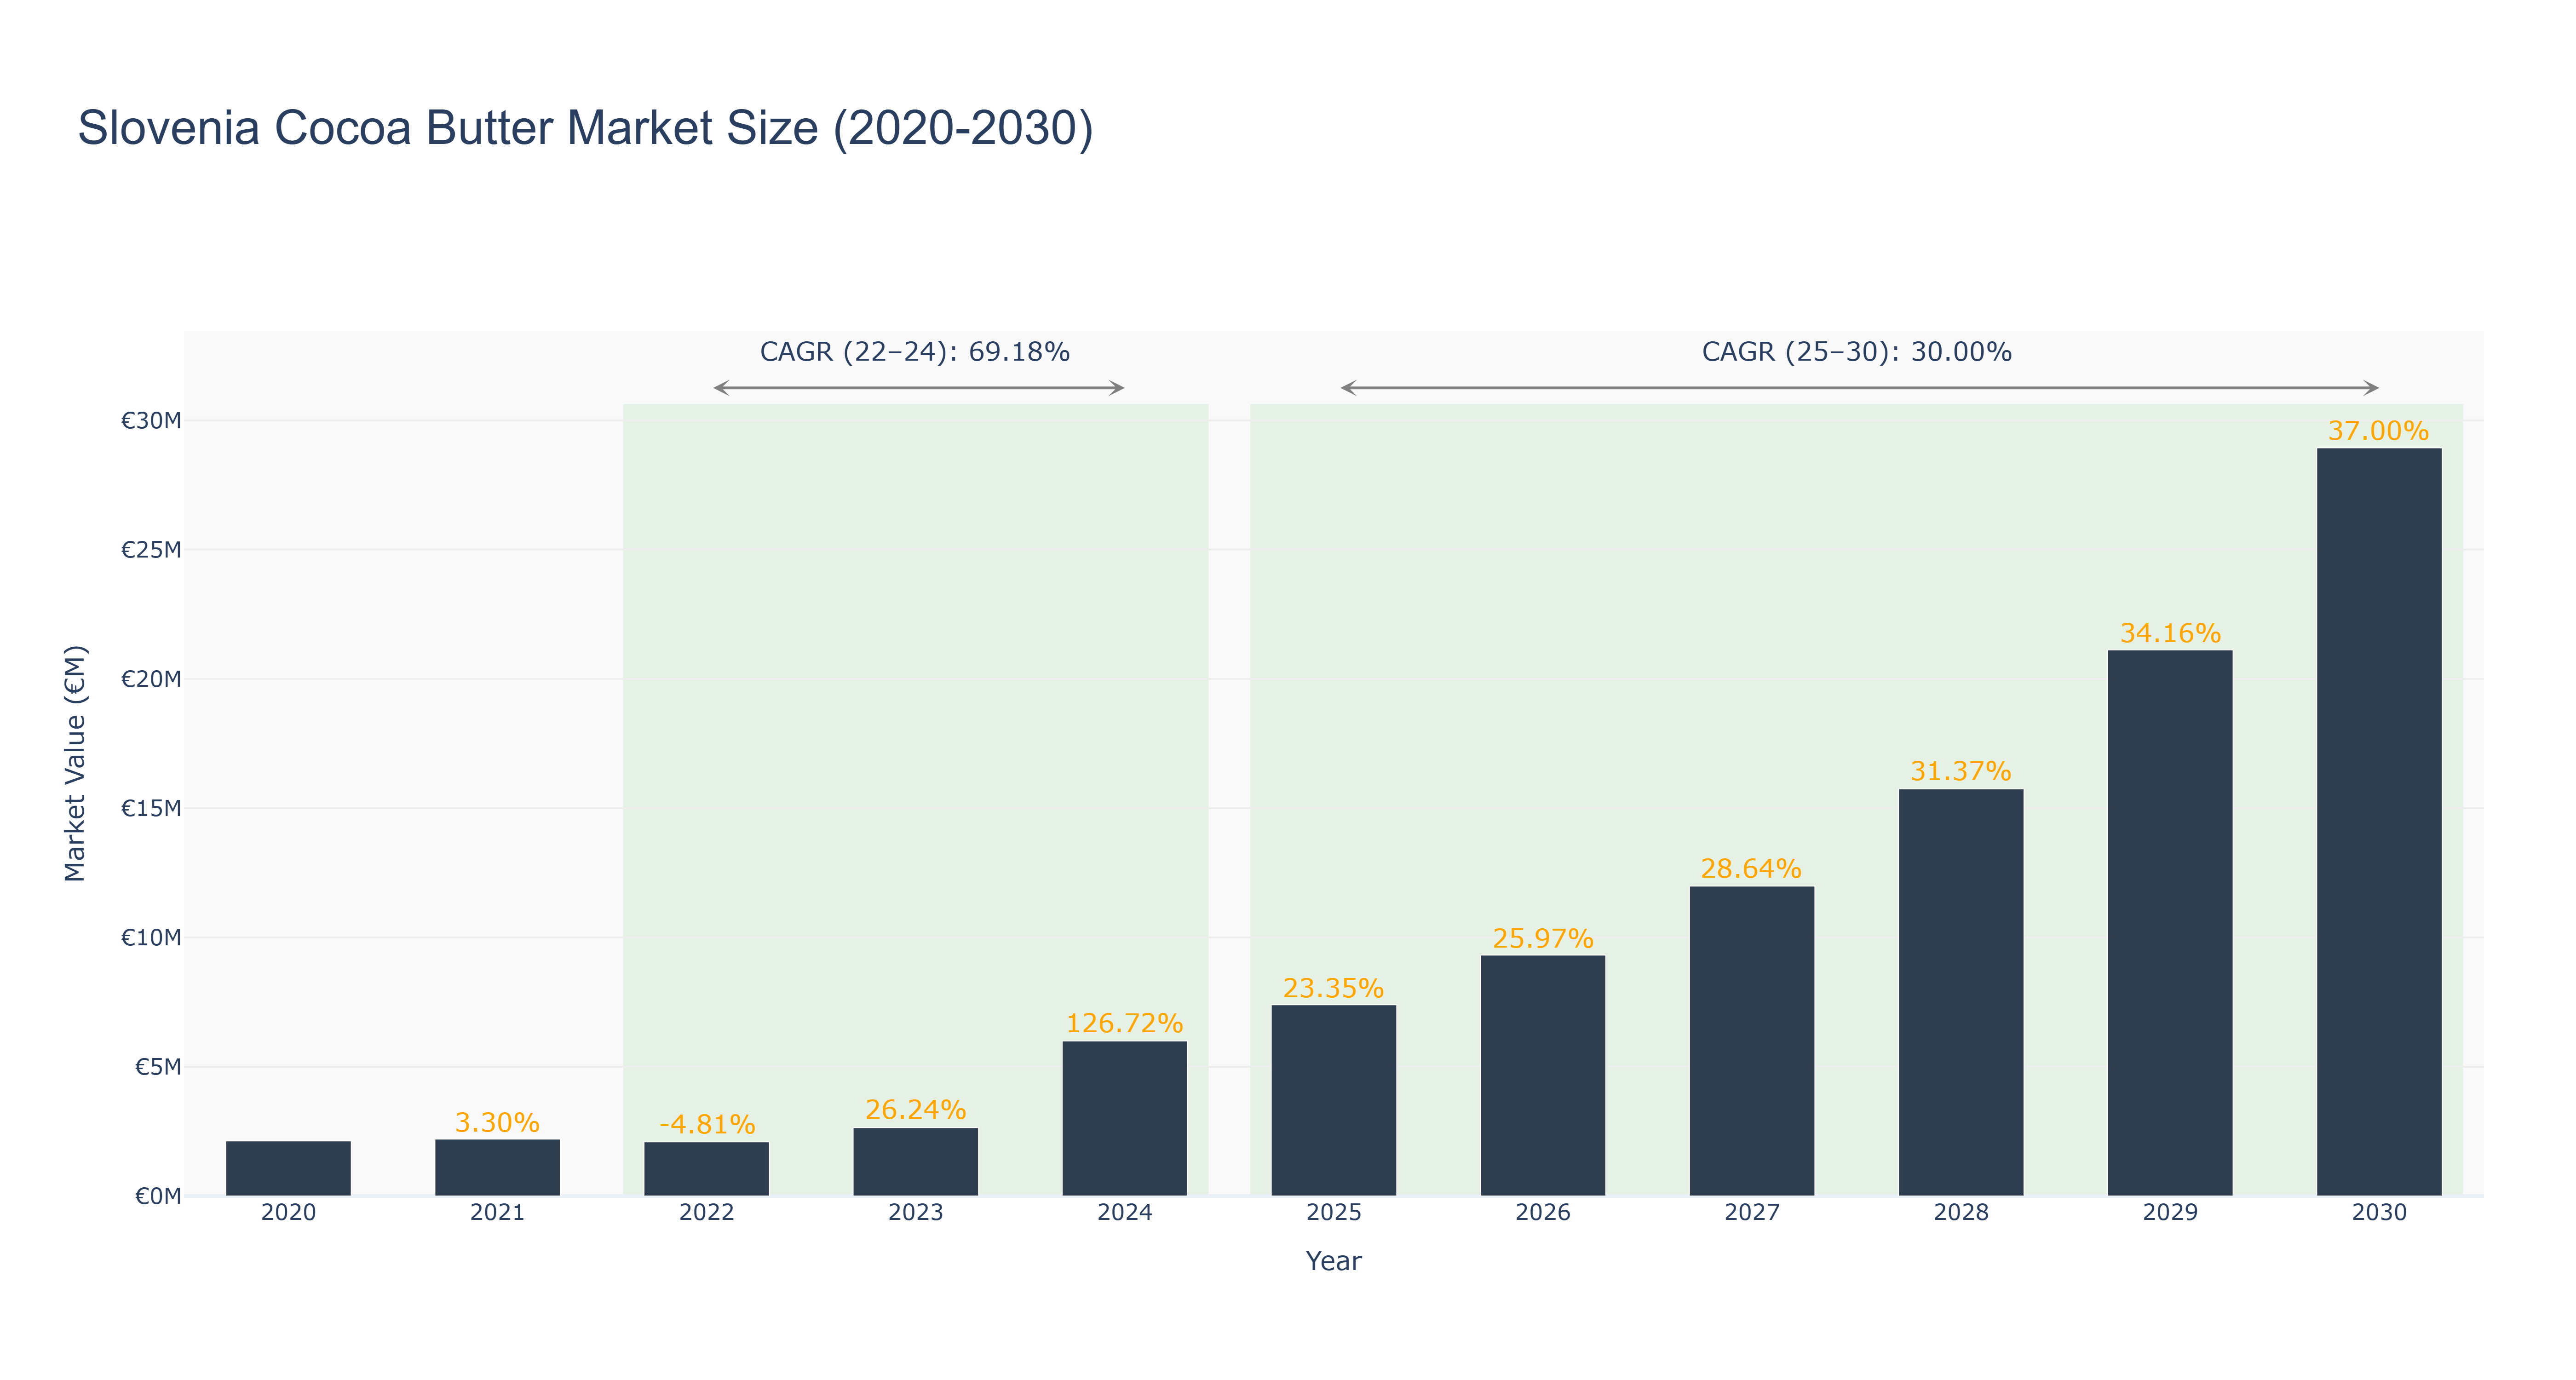
Slovenia Cocoa Butter Market has shown a remarkable growth trajectory over the years. The market size surged from €2.13 million in 2020 to €28.94 million in 2030, with a notable peak in 2029. The CAGR for the period 2022-24 stood at an impressive 69.18%, while for 2025-30 it is projected at 30.0%. The market witnessed a significant growth spurt between 2024 and 2025, attributed to increased consumer demand for organic and natural skincare products, where cocoa butter plays a vital role. Looking ahead, Slovenia is gearing up for new investments in sustainable cocoa farming practices to ensure a stable supply chain for cocoa butter production. This strategic move aligns with the industry drivers focusing on eco-friendly and ethically sourced ingredients, positioning Slovenia as a key player in the global cocoa butter market.
Slovenia Cocoa Butter Market: Production & Trade Performance (2019-2025)
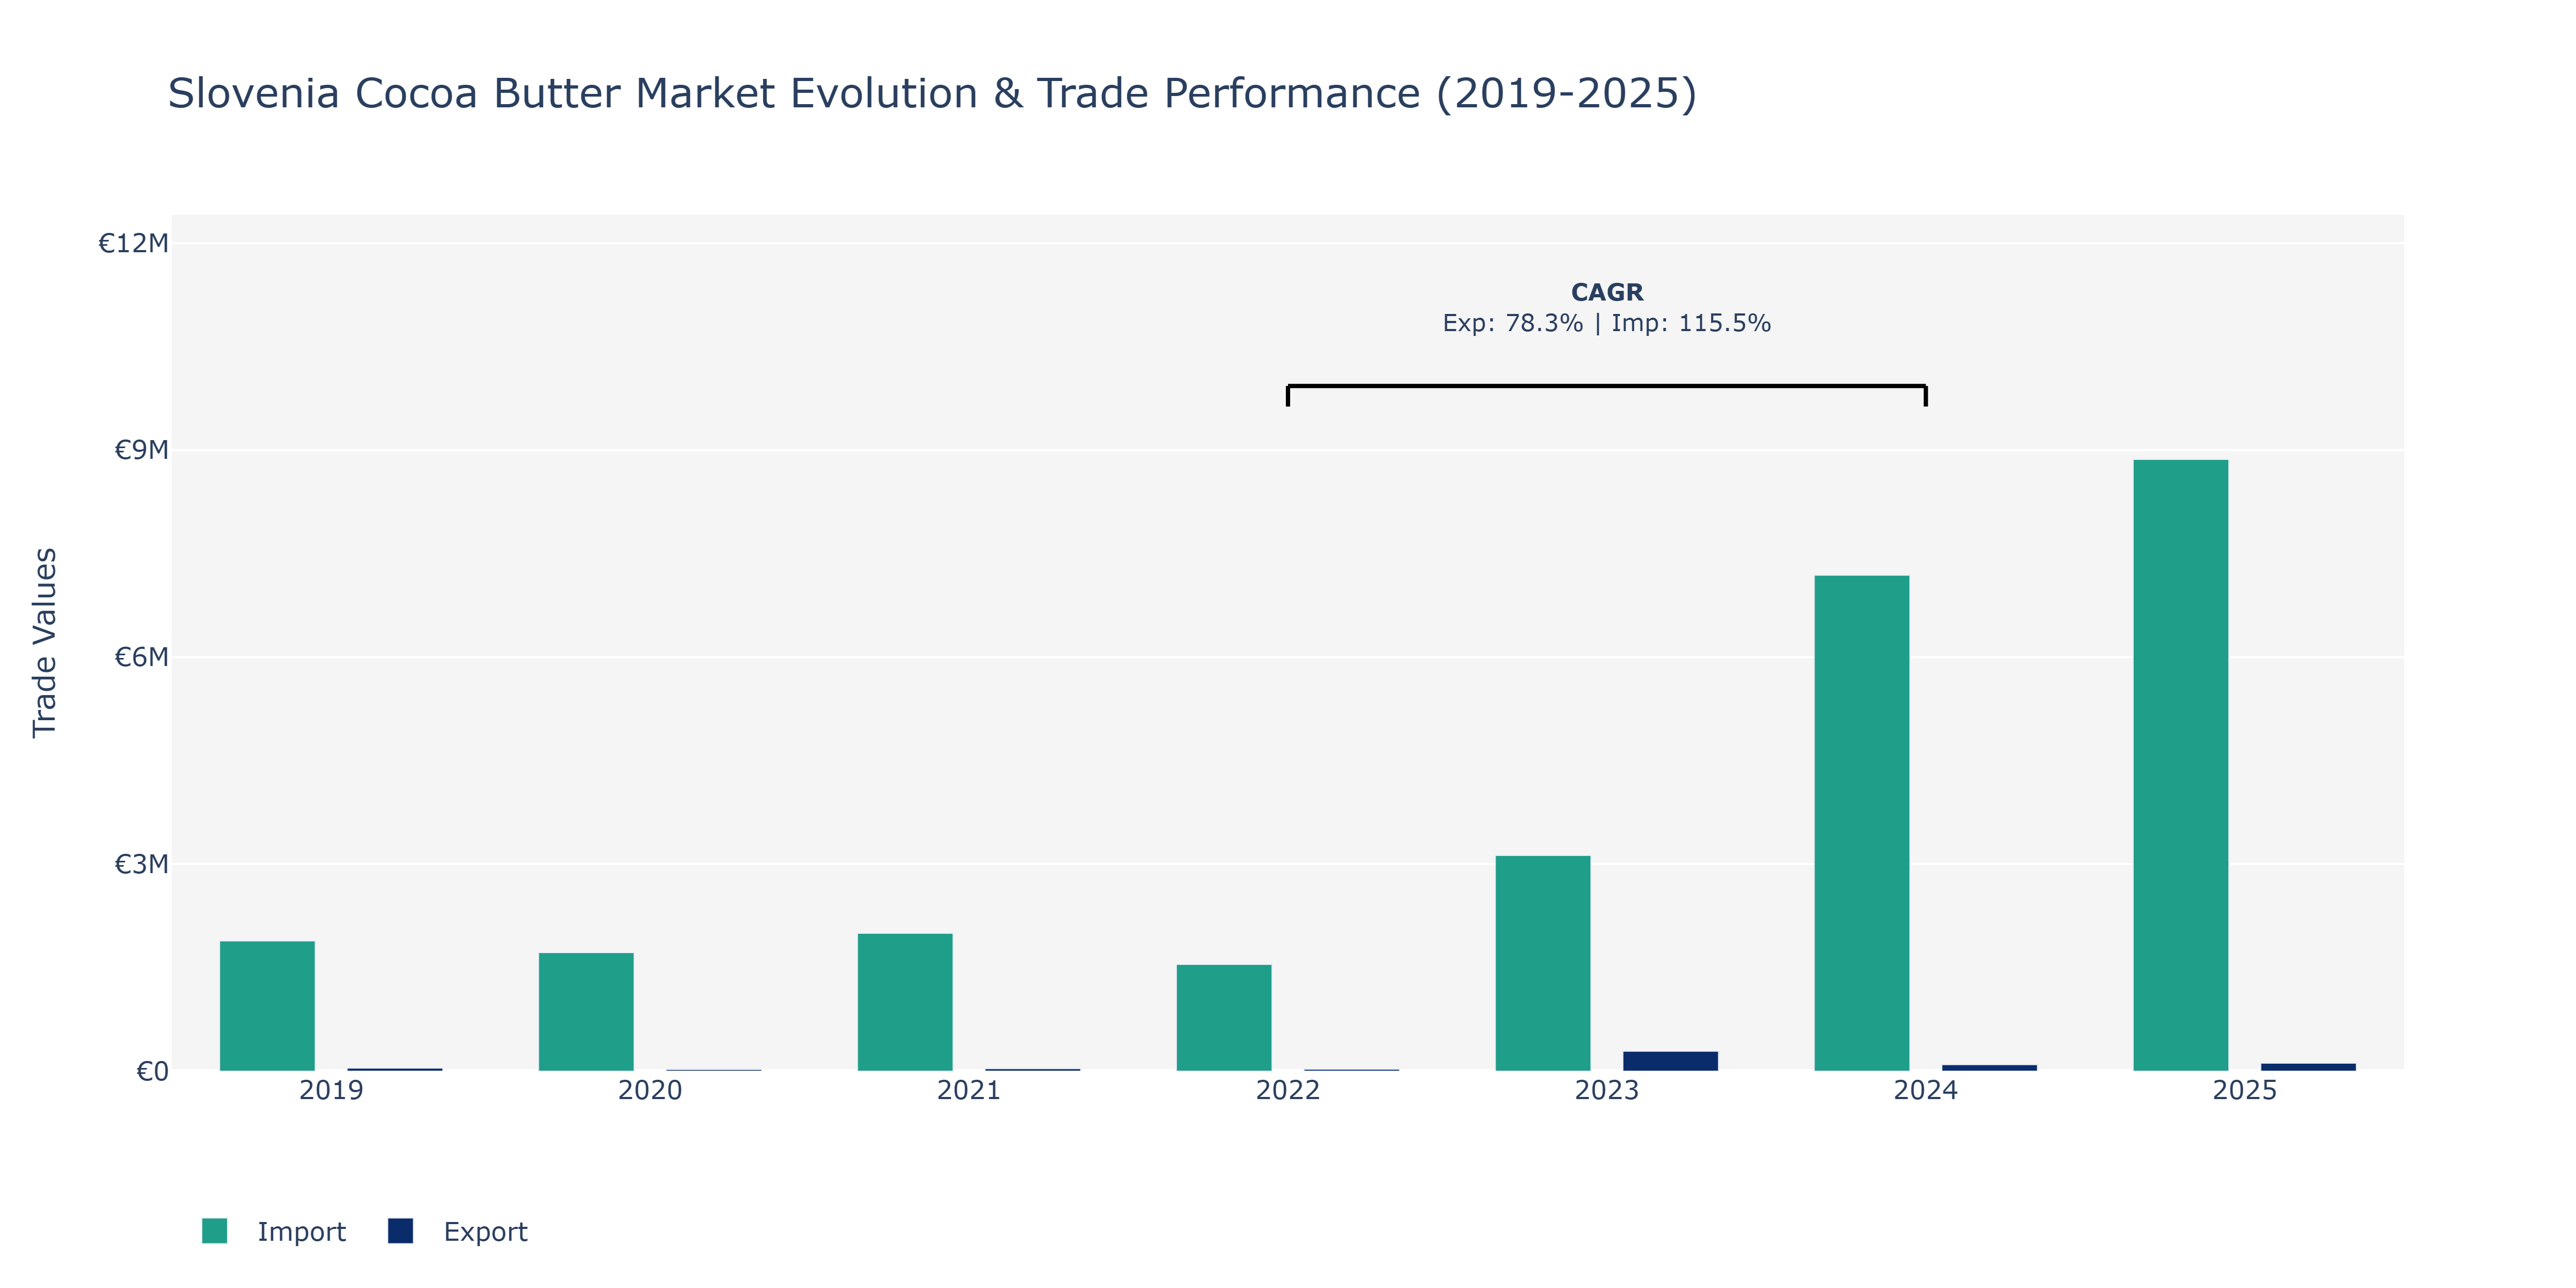
Between 2019 and 2025, Slovenia's Cocoa Butter Market witnessed fluctuations in both Exports and Imports. In 2023, there was a substantial surge in exports, reaching €289.45 thousand, possibly due to increased demand or improved production capabilities. Imports followed a similar pattern, peaking at €7.19 million in 2024, indicating growing consumption or strategic sourcing decisions. The years 2020 and 2022 saw declines in both exports and imports, which could be attributed to global economic factors, such as trade disruptions or market saturation. The consistent growth in imports from 2020 to 2025 suggests a rising demand for cocoa butter in Slovenia, potentially driven by the popularity of cocoa-based products in the region. These trends align with the overall growth of the global cocoa market, where consumption is forecasted to increase due to changing consumer preferences towards healthier and natural ingredients.
Key Highlights of the Report:
- Slovenia Cocoa butter Market Outlook
- Market Size of Slovenia Cocoa butter Market, 2025
- Forecast of Slovenia Cocoa butter Market, 2032
- Historical Data and Forecast of Slovenia Cocoa butter Revenues & Volume for the Period 2022-2032F
- Slovenia Cocoa butter Market Trend Evolution
- Slovenia Cocoa butter Market Drivers and Challenges
- Slovenia Cocoa butter Price Trends
- Slovenia Cocoa butter Porter`s Five Forces
- Slovenia Cocoa butter Industry Life Cycle
- Historical Data and Forecast of Slovenia Cocoa butter Market Revenues & Volume By Types for the Period 2022-2032F
- Historical Data and Forecast of Slovenia Cocoa butter Market Revenues & Volume By organic for the Period 2022-2032F
- Historical Data and Forecast of Slovenia Cocoa butter Market Revenues & Volume By conventional for the Period 2022-2032F
- Historical Data and Forecast of Slovenia Cocoa butter Market Revenues & Volume By deodorized for the Period 2022-2032F
- Historical Data and Forecast of Slovenia Cocoa butter Market Revenues & Volume By Form for the Period 2022-2032F
- Historical Data and Forecast of Slovenia Cocoa butter Market Revenues & Volume By solid for the Period 2022-2032F
- Historical Data and Forecast of Slovenia Cocoa butter Market Revenues & Volume By Liquid for the Period 2022-2032F
- Historical Data and Forecast of Slovenia Cocoa butter Market Revenues & Volume By End-user for the Period 2022-2032F
- Historical Data and Forecast of Slovenia Cocoa butter Market Revenues & Volume By Food Industry for the Period 2022-2032F
- Historical Data and Forecast of Slovenia Cocoa butter Market Revenues & Volume By Pharmaceutical Industry for the Period 2022-2032F
- Historical Data and Forecast of Slovenia Cocoa butter Market Revenues & Volume By Aromatherapy for the Period 2022-2032F
- Historical Data and Forecast of Slovenia Cocoa butter Market Revenues & Volume By Cosmetics for the Period 2022-2032F
- Historical Data and Forecast of Slovenia Cocoa butter Market Revenues & Volume By Personal Care Industry for the Period 2022-2032F
- Historical Data and Forecast of Slovenia Cocoa butter Market Revenues & Volume By Packaging for the Period 2022-2032F
- Historical Data and Forecast of Slovenia Cocoa butter Market Revenues & Volume By Tins for the Period 2022-2032F
- Historical Data and Forecast of Slovenia Cocoa butter Market Revenues & Volume By Cartons for the Period 2022-2032F
- Historical Data and Forecast of Slovenia Cocoa butter Market Revenues & Volume By Plastic Containers for the Period 2022-2032F
- Historical Data and Forecast of Slovenia Cocoa butter Market Revenues & Volume By Paper Containers for the Period 2022-2032F
- Historical Data and Forecast of Slovenia Cocoa butter Market Revenues & Volume By Others for the Period 2022-2032F
- Historical Data and Forecast of Slovenia Cocoa butter Market Revenues & Volume By Distribution Channel for the Period 2022-2032F
- Historical Data and Forecast of Slovenia Cocoa butter Market Revenues & Volume By Direct Sales for the Period 2022-2032F
- Historical Data and Forecast of Slovenia Cocoa butter Market Revenues & Volume By Indirect Sales for the Period 2022-2032F
- Slovenia Cocoa butter Import Export Trade Statistics
- Market Opportunity Assessment By Types
- Market Opportunity Assessment By Form
- Market Opportunity Assessment By End-user
- Market Opportunity Assessment By Packaging
- Market Opportunity Assessment By Distribution Channel
- Slovenia Cocoa butter Top Companies Market Share
- Slovenia Cocoa butter Competitive Benchmarking By Technical and Operational Parameters
- Slovenia Cocoa butter Company Profiles
- Slovenia Cocoa butter Key Strategic Recommendations
Frequently Asked Questions About the Market Study (FAQs):
6Wresearch actively monitors the Slovenia Cocoa butter Market and publishes its comprehensive annual report, highlighting emerging trends, growth drivers, revenue analysis, and forecast outlook. Our insights help businesses to make data-backed strategic decisions with ongoing market dynamics. Our analysts track relevent industries related to the Slovenia Cocoa butter Market, allowing our clients with actionable intelligence and reliable forecasts tailored to emerging regional needs.
Yes, we provide customisation as per your requirements. To learn more, feel free to contact us on sales@6wresearch.com
1 Executive Summary |
2 Introduction |
2.1 Key Highlights of the Report |
2.2 Report Description |
2.3 Market Scope & Segmentation |
2.4 Research Methodology |
2.5 Assumptions |
3 Slovenia Cocoa butter Market Overview |
3.1 Slovenia Country Macro Economic Indicators |
3.2 Slovenia Cocoa butter Market Revenues & Volume, 2022 & 2032F |
3.3 Slovenia Cocoa butter Market - Industry Life Cycle |
3.4 Slovenia Cocoa butter Market - Porter's Five Forces |
3.5 Slovenia Cocoa butter Market Revenues & Volume Share Segmentations, 2022 & 2032F |
3.6 Slovenia Cocoa butter Market Revenues & Volume Share, By Form, 2022 & 2032F |
3.7 Slovenia Cocoa butter Market Revenues & Volume Share, By End-user, 2022 & 2032F |
3.8 Slovenia Cocoa butter Market Revenues & Volume Share, By Packaging, 2022 & 2032F |
3.9 Slovenia Cocoa butter Market Revenues & Volume Share, By Distribution Channel, 2022 & 2032F |
4 Slovenia Cocoa butter Market Dynamics |
4.1 Impact Analysis |
4.2 Market Drivers |
4.2.1 Increasing consumer awareness about the health benefits of cocoa butter |
4.2.2 Growing demand for natural and organic skincare and cosmetics products |
4.2.3 Expansion of the food and beverage industry in Slovenia |
4.3 Market Restraints |
4.3.1 Fluctuating prices of raw cocoa beans |
4.3.2 Lack of awareness about the multiple uses and benefits of cocoa butter |
4.3.3 Regulatory restrictions on the import/export of cocoa butter |
5 Slovenia Cocoa butter Market Trends |
6 Slovenia Cocoa butter Market Segmentations |
6.1 Slovenia Cocoa butter Market Segmentations |
6.1.1 Overview and Analysis |
6.1.2 Slovenia Cocoa butter Market Revenues & Volume, By organic, 2022-2032F |
6.1.3 Slovenia Cocoa butter Market Revenues & Volume, By conventional, 2022-2032F |
6.1.4 Slovenia Cocoa butter Market Revenues & Volume, By deodorized, 2022-2032F |
6.2 Slovenia Cocoa butter Market, By Form |
6.2.1 Overview and Analysis |
6.2.2 Slovenia Cocoa butter Market Revenues & Volume, By solid, 2022-2032F |
6.2.3 Slovenia Cocoa butter Market Revenues & Volume, By Liquid, 2022-2032F |
6.3 Slovenia Cocoa butter Market, By End-user |
6.3.1 Overview and Analysis |
6.3.2 Slovenia Cocoa butter Market Revenues & Volume, By Food Industry, 2022-2032F |
6.3.3 Slovenia Cocoa butter Market Revenues & Volume, By Pharmaceutical Industry, 2022-2032F |
6.3.4 Slovenia Cocoa butter Market Revenues & Volume, By Aromatherapy, 2022-2032F |
6.3.5 Slovenia Cocoa butter Market Revenues & Volume, By Cosmetics, 2022-2032F |
6.3.6 Slovenia Cocoa butter Market Revenues & Volume, By Personal Care Industry, 2022-2032F |
6.4 Slovenia Cocoa butter Market, By Packaging |
6.4.1 Overview and Analysis |
6.4.2 Slovenia Cocoa butter Market Revenues & Volume, By Tins, 2022-2032F |
6.4.3 Slovenia Cocoa butter Market Revenues & Volume, By Cartons, 2022-2032F |
6.4.4 Slovenia Cocoa butter Market Revenues & Volume, By Plastic Containers, 2022-2032F |
6.4.5 Slovenia Cocoa butter Market Revenues & Volume, By Paper Containers, 2022-2032F |
6.4.6 Slovenia Cocoa butter Market Revenues & Volume, By Others, 2022-2032F |
6.5 Slovenia Cocoa butter Market, By Distribution Channel |
6.5.1 Overview and Analysis |
6.5.2 Slovenia Cocoa butter Market Revenues & Volume, By Direct Sales, 2022-2032F |
6.5.3 Slovenia Cocoa butter Market Revenues & Volume, By Indirect Sales, 2022-2032F |
7 Slovenia Cocoa butter Market Import-Export Trade Statistics |
7.1 Slovenia Cocoa butter Market Export to Major Countries |
7.2 Slovenia Cocoa butter Market Imports from Major Countries |
8 Slovenia Cocoa butter Market Key Performance Indicators |
8.1 Percentage increase in the production of cocoa-based products in Slovenia |
8.2 Number of new product launches containing cocoa butter |
8.3 Growth in the number of cocoa butter processing facilities in Slovenia |
9 Slovenia Cocoa butter Market - Opportunity Assessment |
9.1 Slovenia Cocoa butter Market Opportunity Assessment Segmentations, 2022 & 2032F |
9.2 Slovenia Cocoa butter Market Opportunity Assessment, By Form, 2022 & 2032F |
9.3 Slovenia Cocoa butter Market Opportunity Assessment, By End-user, 2022 & 2032F |
9.4 Slovenia Cocoa butter Market Opportunity Assessment, By Packaging, 2022 & 2032F |
9.5 Slovenia Cocoa butter Market Opportunity Assessment, By Distribution Channel, 2022 & 2032F |
10 Slovenia Cocoa butter Market - Competitive Landscape |
10.1 Slovenia Cocoa butter Market Revenue Share, By Companies, 2025 |
10.2 Slovenia Cocoa butter Market Competitive Benchmarking, By Operating and Technical Parameters |
11 Company Profiles |
12 Recommendations | 13 Disclaimer |
Global Go To Market Strategy - 2030
Export potential enables firms to identify high-growth global markets with greater confidence by combining advanced trade intelligence with a structured quantitative methodology. The framework analyzes emerging demand trends and country-level import patterns while integrating macroeconomic and trade datasets such as GDP and population forecasts, bilateral import–export flows, tariff structures, elasticity differentials between developed and developing economies, geographic distance, and import demand projections. Using weighted trade values from 2020–2024 as the base period to project country-to-country export potential for 2030, these inputs are operationalized through calculated drivers such as gravity model parameters, tariff impact factors, and projected GDP per-capita growth. Through an analysis of hidden potentials, demand hotspots, and market conditions that are most favorable to success, this method enables firms to focus on target countries, maximize returns, and global expansion with data, backed by accuracy.
By factoring in the projected importer demand gap that is currently unmet and could be potential opportunity, it identifies the potential for the Exporter (Country) among 190 countries, against the general trade analysis, which identifies the biggest importer or exporter.
To discover high-growth global markets and optimize your business strategy:
Click Here
Pricing
- Single User License$ 1,995
- Department License$ 2,400
- Site License$ 3,120
- Global License$ 3,795

Leadership Perspectives from Industry Events
Search
Thought Leadership and Analyst Meet


Our Clients
6WResearch In News
- India Export Attractiveness Tracker 2026
- India Air Conditioner Market Set for Strong Rebound in 2026 After Weather-Led Correction and GST-Driven Recovery: 6Wresearch
- ADAS in India: How Automatic Emergency Braking, Blind Spot Detection & Driver Monitoring are Transforming Road Safety
- Doha a strategic location for EV manufacturing hub: IPA Qatar
- Demand for luxury TVs surging in the GCC, says Samsung
- Empowering Growth: The Thriving Journey of Bangladesh’s Cable Industry
Latest Reports
- Nicaragua RPG Gaming Market (2026-2032)
- New Zealand RPG Gaming Market (2026-2032)
- Netherlands RPG Gaming Market (2026-2032)
- Nauru RPG Gaming Market (2026-2032)
- Namibia RPG Gaming Market (2026-2032)
- Mozambique RPG Gaming Market (2026-2032)
- Montenegro RPG Gaming Market (2026-2032)
- Mongolia RPG Gaming Market (2026-2032)
- Monaco RPG Gaming Market (2026-2032)
- Micronesia RPG Gaming Market (2026-2032)
Industry Events and Analyst Meet

EV India Expo 2026

HIMTEX 2026

India Refining Summit 2026

India EV Show 2026

EV tech India Expo 2026
Whitepaper
- Middle East & Africa Commercial Security Market Click here to view more.
- Middle East & Africa Fire Safety Systems & Equipment Market Click here to view more.
- GCC Drone Market Click here to view more.
- Middle East Lighting Fixture Market Click here to view more.
- GCC Physical & Perimeter Security Market Click here to view more.