Slovenia Complex Starches Market (2026-2032) | Growth, Value, Trends, Analysis, Segmentation, Companies, Share, Forecast, Outlook, Industry, Size & Revenue, Competitive Landscape
Market Forecast By Source (Peas, Beans, Whole Grains, Vegetables), By Nutritional Content (Vitamins, Fibres, Minerals), By Derivative Type (Cross-linked Starch Ether, Cross-linked Starch Ether), By End-User (Food and Beverages, Feed, Paper Industry, Pharmaceuticals, Others) And Competitive Landscape
| Product Code: ETC9314140 | Publication Date: Sep 2024 | Updated Date: Apr 2026 | Product Type: Market Research Report | |
| Publisher: 6Wresearch | Author: Vasudha | No. of Pages: 75 | No. of Figures: 35 | No. of Tables: 20 |
Slovenia Complex Starches Market Size (2020-2030)
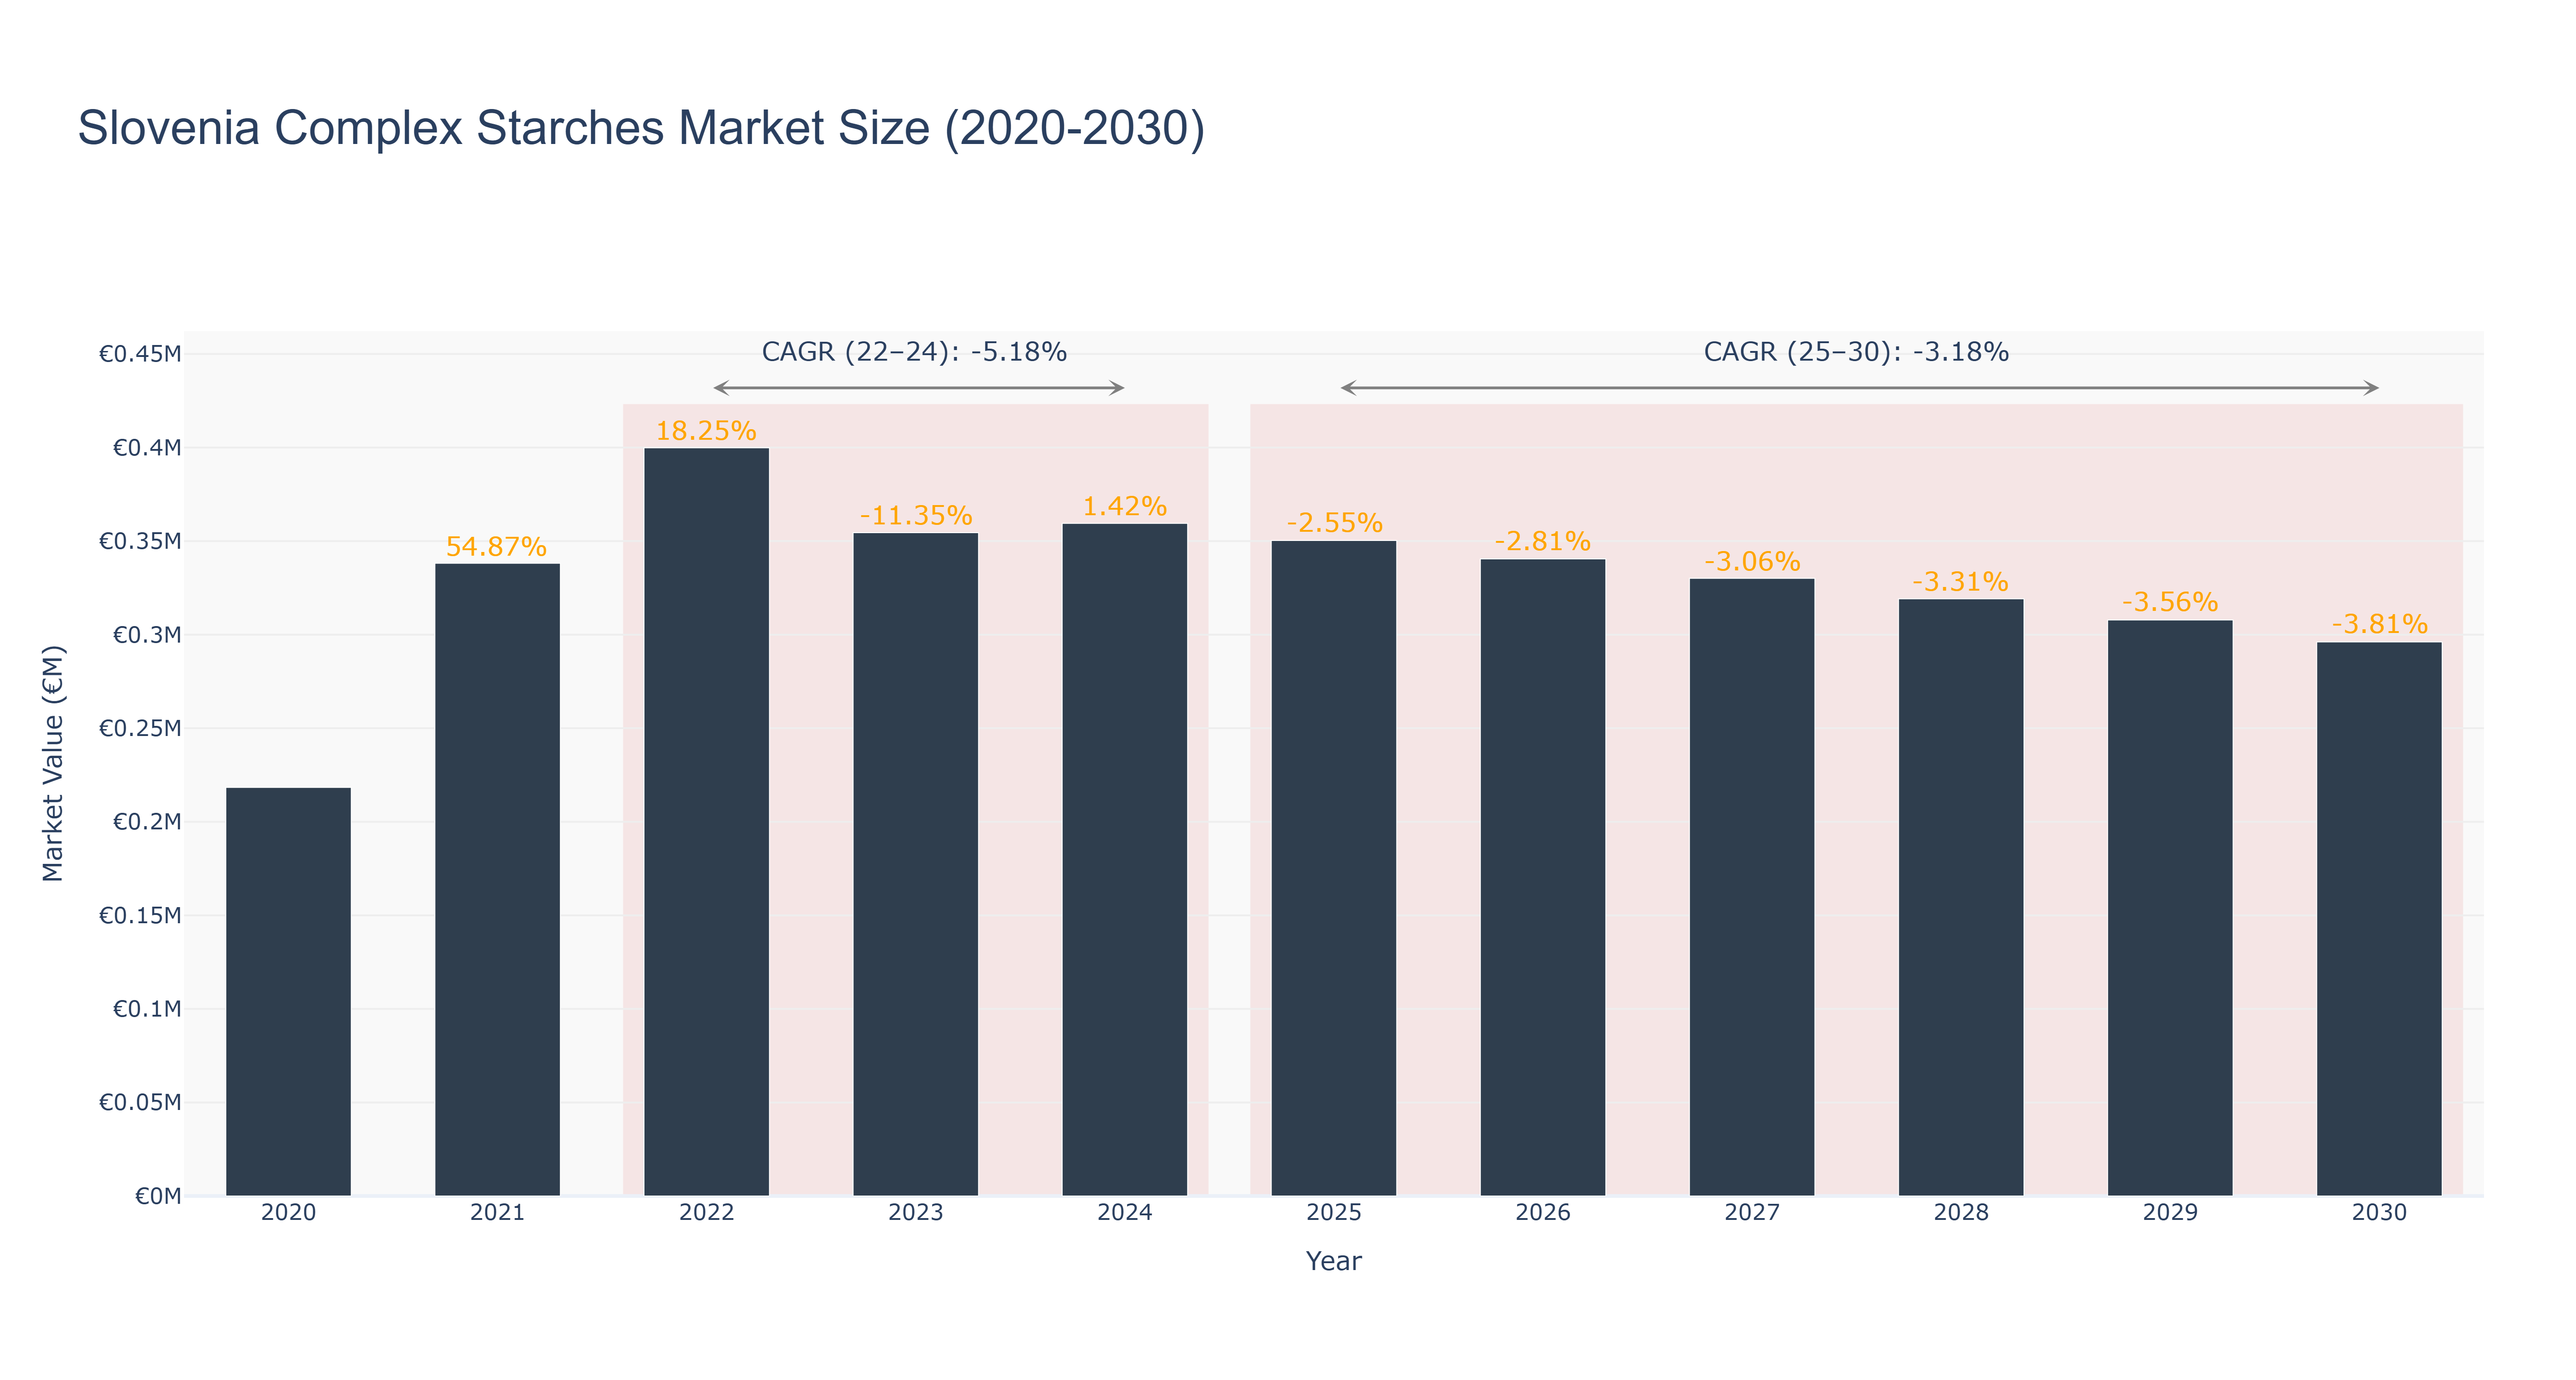
Slovenia's Complex Starches Market experienced a peak market size of €0.40 million in 2022. From 2020 to 2024, the market size grew steadily, reaching €0.36 million in 2024. However, a downward trend began in 2025, with the market size decreasing to €0.35 million. This decline continued through 2030, with a forecasted market size of €0.30 million. The CAGR for the period 2022-24 was -5.18%, while for 2025-30, it is projected to be -3.18%. The market's downturn can be attributed to changing consumer preferences towards alternative products and increased competition. Looking ahead, Slovenia's Complex Starches Market is expected to focus on product innovation and sustainable practices to regain market share and drive growth in the future.
Slovenia Complex Starches Market: Production & Trade Performance (2019-2025)
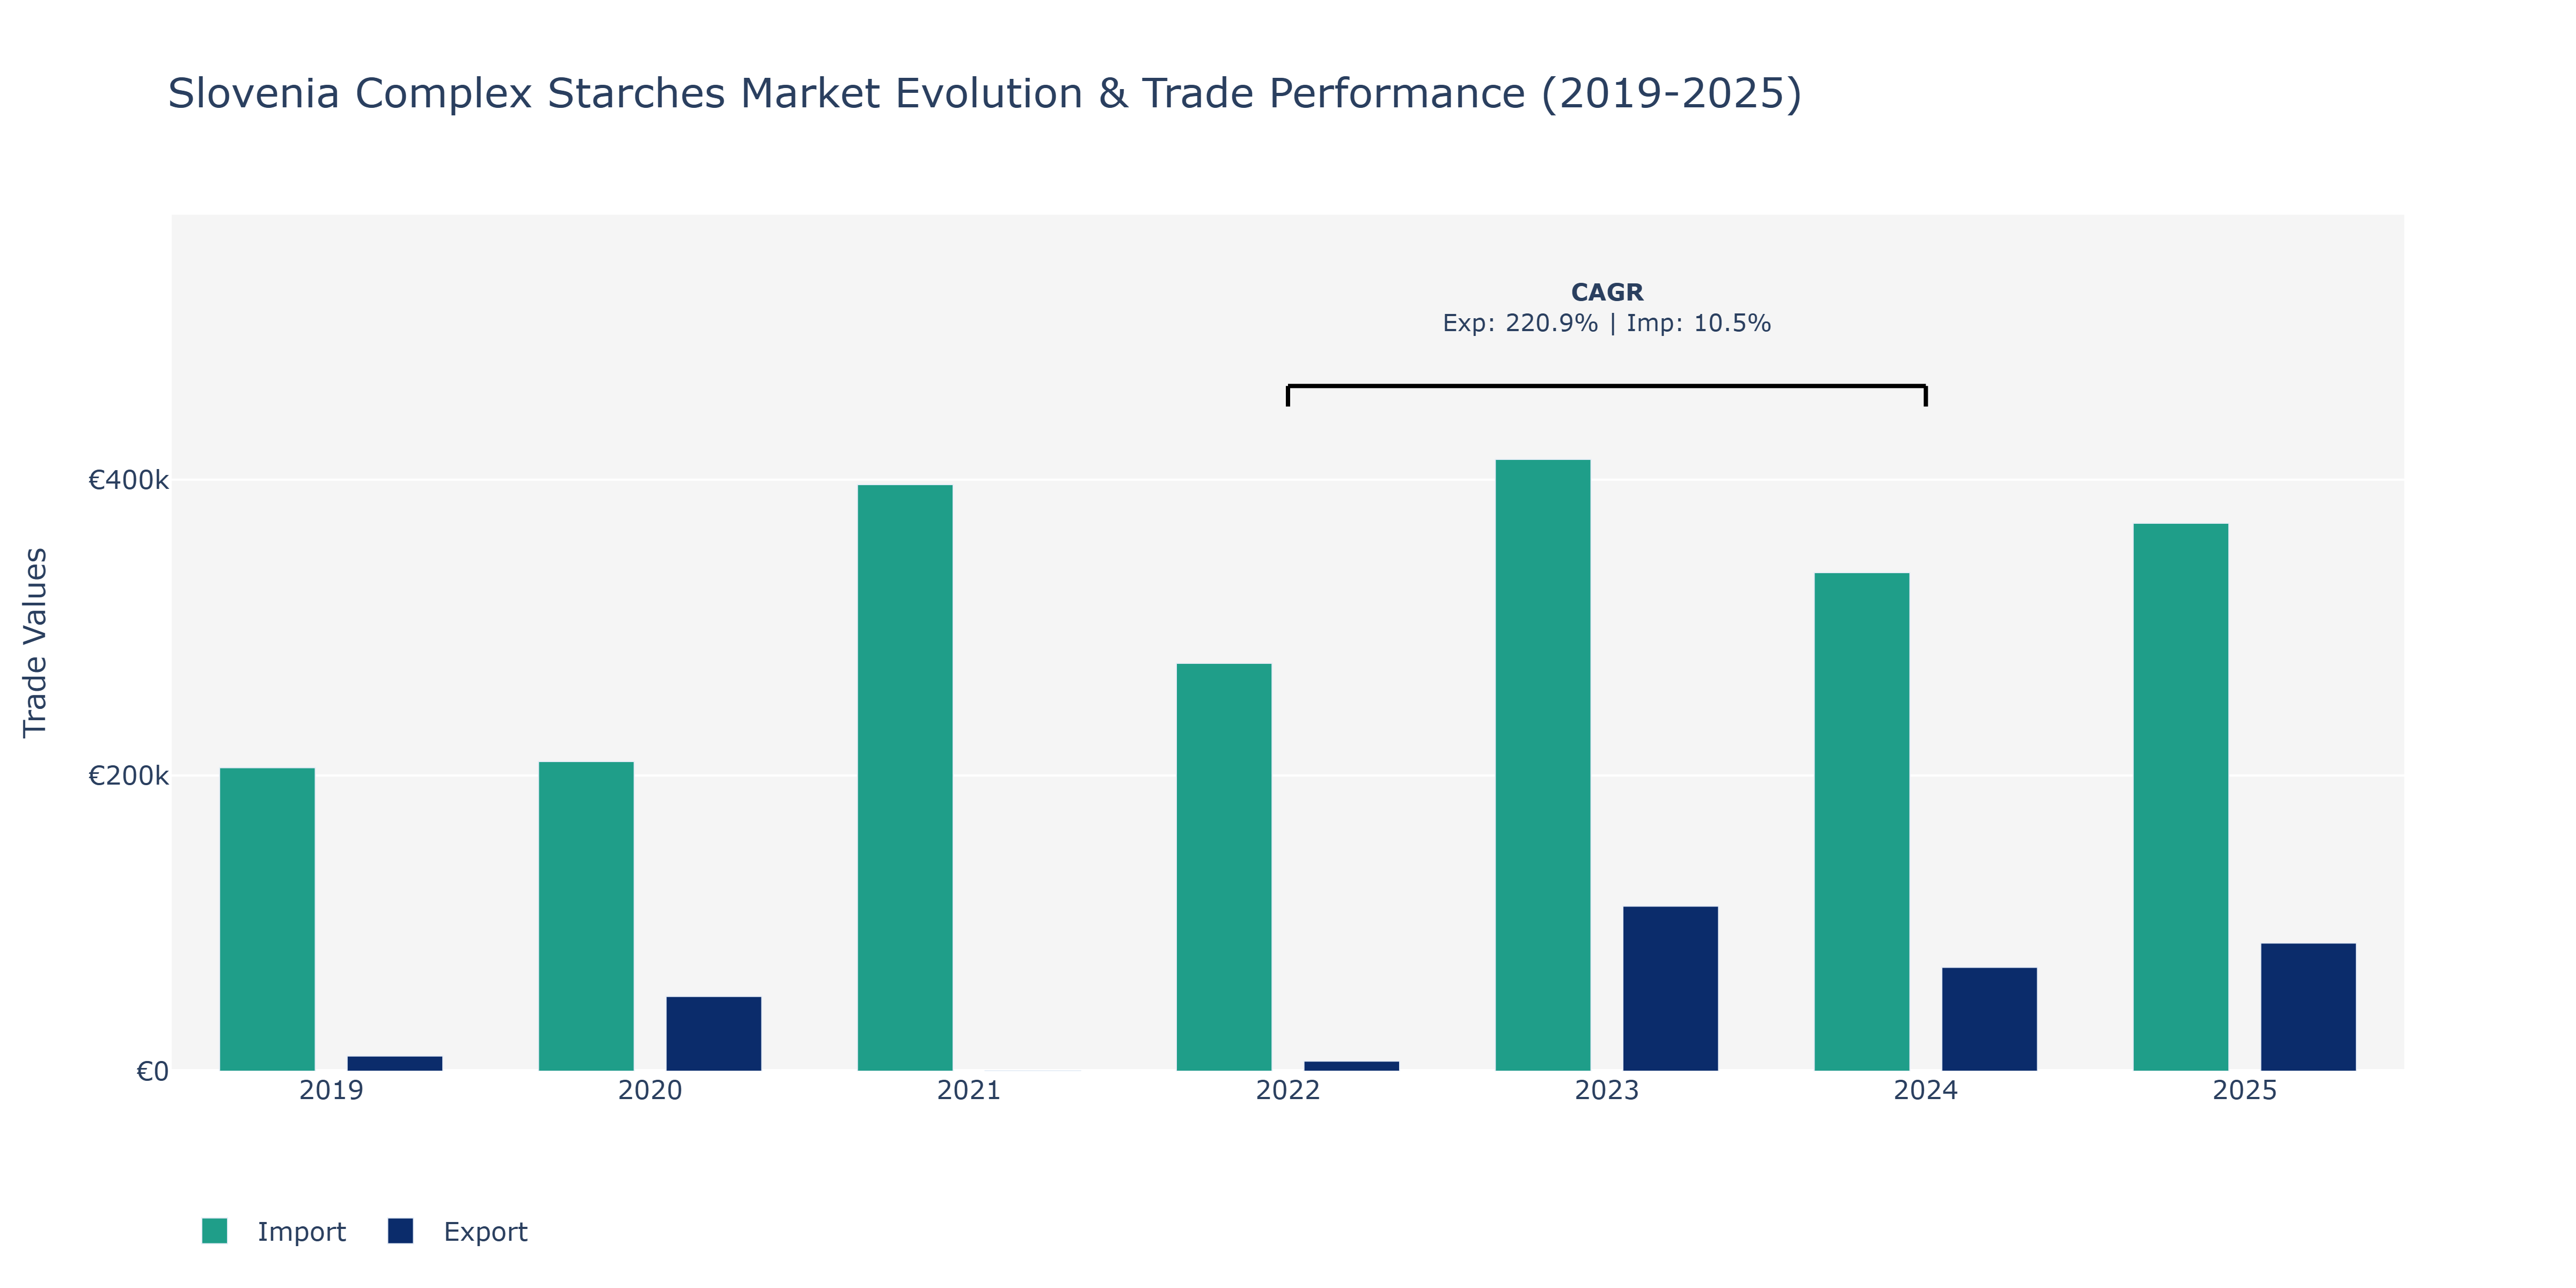
In the Slovenia Complex Starches Market, exports exhibited fluctuations over the analyzed period, starting at €10.24 thousand in 2019 and reaching a peak of €111.62 thousand in 2023, before decreasing to €70.26 thousand in 2024. Despite a slight recovery in 2025 to €86.66 thousand, the overall trend shows a notable increase from 2019 to 2023 followed by a decline. This fluctuation may be attributed to evolving global starch trade dynamics, including changes in demand patterns, international regulations impacting exports, and supply chain disruptions affecting production volumes. On the other hand, imports consistently rose from €205.18 thousand in 2019 to €396.59 thousand in 2021, marking a substantial growth driven by increased demand for foreign starch products, the expansion of domestic food processing industries, and the need for diverse starch sources. The subsequent decline to €337.07 thousand in 2024 may reflect adjustments in procurement strategies or shifts in market preferences towards local sourcing. The slight increase in 2025 to €370.5 thousand suggests a potential stabilization or adaptation phase in response to market dynamics. These trends underline the significance of market flexibility and strategic sourcing decisions in navigating the complexities of the global starch trade landscape.
Key Highlights of the Report:
- Slovenia Complex Starches Market Outlook
- Market Size of Slovenia Complex Starches Market, 2025
- Forecast of Slovenia Complex Starches Market, 2032
- Historical Data and Forecast of Slovenia Complex Starches Revenues & Volume for the Period 2022-2032F
- Slovenia Complex Starches Market Trend Evolution
- Slovenia Complex Starches Market Drivers and Challenges
- Slovenia Complex Starches Price Trends
- Slovenia Complex Starches Porter's Five Forces
- Slovenia Complex Starches Industry Life Cycle
- Historical Data and Forecast of Slovenia Complex Starches Market Revenues & Volume By Source for the Period 2022-2032F
- Historical Data and Forecast of Slovenia Complex Starches Market Revenues & Volume By Peas for the Period 2022-2032F
- Historical Data and Forecast of Slovenia Complex Starches Market Revenues & Volume By Beans for the Period 2022-2032F
- Historical Data and Forecast of Slovenia Complex Starches Market Revenues & Volume By Whole Grains for the Period 2022-2032F
- Historical Data and Forecast of Slovenia Complex Starches Market Revenues & Volume By Vegetables for the Period 2022-2032F
- Historical Data and Forecast of Slovenia Complex Starches Market Revenues & Volume By Nutritional Content for the Period 2022-2032F
- Historical Data and Forecast of Slovenia Complex Starches Market Revenues & Volume By Vitamins for the Period 2022-2032F
- Historical Data and Forecast of Slovenia Complex Starches Market Revenues & Volume By Fibres for the Period 2022-2032F
- Historical Data and Forecast of Slovenia Complex Starches Market Revenues & Volume By Minerals for the Period 2022-2032F
- Historical Data and Forecast of Slovenia Complex Starches Market Revenues & Volume By Derivative Type for the Period 2022-2032F
- Historical Data and Forecast of Slovenia Complex Starches Market Revenues & Volume By Cross-linked Starch Ether for the Period 2022-2032F
- Historical Data and Forecast of Slovenia Complex Starches Market Revenues & Volume By Cross-linked Starch Ether for the Period 2022-2032F
- Historical Data and Forecast of Slovenia Complex Starches Market Revenues & Volume By End-User for the Period 2022-2032F
- Historical Data and Forecast of Slovenia Complex Starches Market Revenues & Volume By Food and Beverages for the Period 2022-2032F
- Historical Data and Forecast of Slovenia Complex Starches Market Revenues & Volume By Feed for the Period 2022-2032F
- Historical Data and Forecast of Slovenia Complex Starches Market Revenues & Volume By Paper Industry for the Period 2022-2032F
- Historical Data and Forecast of Slovenia Complex Starches Market Revenues & Volume By Pharmaceuticals for the Period 2022-2032F
- Historical Data and Forecast of Slovenia Complex Starches Market Revenues & Volume By Others for the Period 2022-2032F
- Slovenia Complex Starches Import Export Trade Statistics
- Market Opportunity Assessment By Source
- Market Opportunity Assessment By Nutritional Content
- Market Opportunity Assessment By Derivative Type
- Market Opportunity Assessment By End-User
- Slovenia Complex Starches Top Companies Market Share
- Slovenia Complex Starches Competitive Benchmarking By Technical and Operational Parameters
- Slovenia Complex Starches Company Profiles
- Slovenia Complex Starches Key Strategic Recommendations
Frequently Asked Questions About the Market Study (FAQs):
6Wresearch actively monitors the Slovenia Complex Starches Market and publishes its comprehensive annual report, highlighting emerging trends, growth drivers, revenue analysis, and forecast outlook. Our insights help businesses to make data-backed strategic decisions with ongoing market dynamics. Our analysts track relevent industries related to the Slovenia Complex Starches Market, allowing our clients with actionable intelligence and reliable forecasts tailored to emerging regional needs.
Yes, we provide customisation as per your requirements. To learn more, feel free to contact us on sales@6wresearch.com
1 Executive Summary |
2 Introduction |
2.1 Key Highlights of the Report |
2.2 Report Description |
2.3 Market Scope & Segmentation |
2.4 Research Methodology |
2.5 Assumptions |
3 Slovenia Complex Starches Market Overview |
3.1 Slovenia Country Macro Economic Indicators |
3.2 Slovenia Complex Starches Market Revenues & Volume, 2022 & 2032F |
3.3 Slovenia Complex Starches Market - Industry Life Cycle |
3.4 Slovenia Complex Starches Market - Porter's Five Forces |
3.5 Slovenia Complex Starches Market Revenues & Volume Share, By Source, 2022 & 2032F |
3.6 Slovenia Complex Starches Market Revenues & Volume Share, By Nutritional Content, 2022 & 2032F |
3.7 Slovenia Complex Starches Market Revenues & Volume Share, By Derivative Type, 2022 & 2032F |
3.8 Slovenia Complex Starches Market Revenues & Volume Share, By End-User, 2022 & 2032F |
4 Slovenia Complex Starches Market Dynamics |
4.1 Impact Analysis |
4.2 Market Drivers |
4.3 Market Restraints |
5 Slovenia Complex Starches Market Trends |
6 Slovenia Complex Starches Market, By Types |
6.1 Slovenia Complex Starches Market, By Source |
6.1.1 Overview and Analysis |
6.1.2 Slovenia Complex Starches Market Revenues & Volume, By Source, 2022-2032F |
6.1.3 Slovenia Complex Starches Market Revenues & Volume, By Peas, 2022-2032F |
6.1.4 Slovenia Complex Starches Market Revenues & Volume, By Beans, 2022-2032F |
6.1.5 Slovenia Complex Starches Market Revenues & Volume, By Whole Grains, 2022-2032F |
6.1.6 Slovenia Complex Starches Market Revenues & Volume, By Vegetables, 2022-2032F |
6.2 Slovenia Complex Starches Market, By Nutritional Content |
6.2.1 Overview and Analysis |
6.2.2 Slovenia Complex Starches Market Revenues & Volume, By Vitamins, 2022-2032F |
6.2.3 Slovenia Complex Starches Market Revenues & Volume, By Fibres, 2022-2032F |
6.2.4 Slovenia Complex Starches Market Revenues & Volume, By Minerals, 2022-2032F |
6.3 Slovenia Complex Starches Market, By Derivative Type |
6.3.1 Overview and Analysis |
6.3.2 Slovenia Complex Starches Market Revenues & Volume, By Cross-linked Starch Ether, 2022-2032F |
6.3.3 Slovenia Complex Starches Market Revenues & Volume, By Cross-linked Starch Ether, 2022-2032F |
6.4 Slovenia Complex Starches Market, By End-User |
6.4.1 Overview and Analysis |
6.4.2 Slovenia Complex Starches Market Revenues & Volume, By Food and Beverages, 2022-2032F |
6.4.3 Slovenia Complex Starches Market Revenues & Volume, By Feed, 2022-2032F |
6.4.4 Slovenia Complex Starches Market Revenues & Volume, By Paper Industry, 2022-2032F |
6.4.5 Slovenia Complex Starches Market Revenues & Volume, By Pharmaceuticals, 2022-2032F |
6.4.6 Slovenia Complex Starches Market Revenues & Volume, By Others, 2022-2032F |
7 Slovenia Complex Starches Market Import-Export Trade Statistics |
7.1 Slovenia Complex Starches Market Export to Major Countries |
7.2 Slovenia Complex Starches Market Imports from Major Countries |
8 Slovenia Complex Starches Market Key Performance Indicators |
9 Slovenia Complex Starches Market - Opportunity Assessment |
9.1 Slovenia Complex Starches Market Opportunity Assessment, By Source, 2022 & 2032F |
9.2 Slovenia Complex Starches Market Opportunity Assessment, By Nutritional Content, 2022 & 2032F |
9.3 Slovenia Complex Starches Market Opportunity Assessment, By Derivative Type, 2022 & 2032F |
9.4 Slovenia Complex Starches Market Opportunity Assessment, By End-User, 2022 & 2032F |
10 Slovenia Complex Starches Market - Competitive Landscape |
10.1 Slovenia Complex Starches Market Revenue Share, By Companies, 2025 |
10.2 Slovenia Complex Starches Market Competitive Benchmarking, By Operating and Technical Parameters |
11 Company Profiles |
12 Recommendations |
13 Disclaimer |
Export potential assessment - trade Analytics for 2030
Export potential enables firms to identify high-growth global markets with greater confidence by combining advanced trade intelligence with a structured quantitative methodology. The framework analyzes emerging demand trends and country-level import patterns while integrating macroeconomic and trade datasets such as GDP and population forecasts, bilateral import–export flows, tariff structures, elasticity differentials between developed and developing economies, geographic distance, and import demand projections. Using weighted trade values from 2020–2024 as the base period to project country-to-country export potential for 2030, these inputs are operationalized through calculated drivers such as gravity model parameters, tariff impact factors, and projected GDP per-capita growth. Through an analysis of hidden potentials, demand hotspots, and market conditions that are most favorable to success, this method enables firms to focus on target countries, maximize returns, and global expansion with data, backed by accuracy.
By factoring in the projected importer demand gap that is currently unmet and could be potential opportunity, it identifies the potential for the Exporter (Country) among 190 countries, against the general trade analysis, which identifies the biggest importer or exporter.
To discover high-growth global markets and optimize your business strategy:
Click Here
Pricing
- Single User License$ 1,995
- Department License$ 2,400
- Site License$ 3,120
- Global License$ 3,795

Search
Thought Leadership and Analyst Meet


Our Clients
Latest Reports
- China Electric Appliance Rental Market (2026-2032) | Trends, Revenue, Growth, Challenges, Size, Value, Outlook, Pricing, Strategy, Insights, Restraints, segmentation, Companies, Investment Opportunities, Analysis, Demand, Drivers, Competition, Forecast, Share
- Chile Electric Appliance Rental Market (2026-2032) | Outlook, Competition, Drivers, Strategy, Revenue, Analysis, Value, Pricing, Restraints, Size, Demand, Share, Growth, Forecast, Challenges, Insights, Investment Opportunities, Companies, Trends, segmentation
- Cambodia Electric Appliance Rental Market (2026-2032) | Companies, Analysis, Restraints, Pricing, Insights, Challenges, Outlook, Strategy, Forecast, Trends, Competition, Value, Revenue, Investment Opportunities, segmentation, Drivers, Size, Demand, Growth, Share
- Brazil Electric Appliance Rental Market (2026-2032) | Revenue, Strategy, Forecast, Companies, segmentation, Competition, Size, Investment Opportunities, Pricing, Restraints, Outlook, Challenges, Analysis, Drivers, Value, Demand, Insights, Trends, Growth, Share
- Bangladesh Electric Appliance Rental Market (2026-2032) | Drivers, Forecast, Investment Opportunities, Strategy, Insights, Demand, Challenges, Outlook, Trends, Competition, Value, Revenue, Size, Pricing, Analysis, Companies, Restraints, segmentation, Share, Growth
- Bahrain Electric Appliance Rental Market (2026-2032) | Outlook, Size, Competition, Restraints, Drivers, Value, Trends, Investment Opportunities, Insights, Forecast, Revenue, Strategy, Growth, Share, Demand, Analysis, Challenges, Companies, segmentation, Pricing
- Azerbaijan Electric Appliance Rental Market (2026-2032) | Trends, Investment Opportunities, Restraints, Insights, Strategy, Competition, Value, Growth, Demand, Drivers, Analysis, Forecast, Size, Share, Outlook, segmentation, Pricing, Challenges, Revenue, Companies
- Australia Electric Appliance Rental Market (2026-2032) | Challenges, Restraints, Forecast, Demand, Size, Competition, Pricing, Investment Opportunities, Revenue, Trends, Drivers, Growth, Outlook, Analysis, Strategy, Value, segmentation, Insights, Companies, Share
- Argentina Electric Appliance Rental Market (2026-2032) | Growth, Trends, Insights, Outlook, Forecast, Size, Drivers, Analysis, Restraints, Challenges, Share, Revenue, Investment Opportunities, Strategy, Demand, Value, Companies, segmentation, Competition, Pricing
- Algeria Electric Appliance Rental Market (2026-2032) | Share, Size, Value, Strategy, Competition, Outlook, Challenges, Companies, Trends, Pricing, Insights, Forecast, Investment Opportunities, Revenue, Growth, Restraints, segmentation, Analysis, Demand, Drivers
Industry Events and Analyst Meet

HIMTEX 2026

India Refining Summit 2026

India EV Show 2026

EV tech India Expo 2026

Auto Tech Asia 2026
Whitepaper
- Middle East & Africa Commercial Security Market Click here to view more.
- Middle East & Africa Fire Safety Systems & Equipment Market Click here to view more.
- GCC Drone Market Click here to view more.
- Middle East Lighting Fixture Market Click here to view more.
- GCC Physical & Perimeter Security Market Click here to view more.
6WResearch In News
- Doha a strategic location for EV manufacturing hub: IPA Qatar
- Demand for luxury TVs surging in the GCC, says Samsung
- Empowering Growth: The Thriving Journey of Bangladesh’s Cable Industry
- Demand for luxury TVs surging in the GCC, says Samsung
- Video call with a traditional healer? Once unthinkable, it’s now common in South Africa
- Intelligent Buildings To Smooth GCC’s Path To Net Zero