Slovenia Copper Wire Market (2026-2032) | Revenue, Industry, Trends, Share, Segmentation, Growth, Value, Forecast, Companies, Analysis, Size & Outlook
Market Forecast By Application (Building and Construction, Telecommunication and Power, Transport, Industrial Equipment, Electronics, Others) And Competitive Landscape
| Product Code: ETC4919904 | Publication Date: Nov 2023 | Updated Date: Apr 2026 | Product Type: Market Research Report | |
| Publisher: 6Wresearch | Author: Shubham Padhi | No. of Pages: 60 | No. of Figures: 30 | No. of Tables: 5 |
Slovenia Copper Wire Market Size (2020-2030)
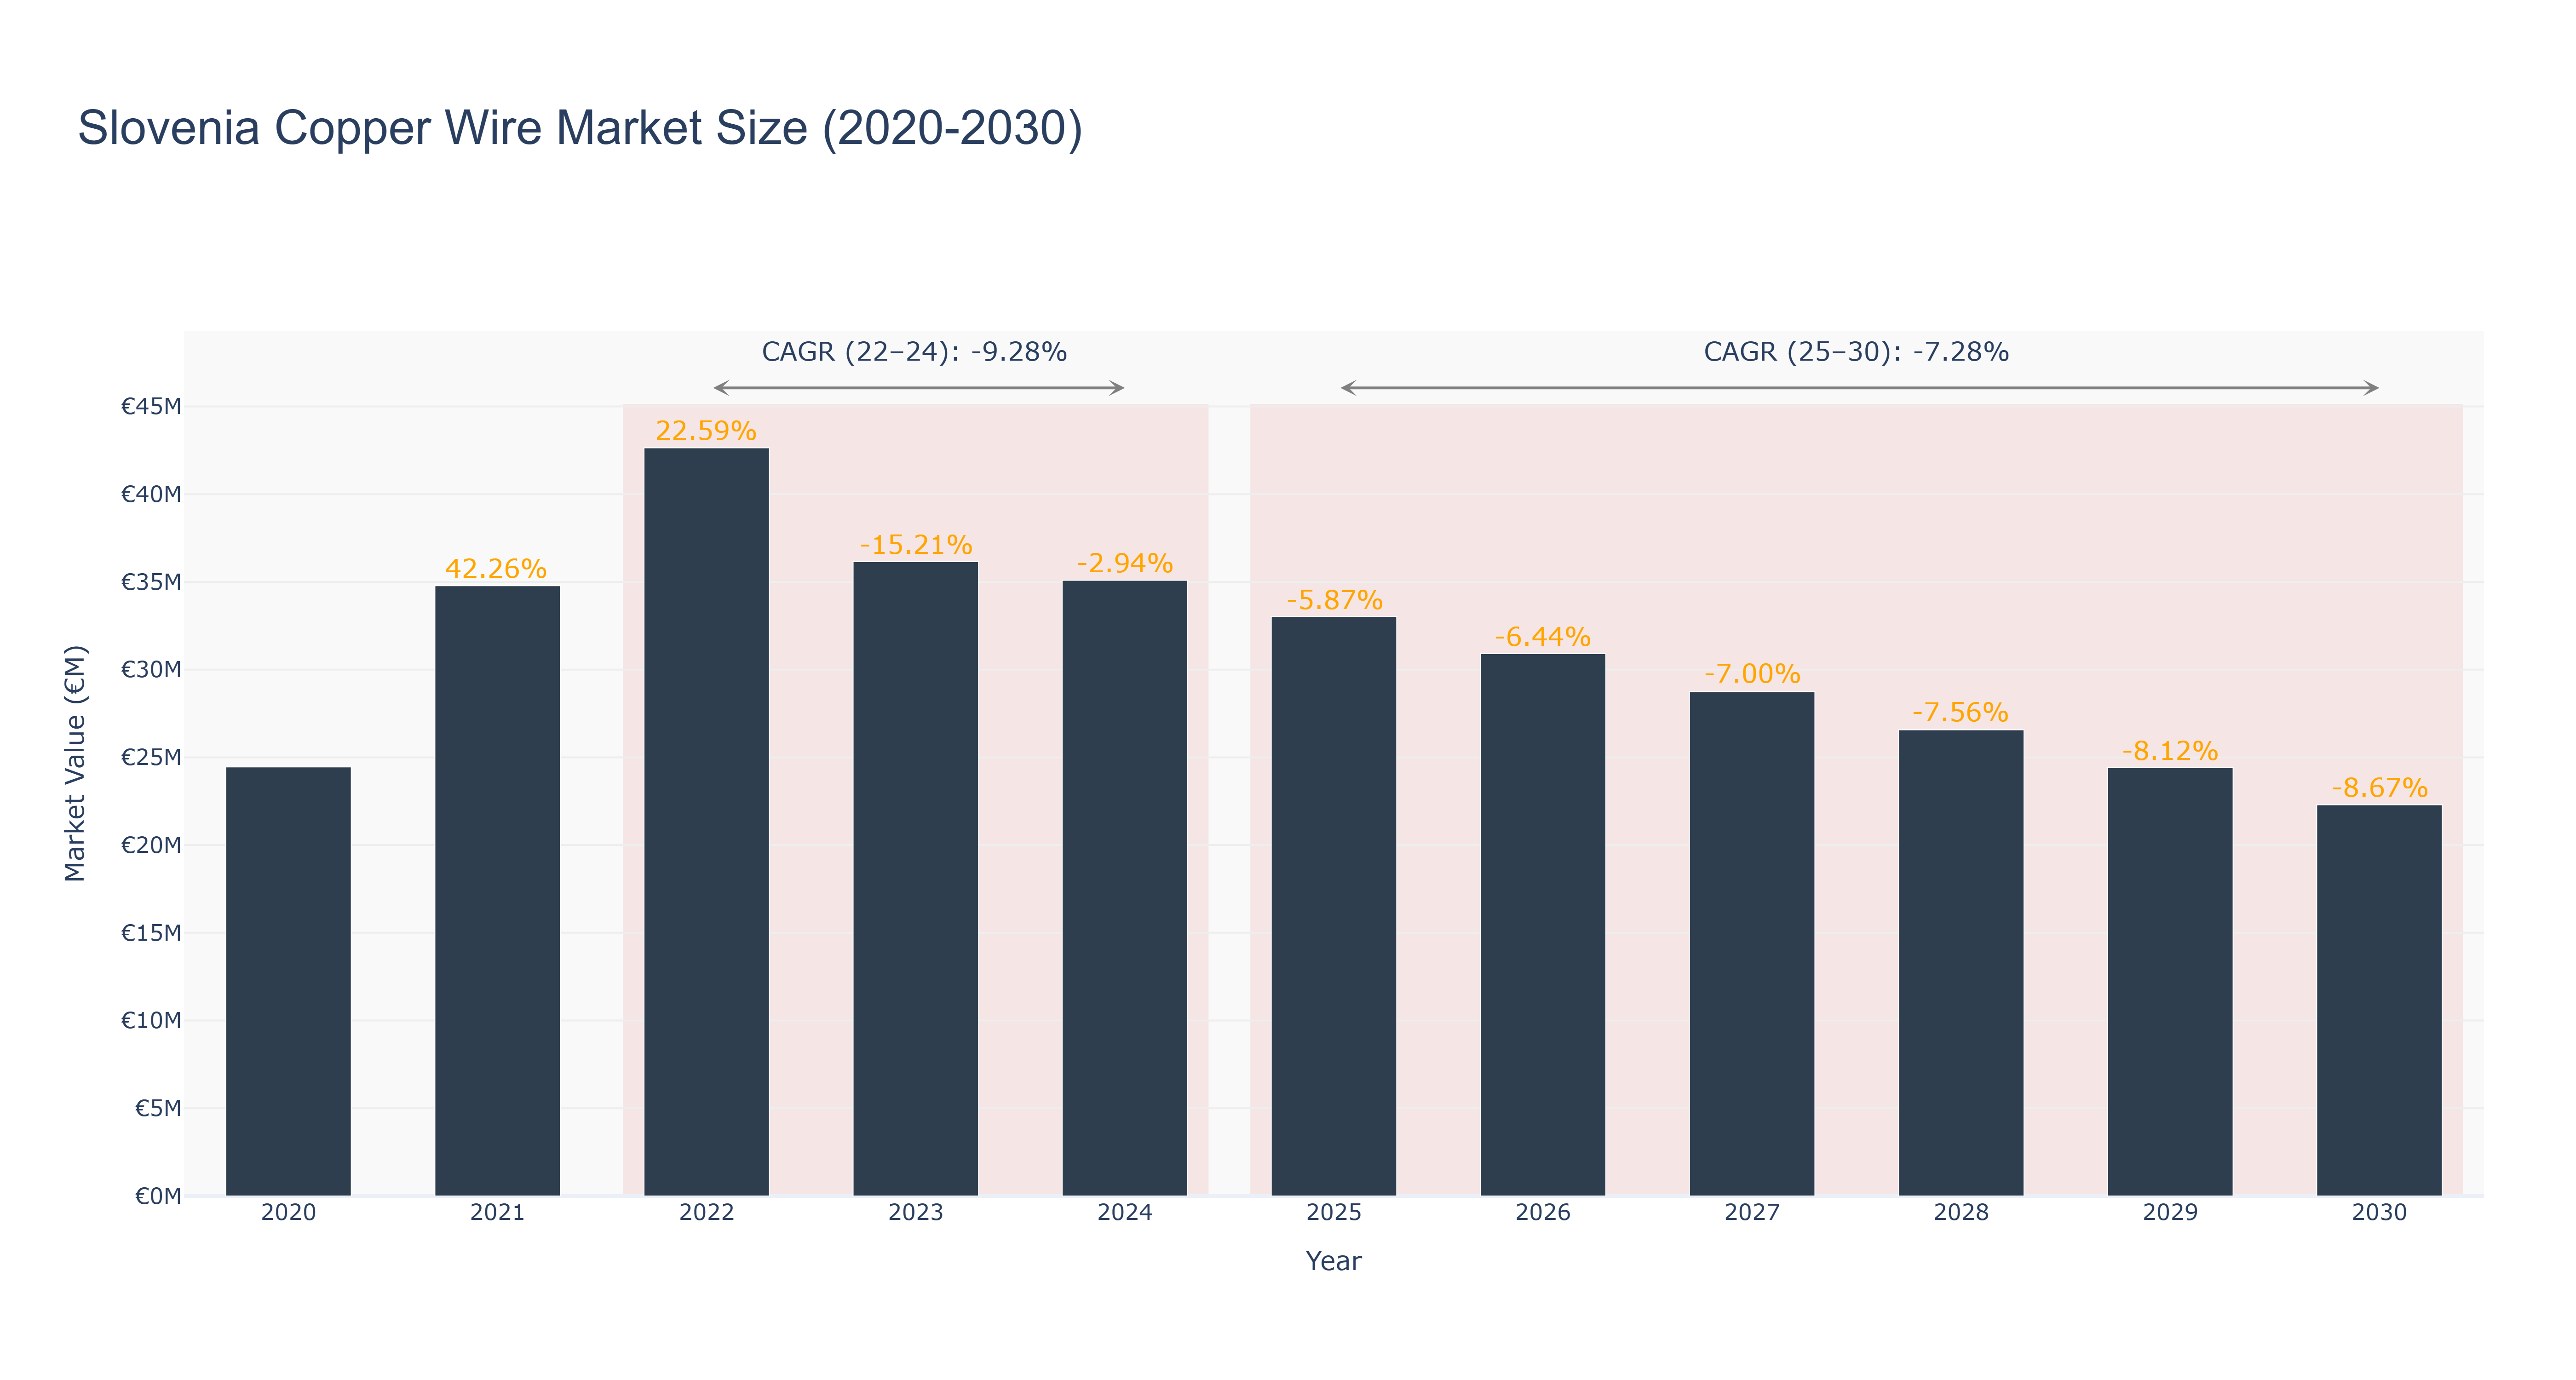
Slovenia's Copper Wire Market experienced a peak market size of €42.64 million in 2022, followed by a decline to €35.09 million in 2024. The market is forecasted to further decrease to €22.29 million by 2030, with a CAGR of -7.28% from 2025 to 2030. The downward trend in market size can be attributed to global economic challenges impacting demand for copper products, coupled with technological advancements leading to more efficient use of materials. Despite the current downturn, Slovenia's Copper Wire Market is expected to witness future developments in sustainable production processes and increased investments in renewable energy infrastructure, which could potentially drive market growth in the long term. Industry drivers like environmental regulations and the shift towards green technologies will likely play a significant role in shaping the market's trajectory moving forward.
Slovenia Copper Wire Market: Production & Trade Performance (2019-2025)
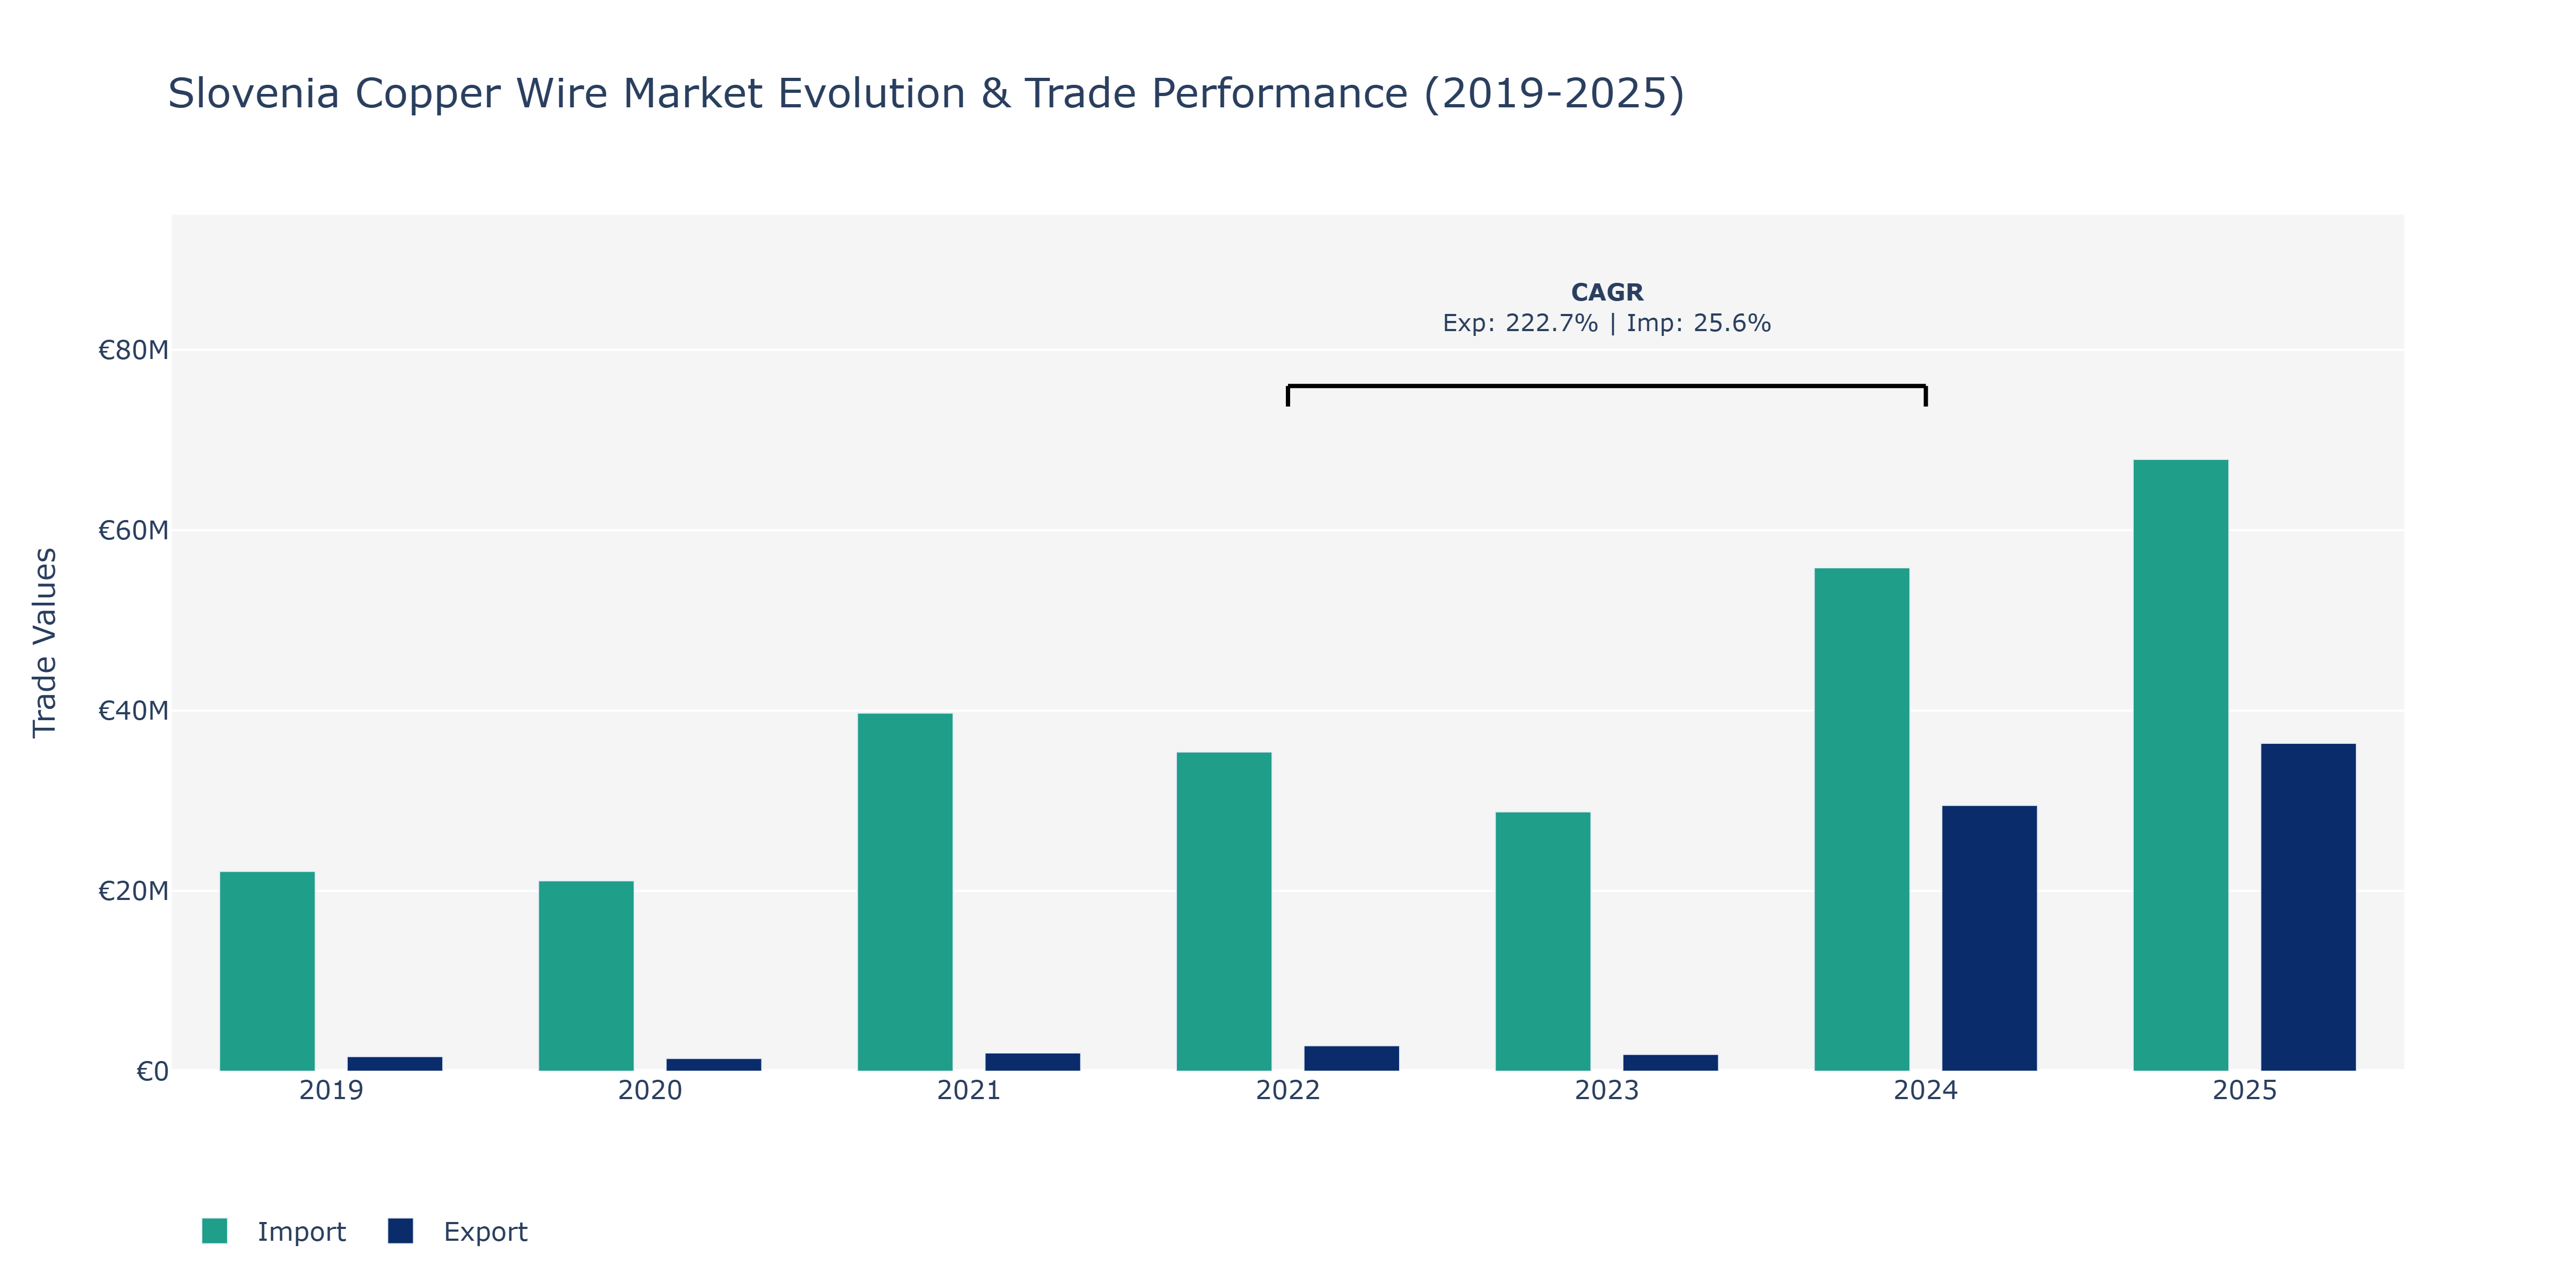
Between 2019 and 2025, the Slovenia Copper Wire Market experienced noteworthy fluctuations in exports and imports. Exports saw a decline from €1.62 million in 2019 to €1.41 million in 2020, followed by a significant increase to €2.83 million in 2022, reaching a peak at €36.36 million in 2025. Conversely, imports showed a more consistent trend, increasing from €22.15 million in 2019 to €67.85 million in 2025. The peak points for imports were observed in 2025, aligning with the surge in Export value. The surge in exports can be attributed to increased global demand for copper wire due to infrastructural developments and the transition to renewable energy sources, driving the production and export of copper wire products. The steady growth in imports reflects a continuous demand for raw materials and components necessary for the copper wire manufacturing industry, indicating a robust market with consistent import requirements to support domestic production.
Key Highlights of the Report:
- Slovenia Copper Wire Market Outlook
- Market Size of Slovenia Copper Wire Market, 2025
- Forecast of Slovenia Copper Wire Market, 2032
- Historical Data and Forecast of Slovenia Copper Wire Revenues & Volume for the Period 2022-2032F
- Slovenia Copper Wire Market Trend Evolution
- Slovenia Copper Wire Market Drivers and Challenges
- Slovenia Copper Wire Price Trends
- Slovenia Copper Wire Porter`s Five Forces
- Slovenia Copper Wire Industry Life Cycle
- Historical Data and Forecast of Slovenia Copper Wire Market Revenues & Volume By Application for the Period 2022-2032F
- Historical Data and Forecast of Slovenia Copper Wire Market Revenues & Volume By Building and Construction for the Period 2022-2032F
- Historical Data and Forecast of Slovenia Copper Wire Market Revenues & Volume By Telecommunication and Power for the Period 2022-2032F
- Historical Data and Forecast of Slovenia Copper Wire Market Revenues & Volume By Transport for the Period 2022-2032F
- Historical Data and Forecast of Slovenia Copper Wire Market Revenues & Volume By Industrial Equipment for the Period 2022-2032F
- Historical Data and Forecast of Slovenia Copper Wire Market Revenues & Volume By Electronics for the Period 2022-2032F
- Historical Data and Forecast of Slovenia Copper Wire Market Revenues & Volume By Others for the Period 2022-2032F
- Slovenia Copper Wire Import Export Trade Statistics
- Market Opportunity Assessment By Application
- Slovenia Copper Wire Top Companies Market Share
- Slovenia Copper Wire Competitive Benchmarking By Technical and Operational Parameters
- Slovenia Copper Wire Company Profiles
- Slovenia Copper Wire Key Strategic Recommendations
Frequently Asked Questions About the Market Study (FAQs):
6Wresearch actively monitors the Slovenia Copper Wire Market and publishes its comprehensive annual report, highlighting emerging trends, growth drivers, revenue analysis, and forecast outlook. Our insights help businesses to make data-backed strategic decisions with ongoing market dynamics. Our analysts track relevent industries related to the Slovenia Copper Wire Market, allowing our clients with actionable intelligence and reliable forecasts tailored to emerging regional needs.
Yes, we provide customisation as per your requirements. To learn more, feel free to contact us on sales@6wresearch.com
1 Executive Summary |
2 Introduction |
2.1 Key Highlights of the Report |
2.2 Report Description |
2.3 Market Scope & Segmentation |
2.4 Research Methodology |
2.5 Assumptions |
3 Slovenia Copper Wire Market Overview |
3.1 Slovenia Country Macro Economic Indicators |
3.2 Slovenia Copper Wire Market Revenues & Volume, 2022 & 2032F |
3.3 Slovenia Copper Wire Market - Industry Life Cycle |
3.4 Slovenia Copper Wire Market - Porter's Five Forces |
3.5 Slovenia Copper Wire Market Revenues & Volume Share, By Application, 2022 & 2032F |
4 Slovenia Copper Wire Market Dynamics |
4.1 Impact Analysis |
4.2 Market Drivers |
4.2.1 Increasing demand for electricity and telecommunications infrastructure. |
4.2.2 Growth in the construction and automotive industries. |
4.2.3 Technological advancements driving the adoption of copper wire for various applications. |
4.3 Market Restraints |
4.3.1 Fluctuating raw material prices impacting production costs. |
4.3.2 Competition from alternative materials like aluminum and fiber optics. |
4.3.3 Environmental regulations and sustainability concerns affecting the production and usage of copper wire. |
5 Slovenia Copper Wire Market Trends |
6 Slovenia Copper Wire Market Segmentations |
6.1 Slovenia Copper Wire Market, By Application |
6.1.1 Overview and Analysis |
6.1.2 Slovenia Copper Wire Market Revenues & Volume, By Building and Construction, 2022-2032F |
6.1.3 Slovenia Copper Wire Market Revenues & Volume, By Telecommunication and Power, 2022-2032F |
6.1.4 Slovenia Copper Wire Market Revenues & Volume, By Transport, 2022-2032F |
6.1.5 Slovenia Copper Wire Market Revenues & Volume, By Industrial Equipment, 2022-2032F |
6.1.6 Slovenia Copper Wire Market Revenues & Volume, By Electronics, 2022-2032F |
6.1.7 Slovenia Copper Wire Market Revenues & Volume, By Others, 2022-2032F |
7 Slovenia Copper Wire Market Import-Export Trade Statistics |
7.1 Slovenia Copper Wire Market Export to Major Countries |
7.2 Slovenia Copper Wire Market Imports from Major Countries |
8 Slovenia Copper Wire Market Key Performance Indicators |
8.1 Average selling price of copper wire. |
8.2 Percentage of copper wire used in new construction projects. |
8.3 Number of patents filed for copper wire technology innovations. |
8.4 Percentage of copper wire recycling rate in Slovenia. |
8.5 Investment in research and development for copper wire products. |
9 Slovenia Copper Wire Market - Opportunity Assessment |
9.1 Slovenia Copper Wire Market Opportunity Assessment, By Application, 2022 & 2032F |
10 Slovenia Copper Wire Market - Competitive Landscape |
10.1 Slovenia Copper Wire Market Revenue Share, By Companies, 2025 |
10.2 Slovenia Copper Wire Market Competitive Benchmarking, By Operating and Technical Parameters |
11 Company Profiles |
12 Recommendations | 13 Disclaimer |
Global Go To Market Strategy - 2030
Export potential enables firms to identify high-growth global markets with greater confidence by combining advanced trade intelligence with a structured quantitative methodology. The framework analyzes emerging demand trends and country-level import patterns while integrating macroeconomic and trade datasets such as GDP and population forecasts, bilateral import–export flows, tariff structures, elasticity differentials between developed and developing economies, geographic distance, and import demand projections. Using weighted trade values from 2020–2024 as the base period to project country-to-country export potential for 2030, these inputs are operationalized through calculated drivers such as gravity model parameters, tariff impact factors, and projected GDP per-capita growth. Through an analysis of hidden potentials, demand hotspots, and market conditions that are most favorable to success, this method enables firms to focus on target countries, maximize returns, and global expansion with data, backed by accuracy.
By factoring in the projected importer demand gap that is currently unmet and could be potential opportunity, it identifies the potential for the Exporter (Country) among 190 countries, against the general trade analysis, which identifies the biggest importer or exporter.
To discover high-growth global markets and optimize your business strategy:
Click Here
Pricing
- Single User License$ 1,995
- Department License$ 2,400
- Site License$ 3,120
- Global License$ 3,795

Leadership Perspectives from Industry Events
Search
Thought Leadership and Analyst Meet


Our Clients
6WResearch In News
- Doha a strategic location for EV manufacturing hub: IPA Qatar
- Demand for luxury TVs surging in the GCC, says Samsung
- Empowering Growth: The Thriving Journey of Bangladesh’s Cable Industry
- Demand for luxury TVs surging in the GCC, says Samsung
- Video call with a traditional healer? Once unthinkable, it’s now common in South Africa
- Intelligent Buildings To Smooth GCC’s Path To Net Zero
Latest Reports
- Taiwan Airport Wireless Infrastructure Market (2026-2032)
- Vietnam Airport Wireless Infrastructure Market (2026-2032)
- Thailand Airport Wireless Infrastructure Market (2026-2032)
- South Korea Airport Wireless Infrastructure Market (2026-2032)
- Romania Airport Wireless Infrastructure Market (2026-2032)
- Qatar Airport Wireless Infrastructure Market (2026-2032)
- Philippines Airport Wireless Infrastructure Market (2026-2032)
- Japan Airport Wireless Infrastructure Market (2026-2032)
- Taiwan Airport Winter Services Market (2026-2032)
- Vietnam Airport Winter Services Market (2026-2032)
Industry Events and Analyst Meet

HIMTEX 2026

India Refining Summit 2026

India EV Show 2026

EV tech India Expo 2026

Auto Tech Asia 2026
Whitepaper
- Middle East & Africa Commercial Security Market Click here to view more.
- Middle East & Africa Fire Safety Systems & Equipment Market Click here to view more.
- GCC Drone Market Click here to view more.
- Middle East Lighting Fixture Market Click here to view more.
- GCC Physical & Perimeter Security Market Click here to view more.