Slovenia Dosimeter Market (2026-2032) | Share, Growth, Trends, Companies, Size & Revenue, Industry, Outlook, Value, Forecast, Competitive Landscape, Analysis, Segmentation
Market Forecast By Type (Electronic Personal Dosimeter (EPD), Thermoluminescent Dosimeter (TLD), Optically Stimulated Luminescence Dosimeter (OSLD), Film Badge Dosimeter, Others), By Application (Active, Passive), By End Use (Healthcare, Oil and Gas, Mining, Manufacturing, Others) And Competitive Landscape
| Product Code: ETC9315616 | Publication Date: Sep 2024 | Updated Date: Apr 2026 | Product Type: Market Research Report | |
| Publisher: 6Wresearch | Author: Sumit Sagar | No. of Pages: 75 | No. of Figures: 35 | No. of Tables: 20 |
Slovenia Dosimeter Market Size (2020-2030)
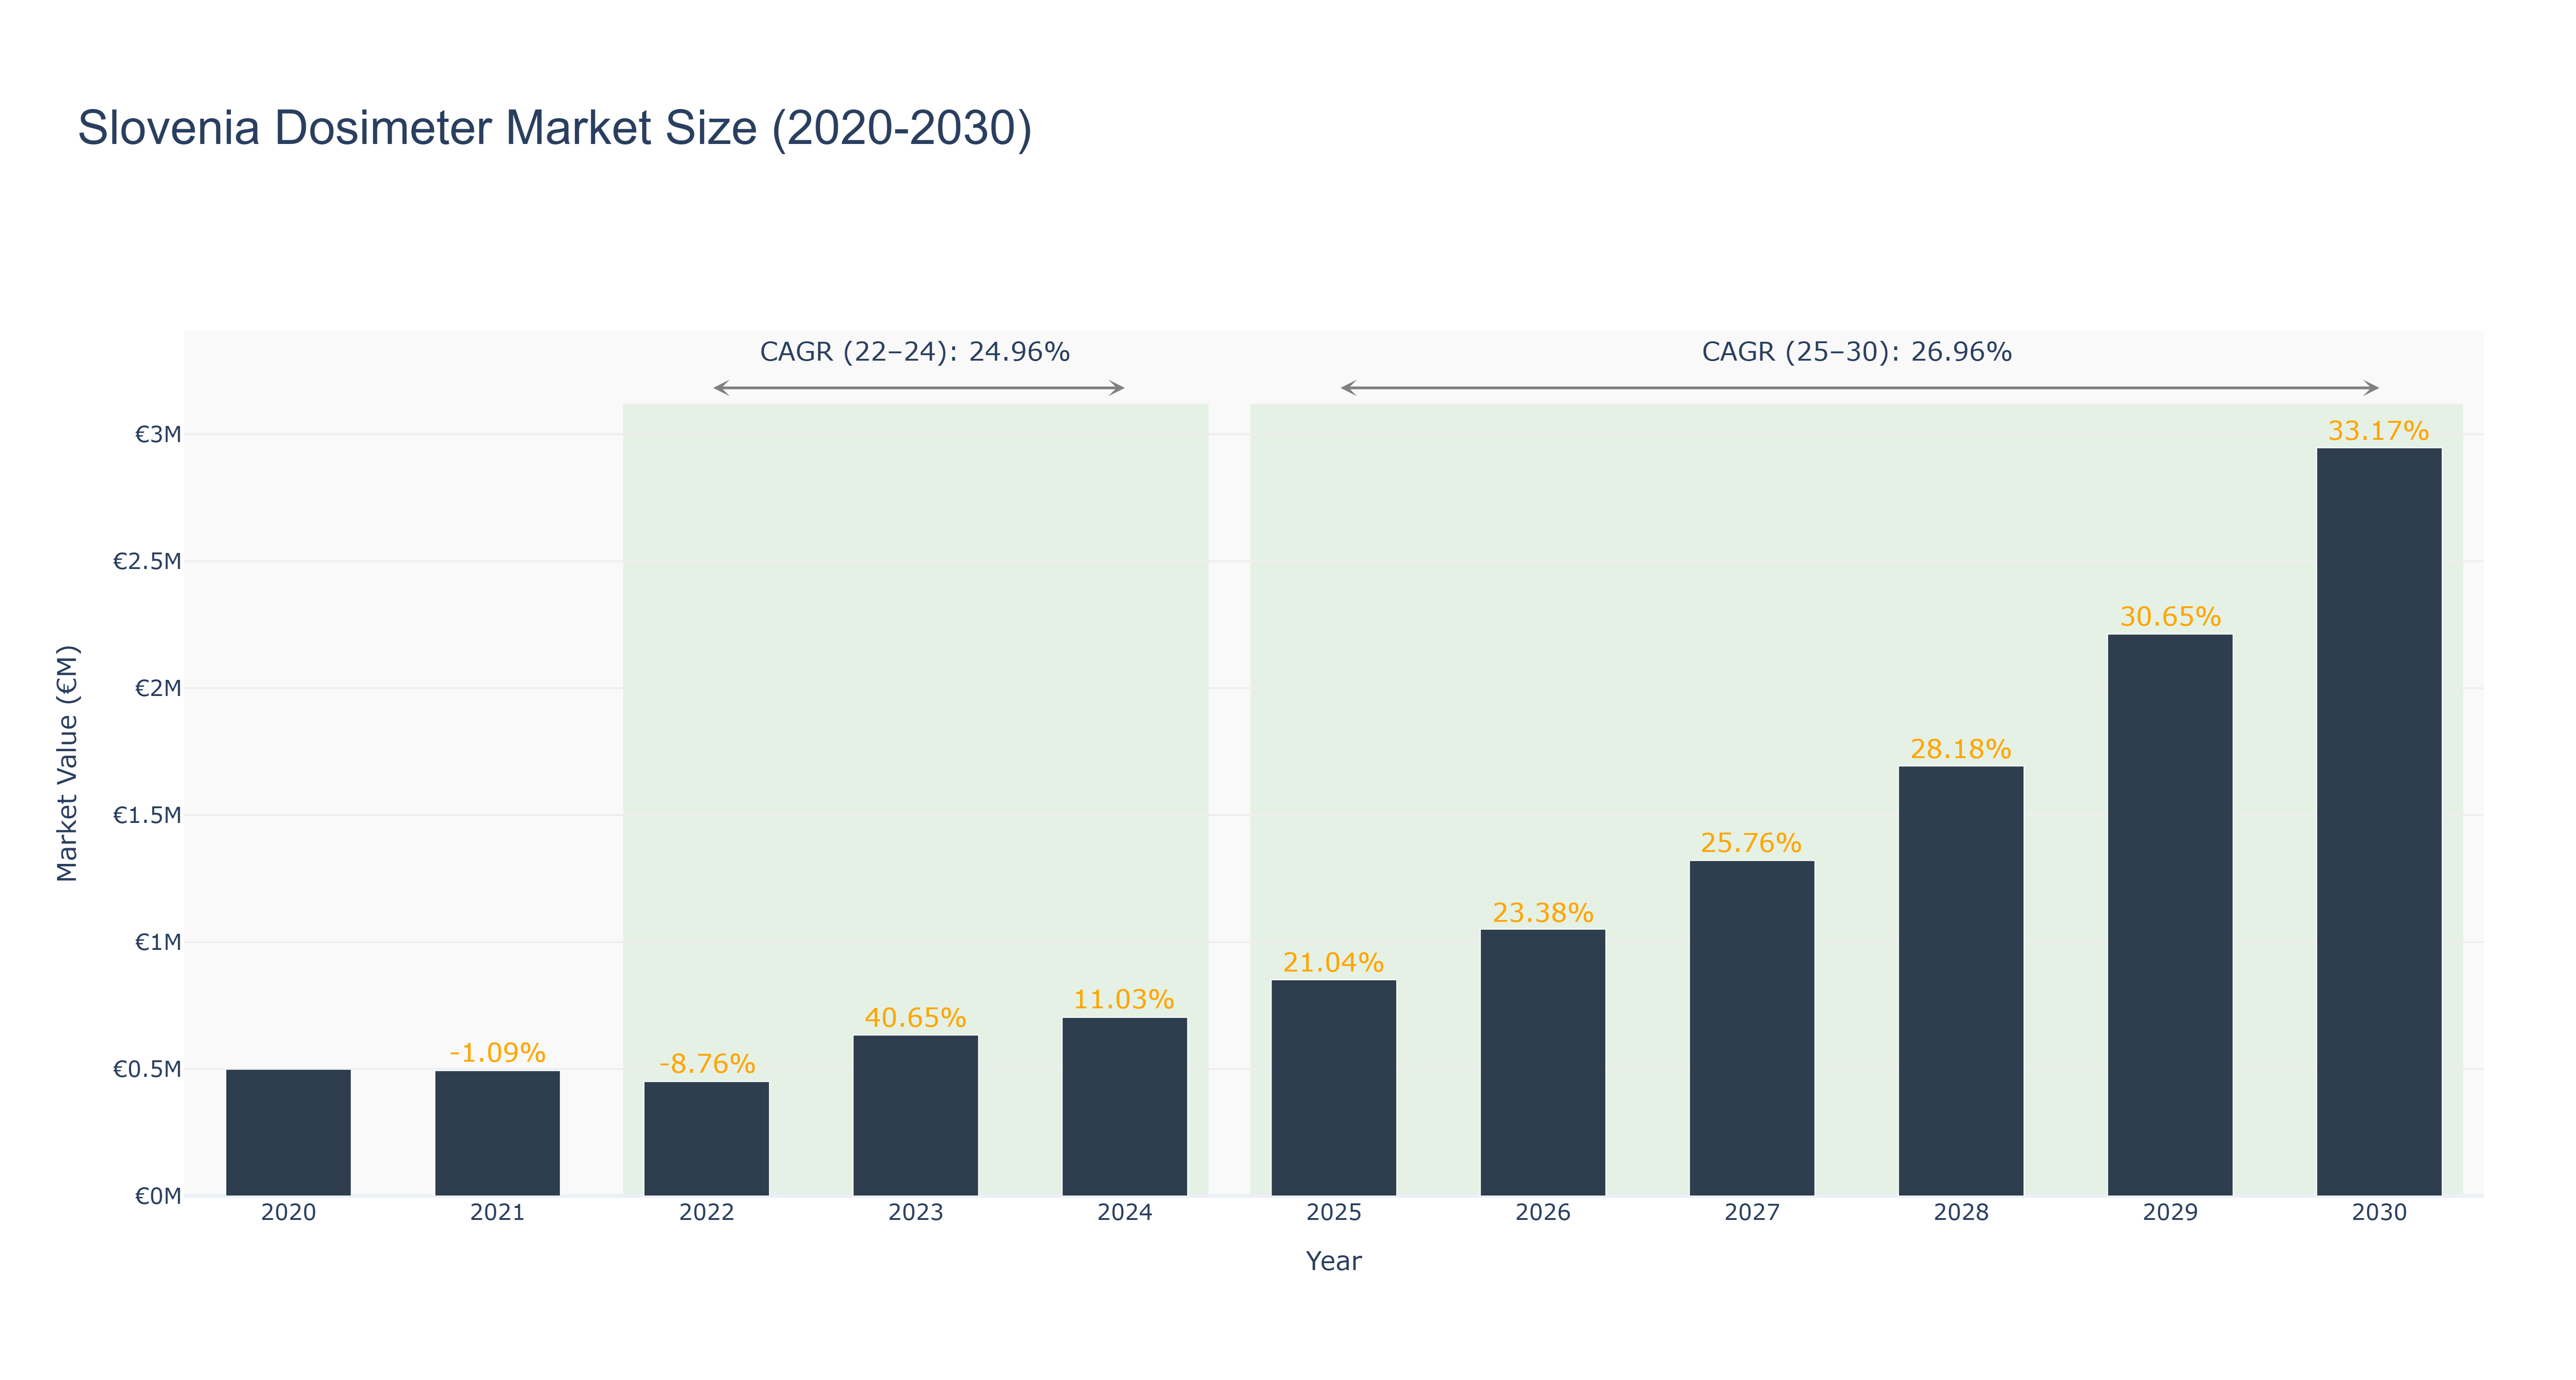
The Slovenia Dosimeter Market experienced a gradual decline in market size from €0.50 million in 2020 to €0.45 million in 2022, attributed to economic uncertainties during that period. However, from 2023 onwards, the market witnessed significant growth, reaching €2.95 million in 2030, driven by technological advancements and increased demand for dosimeter products. The market's Compound Annual Growth Rate (CAGR) for the period 2022-2024 was 24.96%, while for 2025-2030, it is projected to be 26.96%. This growth trajectory indicates a promising future for the dosimeter market in Slovenia. Looking ahead, upcoming projects in radiation monitoring infrastructure enhancement are expected to further boost market growth and solidify Slovenia's position in the dosimeter market landscape.
Slovenia Dosimeter Market: Production & Trade Performance (2019-2025)
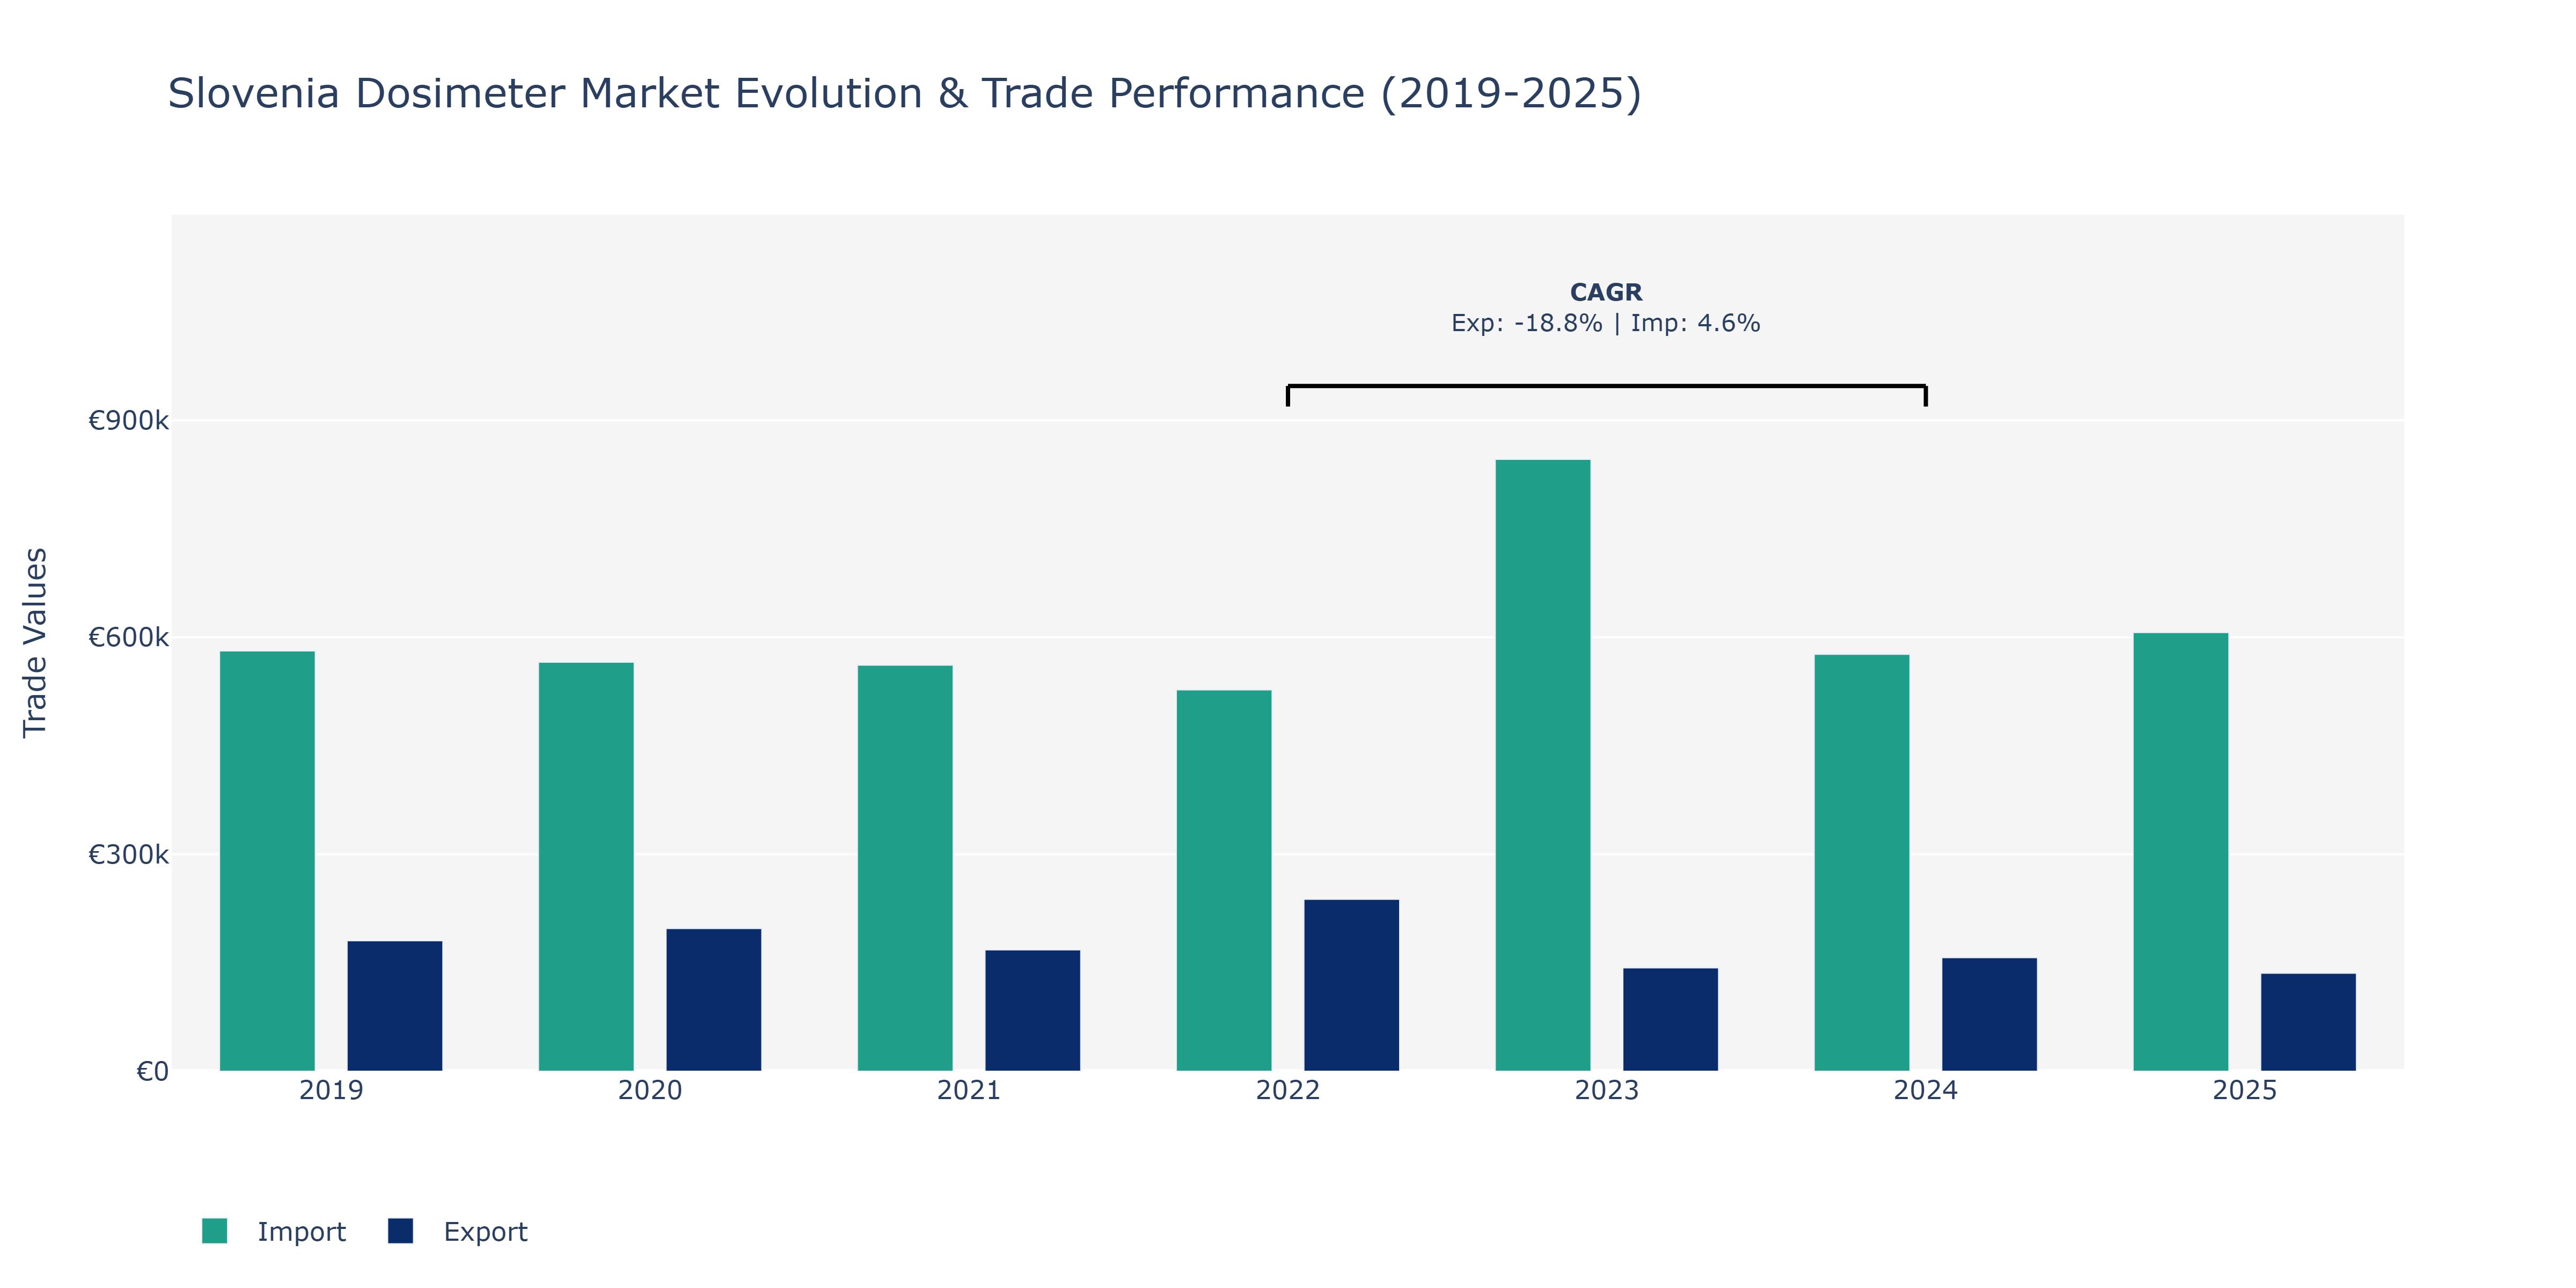
In the Slovenia Dosimeter Market, from 2019 to 2025, Exports experienced fluctuations, starting at €180.44 thousand in 2019, increasing to €237.69 thousand in 2022, before declining to €135.49 thousand in 2025. On the other hand, Imports fluctuated as well, with values of €581.18 thousand in 2019, declining to €527.26 thousand in 2022, and then peaking at €846.04 thousand in 2023. The peak in 2023 for Imports could be attributed to increased demand for advanced dosimeter technologies or possibly strategic partnerships with international suppliers. The fluctuating trend in Exports may be due to changing market dynamics, variations in global demand, or shifts in export policies impacting the dosimeter industry. The decline in Exports from 2022 to 2025 could indicate challenges in maintaining competitiveness or shifts in export destinations. The fluctuations in Imports reflect the market's responsiveness to technological advancements and regulatory requirements, influencing the need for imported dosimeter components or products.
Key Highlights of the Report:
- Slovenia Dosimeter Market Outlook
- Market Size of Slovenia Dosimeter Market, 2025
- Forecast of Slovenia Dosimeter Market, 2032
- Historical Data and Forecast of Slovenia Dosimeter Revenues & Volume for the Period 2022-2032F
- Slovenia Dosimeter Market Trend Evolution
- Slovenia Dosimeter Market Drivers and Challenges
- Slovenia Dosimeter Price Trends
- Slovenia Dosimeter Porter's Five Forces
- Slovenia Dosimeter Industry Life Cycle
- Historical Data and Forecast of Slovenia Dosimeter Market Revenues & Volume By Type for the Period 2022-2032F
- Historical Data and Forecast of Slovenia Dosimeter Market Revenues & Volume By Electronic Personal Dosimeter (EPD) for the Period 2022-2032F
- Historical Data and Forecast of Slovenia Dosimeter Market Revenues & Volume By Thermoluminescent Dosimeter (TLD) for the Period 2022-2032F
- Historical Data and Forecast of Slovenia Dosimeter Market Revenues & Volume By Optically Stimulated Luminescence Dosimeter (OSLD) for the Period 2022-2032F
- Historical Data and Forecast of Slovenia Dosimeter Market Revenues & Volume By Film Badge Dosimeter for the Period 2022-2032F
- Historical Data and Forecast of Slovenia Dosimeter Market Revenues & Volume By Others for the Period 2022-2032F
- Historical Data and Forecast of Slovenia Dosimeter Market Revenues & Volume By Application for the Period 2022-2032F
- Historical Data and Forecast of Slovenia Dosimeter Market Revenues & Volume By Active for the Period 2022-2032F
- Historical Data and Forecast of Slovenia Dosimeter Market Revenues & Volume By Passive for the Period 2022-2032F
- Historical Data and Forecast of Slovenia Dosimeter Market Revenues & Volume By End Use for the Period 2022-2032F
- Historical Data and Forecast of Slovenia Dosimeter Market Revenues & Volume By Healthcare for the Period 2022-2032F
- Historical Data and Forecast of Slovenia Dosimeter Market Revenues & Volume By Oil and Gas for the Period 2022-2032F
- Historical Data and Forecast of Slovenia Dosimeter Market Revenues & Volume By Mining for the Period 2022-2032F
- Historical Data and Forecast of Slovenia Dosimeter Market Revenues & Volume By Manufacturing for the Period 2022-2032F
- Historical Data and Forecast of Slovenia Dosimeter Market Revenues & Volume By Others for the Period 2022-2032F
- Slovenia Dosimeter Import Export Trade Statistics
- Market Opportunity Assessment By Type
- Market Opportunity Assessment By Application
- Market Opportunity Assessment By End Use
- Slovenia Dosimeter Top Companies Market Share
- Slovenia Dosimeter Competitive Benchmarking By Technical and Operational Parameters
- Slovenia Dosimeter Company Profiles
- Slovenia Dosimeter Key Strategic Recommendations
Frequently Asked Questions About the Market Study (FAQs):
6Wresearch actively monitors the Slovenia Dosimeter Market and publishes its comprehensive annual report, highlighting emerging trends, growth drivers, revenue analysis, and forecast outlook. Our insights help businesses to make data-backed strategic decisions with ongoing market dynamics. Our analysts track relevent industries related to the Slovenia Dosimeter Market, allowing our clients with actionable intelligence and reliable forecasts tailored to emerging regional needs.
Yes, we provide customisation as per your requirements. To learn more, feel free to contact us on sales@6wresearch.com
1 Executive Summary |
2 Introduction |
2.1 Key Highlights of the Report |
2.2 Report Description |
2.3 Market Scope & Segmentation |
2.4 Research Methodology |
2.5 Assumptions |
3 Slovenia Dosimeter Market Overview |
3.1 Slovenia Country Macro Economic Indicators |
3.2 Slovenia Dosimeter Market Revenues & Volume, 2022 & 2032F |
3.3 Slovenia Dosimeter Market - Industry Life Cycle |
3.4 Slovenia Dosimeter Market - Porter's Five Forces |
3.5 Slovenia Dosimeter Market Revenues & Volume Share, By Type, 2022 & 2032F |
3.6 Slovenia Dosimeter Market Revenues & Volume Share, By Application, 2022 & 2032F |
3.7 Slovenia Dosimeter Market Revenues & Volume Share, By End Use, 2022 & 2032F |
4 Slovenia Dosimeter Market Dynamics |
4.1 Impact Analysis |
4.2 Market Drivers |
4.2.1 Increasing awareness about the importance of radiation safety in various industries |
4.2.2 Stringent regulations mandating the use of dosimeters in workplaces |
4.2.3 Growing adoption of dosimeters in healthcare settings for monitoring radiation exposure |
4.3 Market Restraints |
4.3.1 High initial cost of dosimeter devices and maintenance |
4.3.2 Lack of skilled professionals for proper handling and interpretation of dosimeter data |
4.3.3 Limited availability of advanced dosimeter technologies in the market |
5 Slovenia Dosimeter Market Trends |
6 Slovenia Dosimeter Market, By Types |
6.1 Slovenia Dosimeter Market, By Type |
6.1.1 Overview and Analysis |
6.1.2 Slovenia Dosimeter Market Revenues & Volume, By Type, 2022-2032F |
6.1.3 Slovenia Dosimeter Market Revenues & Volume, By Electronic Personal Dosimeter (EPD), 2022-2032F |
6.1.4 Slovenia Dosimeter Market Revenues & Volume, By Thermoluminescent Dosimeter (TLD), 2022-2032F |
6.1.5 Slovenia Dosimeter Market Revenues & Volume, By Optically Stimulated Luminescence Dosimeter (OSLD), 2022-2032F |
6.1.6 Slovenia Dosimeter Market Revenues & Volume, By Film Badge Dosimeter, 2022-2032F |
6.1.7 Slovenia Dosimeter Market Revenues & Volume, By Others, 2022-2032F |
6.2 Slovenia Dosimeter Market, By Application |
6.2.1 Overview and Analysis |
6.2.2 Slovenia Dosimeter Market Revenues & Volume, By Active, 2022-2032F |
6.2.3 Slovenia Dosimeter Market Revenues & Volume, By Passive, 2022-2032F |
6.3 Slovenia Dosimeter Market, By End Use |
6.3.1 Overview and Analysis |
6.3.2 Slovenia Dosimeter Market Revenues & Volume, By Healthcare, 2022-2032F |
6.3.3 Slovenia Dosimeter Market Revenues & Volume, By Oil and Gas, 2022-2032F |
6.3.4 Slovenia Dosimeter Market Revenues & Volume, By Mining, 2022-2032F |
6.3.5 Slovenia Dosimeter Market Revenues & Volume, By Manufacturing, 2022-2032F |
6.3.6 Slovenia Dosimeter Market Revenues & Volume, By Others, 2022-2032F |
7 Slovenia Dosimeter Market Import-Export Trade Statistics |
7.1 Slovenia Dosimeter Market Export to Major Countries |
7.2 Slovenia Dosimeter Market Imports from Major Countries |
8 Slovenia Dosimeter Market Key Performance Indicators |
8.1 Average time taken for dosimeter deployment and data analysis |
8.2 Percentage increase in dosimeter adoption across different industries |
8.3 Number of regulatory compliance checks met by organizations using dosimeters |
9 Slovenia Dosimeter Market - Opportunity Assessment |
9.1 Slovenia Dosimeter Market Opportunity Assessment, By Type, 2022 & 2032F |
9.2 Slovenia Dosimeter Market Opportunity Assessment, By Application, 2022 & 2032F |
9.3 Slovenia Dosimeter Market Opportunity Assessment, By End Use, 2022 & 2032F |
10 Slovenia Dosimeter Market - Competitive Landscape |
10.1 Slovenia Dosimeter Market Revenue Share, By Companies, 2025 |
10.2 Slovenia Dosimeter Market Competitive Benchmarking, By Operating and Technical Parameters |
11 Company Profiles |
12 Recommendations |
13 Disclaimer |
Export potential assessment - trade Analytics for 2030
Export potential enables firms to identify high-growth global markets with greater confidence by combining advanced trade intelligence with a structured quantitative methodology. The framework analyzes emerging demand trends and country-level import patterns while integrating macroeconomic and trade datasets such as GDP and population forecasts, bilateral import–export flows, tariff structures, elasticity differentials between developed and developing economies, geographic distance, and import demand projections. Using weighted trade values from 2020–2024 as the base period to project country-to-country export potential for 2030, these inputs are operationalized through calculated drivers such as gravity model parameters, tariff impact factors, and projected GDP per-capita growth. Through an analysis of hidden potentials, demand hotspots, and market conditions that are most favorable to success, this method enables firms to focus on target countries, maximize returns, and global expansion with data, backed by accuracy.
By factoring in the projected importer demand gap that is currently unmet and could be potential opportunity, it identifies the potential for the Exporter (Country) among 190 countries, against the general trade analysis, which identifies the biggest importer or exporter.
To discover high-growth global markets and optimize your business strategy:
Click Here
Pricing
- Single User License$ 1,995
- Department License$ 2,400
- Site License$ 3,120
- Global License$ 3,795

Search
Thought Leadership and Analyst Meet


Our Clients
Latest Reports
- Canada Cloud CFD Market (2026-2032) | Size & Revenue, Industry, Growth, Competitive Landscape, Forecast, Segmentation, Value, Outlook, Trends, Share, Analysis, Companies
- Taiwan Food Delivery Platform Market (2026-2032) | Companies, Outlook, Analysis, Trends, Value, Revenue, Segmentation, Share, Forecast, Competitive Landscape, Growth, Size & Forecast
- United Kingdom (UK) Long-term Care Insurance Market (2026-2032) | Growth, Share, Consumer Insights, Drivers, Opportunities, Competition, Pricing Analysis, Segments, Restraints, Companies, Competitive, Value, Outlook, Size, Demand, Analysis, Challenges, Strategic Insights, Investment Trends, Revenue, Trends, Supply, Forecast
- United Kingdom (UK) Long Term Care Market (2026-2032) | Companies, Outlook, Analysis, Trends, Value, Revenue, Segmentation, Share, Forecast, Competitive Landscape, Growth, Size & Forecast
- Iraq Insulation and Waterproofing Market (2026-2032) | Outlook, Drivers, Growth, Size, Share, Industry, Revenue, Trends, Demand, Competitive, Strategic Insights, Opportunities, Segments, Companies, Challenges, Strategy, Consumer Insights, Analysis, Investment Trends, Value, Segmentation, Forecast, Restraints
- India Switchgear Market Outlook (2026-2032) | Size, Share, Trends, Growth, Revenue, Forecast, Analysis, Value, Outlook
- Pakistan Contraceptive Implants Market (2025-2031) | Demand, Growth, Size, Share, Industry, Pricing Analysis, Competitive, Strategic Insights, Strategy, Consumer Insights, Analysis, Investment Trends, Opportunities, Revenue, Segments, Value, Segmentation, Supply, Forecast, Restraints, Outlook, Competition, Drivers, Trends, Companies, Challenges
- Sri Lanka Packaging Market (2026-2032) | Outlook, Competition, Drivers, Trends, Demand, Pricing Analysis, Competitive, Strategic Insights, Companies, Challenges, Strategy, Consumer Insights, Analysis, Investment Trends, Opportunities, Growth, Size, Share, Industry, Revenue, Segments, Value, Segmentation, Supply, Forecast, Restraints
- India Kids Watches Market (2026-2032) | Strategy, Consumer Insights, Analysis, Investment Trends, Opportunities, Growth, Size, Share, Industry, Revenue, Segments, Value, Segmentation, Supply, Forecast, Restraints, Outlook, Competition, Drivers, Trends, Demand, Pricing Analysis, Competitive, Strategic Insights, Companies, Challenges
- Saudi Arabia Core Assurance Service Market (2025-2031) | Strategy, Consumer Insights, Analysis, Investment Trends, Opportunities, Growth, Size, Share, Industry, Revenue, Segments, Value, Segmentation, Supply, Forecast, Restraints, Outlook, Competition, Drivers, Trends, Demand, Pricing Analysis, Competitive, Strategic Insights, Companies, Challenges
Industry Events and Analyst Meet

India EV Show 2026

EV tech India Expo 2026

Auto Tech Asia 2026

Battery Tech India 2026

Smart Production Solutions Guangzhou 2026
Whitepaper
- Middle East & Africa Commercial Security Market Click here to view more.
- Middle East & Africa Fire Safety Systems & Equipment Market Click here to view more.
- GCC Drone Market Click here to view more.
- Middle East Lighting Fixture Market Click here to view more.
- GCC Physical & Perimeter Security Market Click here to view more.
6WResearch In News
- Doha a strategic location for EV manufacturing hub: IPA Qatar
- Demand for luxury TVs surging in the GCC, says Samsung
- Empowering Growth: The Thriving Journey of Bangladesh’s Cable Industry
- Demand for luxury TVs surging in the GCC, says Samsung
- Video call with a traditional healer? Once unthinkable, it’s now common in South Africa
- Intelligent Buildings To Smooth GCC’s Path To Net Zero