Slovenia Gaming Console Market (2026-2032) | Companies, Value, Forecast, Segmentation, Share, Outlook, Industry, Growth, Revenue, Analysis, Trends & Size
Market Forecast By Component (Hardware, Software), By Type (Home Consoles, Handheld Consoles, Hybrid Consoles, Dedicated Consoles, Others), By End-use (Personal, Commercial, Others) And Competitive Landscape
| Product Code: ETC4805391 | Publication Date: Nov 2023 | Updated Date: Apr 2026 | Product Type: Market Research Report | |
| Publisher: 6Wresearch | Author: Shubham Padhi | No. of Pages: 60 | No. of Figures: 30 | No. of Tables: 5 |
Slovenia Gaming Console Market Size (2020-2030)
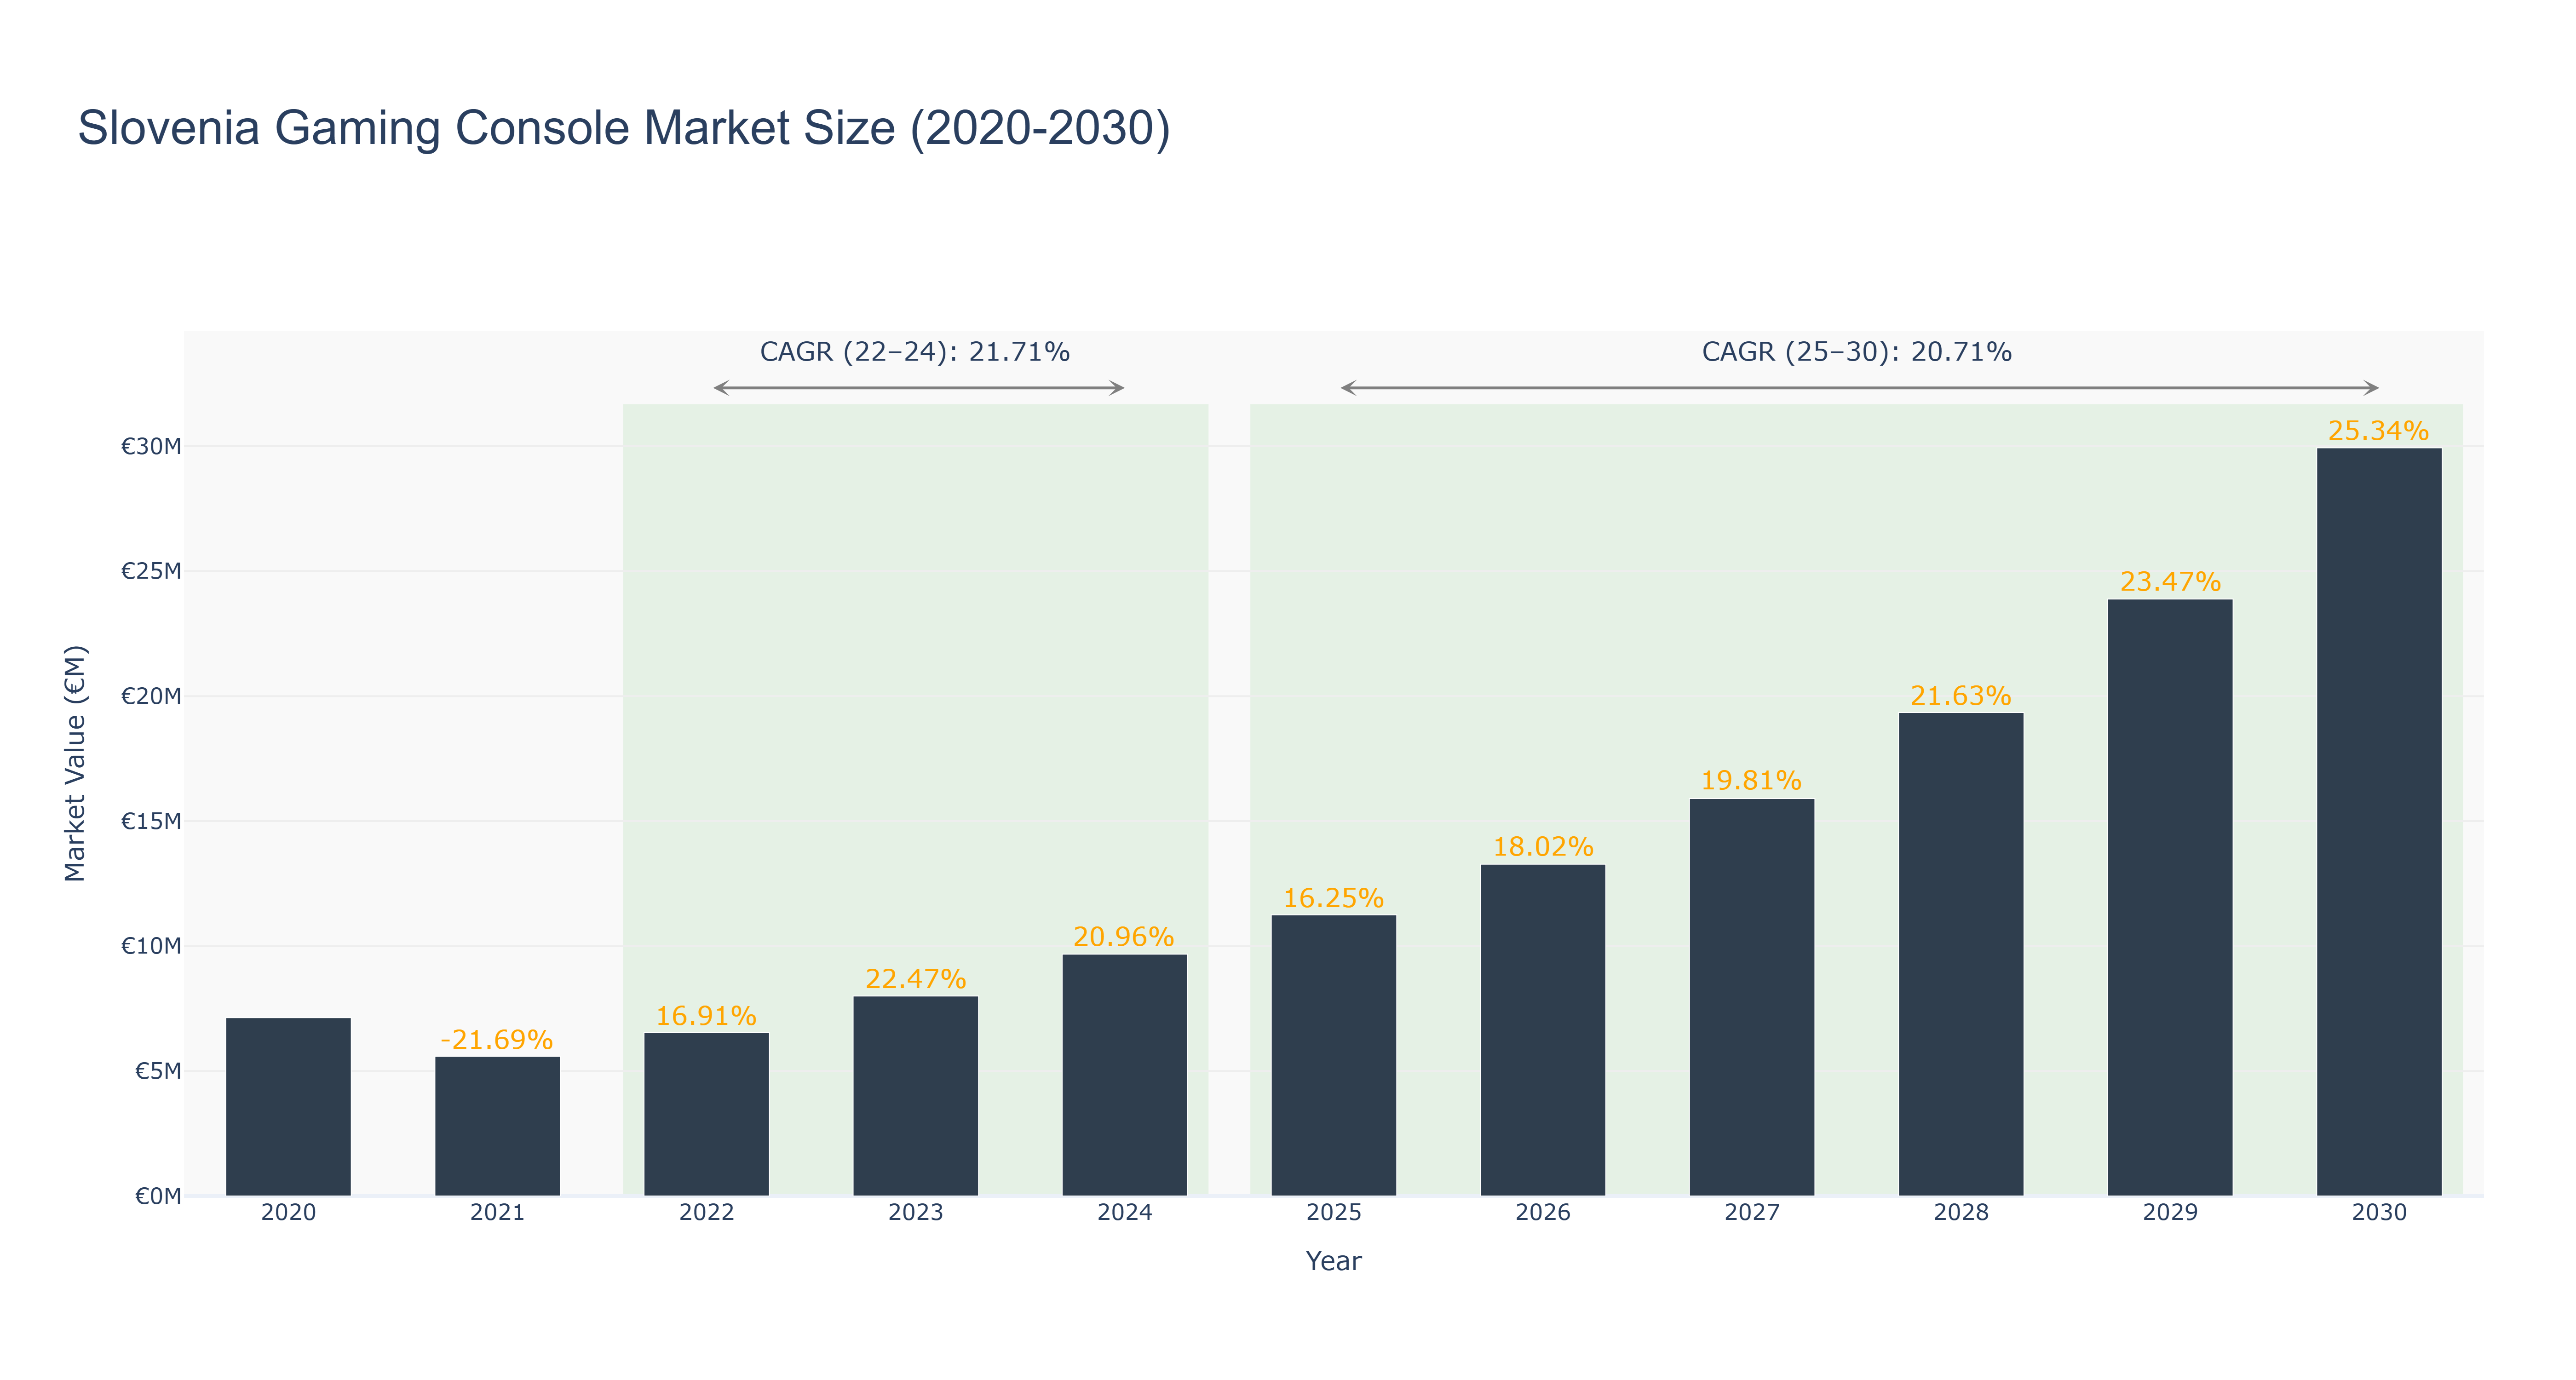
The Slovenia Gaming Console Market witnessed a peak market size of €29.94 million in 2030, with a steady growth trajectory over the years. From 2020 to 2024, the market size increased from €7.13 million to €9.68 million due to a consistent positive growth trend. The forecasted market size from 2025 to 2030 is expected to reach €29.94 million, showcasing a strong CAGR of 20.71% post-2025. The market's notable CAGR of 21.71% from 2022 to 2024 indicates a period of rapid expansion. The industry drivers behind this growth include increasing demand for gaming consoles, technological advancements, and a growing gaming community. Looking ahead, Slovenia is set to launch a national gaming development initiative in 2027, aimed at fostering local talent and innovation in the gaming industry, further boosting market growth and competitiveness.
Slovenia Gaming Console Market: Production & Trade Performance (2019-2025)
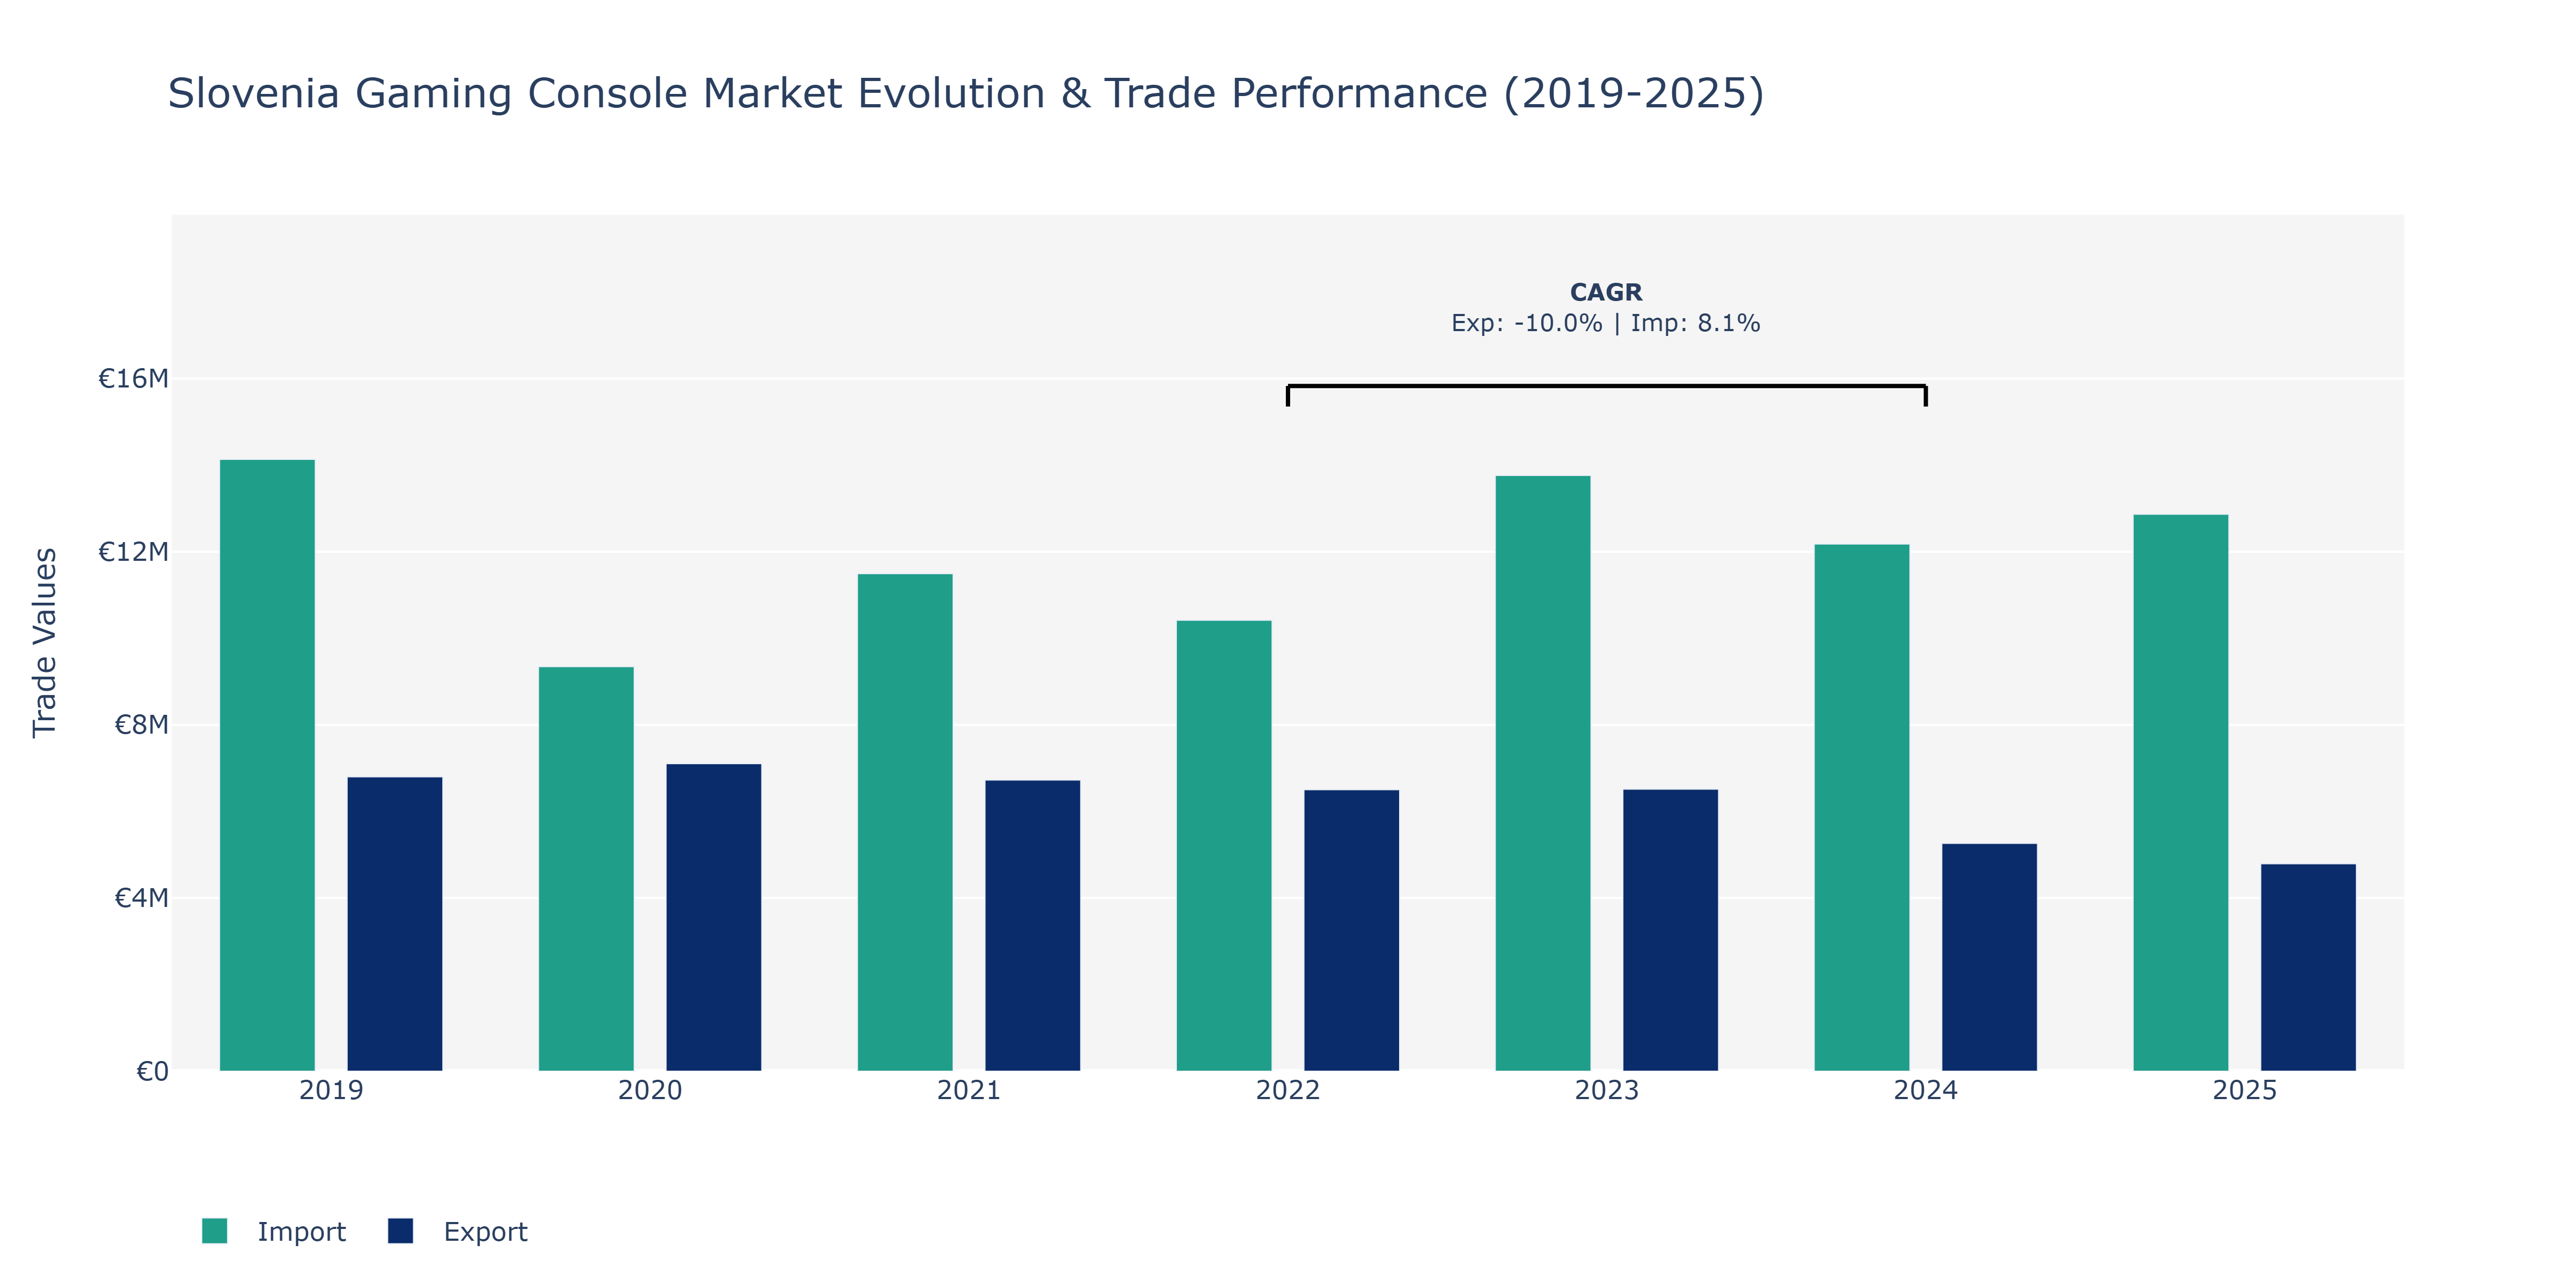
Between 2019 and 2025, Slovenia's Gaming Console Market witnessed fluctuations in both Exports and Imports. Exports started at €6.8 million in 2019, showed a slight increase in 2020 to €7.1 million, but experienced a downward trend thereafter, reaching €4.8 million in 2025. Conversely, Imports began at €14.13 million in 2019, decreased in 2020 to €9.34 million, peaked at €13.76 million in 2023, and then dropped to €12.87 million in 2025. The market's export slump can be attributed to evolving consumer preferences, with potentially dwindling demand for gaming consoles. For imports, the peak in 2023 suggests a surge in demand or strategic sourcing decisions, possibly influenced by new product releases or shifts in supply chain dynamics. These fluctuations underscore the market's sensitivity to global gaming trends and economic conditions, necessitating agile strategies to navigate evolving market dynamics.
Key Highlights of the Report:
- Slovenia Gaming Console Market Outlook
- Market Size of Slovenia Gaming Console Market, 2025
- Forecast of Slovenia Gaming Console Market, 2032
- Historical Data and Forecast of Slovenia Gaming Console Revenues & Volume for the Period 2022-2032F
- Slovenia Gaming Console Market Trend Evolution
- Slovenia Gaming Console Market Drivers and Challenges
- Slovenia Gaming Console Price Trends
- Slovenia Gaming Console Porter`s Five Forces
- Slovenia Gaming Console Industry Life Cycle
- Historical Data and Forecast of Slovenia Gaming Console Market Revenues & Volume By Component for the Period 2022-2032F
- Historical Data and Forecast of Slovenia Gaming Console Market Revenues & Volume By Hardware for the Period 2022-2032F
- Historical Data and Forecast of Slovenia Gaming Console Market Revenues & Volume By Software for the Period 2022-2032F
- Historical Data and Forecast of Slovenia Gaming Console Market Revenues & Volume By Type for the Period 2022-2032F
- Historical Data and Forecast of Slovenia Gaming Console Market Revenues & Volume By Home Consoles for the Period 2022-2032F
- Historical Data and Forecast of Slovenia Gaming Console Market Revenues & Volume By Handheld Consoles for the Period 2022-2032F
- Historical Data and Forecast of Slovenia Gaming Console Market Revenues & Volume By Hybrid Consoles for the Period 2022-2032F
- Historical Data and Forecast of Slovenia Gaming Console Market Revenues & Volume By Dedicated Consoles for the Period 2022-2032F
- Historical Data and Forecast of Slovenia Gaming Console Market Revenues & Volume By Others for the Period 2022-2032F
- Historical Data and Forecast of Slovenia Gaming Console Market Revenues & Volume By End-use for the Period 2022-2032F
- Historical Data and Forecast of Slovenia Gaming Console Market Revenues & Volume By Personal for the Period 2022-2032F
- Historical Data and Forecast of Slovenia Gaming Console Market Revenues & Volume By Commercial for the Period 2022-2032F
- Historical Data and Forecast of Slovenia Gaming Console Market Revenues & Volume By Others for the Period 2022-2032F
- Slovenia Gaming Console Import Export Trade Statistics
- Market Opportunity Assessment By Component
- Market Opportunity Assessment By Type
- Market Opportunity Assessment By End-use
- Slovenia Gaming Console Top Companies Market Share
- Slovenia Gaming Console Competitive Benchmarking By Technical and Operational Parameters
- Slovenia Gaming Console Company Profiles
- Slovenia Gaming Console Key Strategic Recommendations
Frequently Asked Questions About the Market Study (FAQs):
6Wresearch actively monitors the Slovenia Gaming Console Market and publishes its comprehensive annual report, highlighting emerging trends, growth drivers, revenue analysis, and forecast outlook. Our insights help businesses to make data-backed strategic decisions with ongoing market dynamics. Our analysts track relevent industries related to the Slovenia Gaming Console Market, allowing our clients with actionable intelligence and reliable forecasts tailored to emerging regional needs.
Yes, we provide customisation as per your requirements. To learn more, feel free to contact us on sales@6wresearch.com
1 Executive Summary |
2 Introduction |
2.1 Key Highlights of the Report |
2.2 Report Description |
2.3 Market Scope & Segmentation |
2.4 Research Methodology |
2.5 Assumptions |
3 Slovenia Gaming Console Market Overview |
3.1 Slovenia Country Macro Economic Indicators |
3.2 Slovenia Gaming Console Market Revenues & Volume, 2022 & 2032F |
3.3 Slovenia Gaming Console Market - Industry Life Cycle |
3.4 Slovenia Gaming Console Market - Porter's Five Forces |
3.5 Slovenia Gaming Console Market Revenues & Volume Share, By Component, 2022 & 2032F |
3.6 Slovenia Gaming Console Market Revenues & Volume Share, By Type, 2022 & 2032F |
3.7 Slovenia Gaming Console Market Revenues & Volume Share, By End-use, 2022 & 2032F |
4 Slovenia Gaming Console Market Dynamics |
4.1 Impact Analysis |
4.2 Market Drivers |
4.2.1 Increasing disposable income of consumers in Slovenia. |
4.2.2 Growing popularity of eSports and competitive gaming. |
4.2.3 Technological advancements in gaming consoles and accessories. |
4.3 Market Restraints |
4.3.1 High initial cost of purchasing gaming consoles. |
4.3.2 Limited availability of popular gaming titles in the Slovenian market. |
4.3.3 Competition from alternative gaming platforms such as PC gaming and mobile gaming. |
5 Slovenia Gaming Console Market Trends |
6 Slovenia Gaming Console Market Segmentations |
6.1 Slovenia Gaming Console Market, By Component |
6.1.1 Overview and Analysis |
6.1.2 Slovenia Gaming Console Market Revenues & Volume, By Hardware, 2022-2032F |
6.1.3 Slovenia Gaming Console Market Revenues & Volume, By Software, 2022-2032F |
6.2 Slovenia Gaming Console Market, By Type |
6.2.1 Overview and Analysis |
6.2.2 Slovenia Gaming Console Market Revenues & Volume, By Home Consoles, 2022-2032F |
6.2.3 Slovenia Gaming Console Market Revenues & Volume, By Handheld Consoles, 2022-2032F |
6.2.4 Slovenia Gaming Console Market Revenues & Volume, By Hybrid Consoles, 2022-2032F |
6.2.5 Slovenia Gaming Console Market Revenues & Volume, By Dedicated Consoles, 2022-2032F |
6.2.6 Slovenia Gaming Console Market Revenues & Volume, By Others, 2022-2032F |
6.3 Slovenia Gaming Console Market, By End-use |
6.3.1 Overview and Analysis |
6.3.2 Slovenia Gaming Console Market Revenues & Volume, By Personal, 2022-2032F |
6.3.3 Slovenia Gaming Console Market Revenues & Volume, By Commercial, 2022-2032F |
6.3.4 Slovenia Gaming Console Market Revenues & Volume, By Others, 2022-2032F |
7 Slovenia Gaming Console Market Import-Export Trade Statistics |
7.1 Slovenia Gaming Console Market Export to Major Countries |
7.2 Slovenia Gaming Console Market Imports from Major Countries |
8 Slovenia Gaming Console Market Key Performance Indicators |
8.1 Average time spent by consumers on gaming activities. |
8.2 Number of gaming events and tournaments held in Slovenia. |
8.3 Percentage of households with at least one gaming console. |
8.4 Number of gaming accessories sold per gaming console. |
9 Slovenia Gaming Console Market - Opportunity Assessment |
9.1 Slovenia Gaming Console Market Opportunity Assessment, By Component, 2022 & 2032F |
9.2 Slovenia Gaming Console Market Opportunity Assessment, By Type, 2022 & 2032F |
9.3 Slovenia Gaming Console Market Opportunity Assessment, By End-use, 2022 & 2032F |
10 Slovenia Gaming Console Market - Competitive Landscape |
10.1 Slovenia Gaming Console Market Revenue Share, By Companies, 2025 |
10.2 Slovenia Gaming Console Market Competitive Benchmarking, By Operating and Technical Parameters |
11 Company Profiles |
12 Recommendations | 13 Disclaimer |
Export potential assessment - trade Analytics for 2030
Export potential enables firms to identify high-growth global markets with greater confidence by combining advanced trade intelligence with a structured quantitative methodology. The framework analyzes emerging demand trends and country-level import patterns while integrating macroeconomic and trade datasets such as GDP and population forecasts, bilateral import–export flows, tariff structures, elasticity differentials between developed and developing economies, geographic distance, and import demand projections. Using weighted trade values from 2020–2024 as the base period to project country-to-country export potential for 2030, these inputs are operationalized through calculated drivers such as gravity model parameters, tariff impact factors, and projected GDP per-capita growth. Through an analysis of hidden potentials, demand hotspots, and market conditions that are most favorable to success, this method enables firms to focus on target countries, maximize returns, and global expansion with data, backed by accuracy.
By factoring in the projected importer demand gap that is currently unmet and could be potential opportunity, it identifies the potential for the Exporter (Country) among 190 countries, against the general trade analysis, which identifies the biggest importer or exporter.
To discover high-growth global markets and optimize your business strategy:
Click Here
Pricing
- Single User License$ 1,995
- Department License$ 2,400
- Site License$ 3,120
- Global License$ 3,795

Search
Thought Leadership and Analyst Meet


Our Clients
Latest Reports
- Canada Cloud CFD Market (2026-2032) | Size & Revenue, Industry, Growth, Competitive Landscape, Forecast, Segmentation, Value, Outlook, Trends, Share, Analysis, Companies
- Taiwan Food Delivery Platform Market (2026-2032) | Companies, Outlook, Analysis, Trends, Value, Revenue, Segmentation, Share, Forecast, Competitive Landscape, Growth, Size & Forecast
- United Kingdom (UK) Long-term Care Insurance Market (2026-2032) | Growth, Share, Consumer Insights, Drivers, Opportunities, Competition, Pricing Analysis, Segments, Restraints, Companies, Competitive, Value, Outlook, Size, Demand, Analysis, Challenges, Strategic Insights, Investment Trends, Revenue, Trends, Supply, Forecast
- United Kingdom (UK) Long Term Care Market (2026-2032) | Companies, Outlook, Analysis, Trends, Value, Revenue, Segmentation, Share, Forecast, Competitive Landscape, Growth, Size & Forecast
- Iraq Insulation and Waterproofing Market (2026-2032) | Outlook, Drivers, Growth, Size, Share, Industry, Revenue, Trends, Demand, Competitive, Strategic Insights, Opportunities, Segments, Companies, Challenges, Strategy, Consumer Insights, Analysis, Investment Trends, Value, Segmentation, Forecast, Restraints
- India Switchgear Market Outlook (2026-2032) | Size, Share, Trends, Growth, Revenue, Forecast, Analysis, Value, Outlook
- Pakistan Contraceptive Implants Market (2025-2031) | Demand, Growth, Size, Share, Industry, Pricing Analysis, Competitive, Strategic Insights, Strategy, Consumer Insights, Analysis, Investment Trends, Opportunities, Revenue, Segments, Value, Segmentation, Supply, Forecast, Restraints, Outlook, Competition, Drivers, Trends, Companies, Challenges
- Sri Lanka Packaging Market (2026-2032) | Outlook, Competition, Drivers, Trends, Demand, Pricing Analysis, Competitive, Strategic Insights, Companies, Challenges, Strategy, Consumer Insights, Analysis, Investment Trends, Opportunities, Growth, Size, Share, Industry, Revenue, Segments, Value, Segmentation, Supply, Forecast, Restraints
- India Kids Watches Market (2026-2032) | Strategy, Consumer Insights, Analysis, Investment Trends, Opportunities, Growth, Size, Share, Industry, Revenue, Segments, Value, Segmentation, Supply, Forecast, Restraints, Outlook, Competition, Drivers, Trends, Demand, Pricing Analysis, Competitive, Strategic Insights, Companies, Challenges
- Saudi Arabia Core Assurance Service Market (2025-2031) | Strategy, Consumer Insights, Analysis, Investment Trends, Opportunities, Growth, Size, Share, Industry, Revenue, Segments, Value, Segmentation, Supply, Forecast, Restraints, Outlook, Competition, Drivers, Trends, Demand, Pricing Analysis, Competitive, Strategic Insights, Companies, Challenges
Industry Events and Analyst Meet

India EV Show 2026

EV tech India Expo 2026

Auto Tech Asia 2026

Battery Tech India 2026

Smart Production Solutions Guangzhou 2026
Whitepaper
- Middle East & Africa Commercial Security Market Click here to view more.
- Middle East & Africa Fire Safety Systems & Equipment Market Click here to view more.
- GCC Drone Market Click here to view more.
- Middle East Lighting Fixture Market Click here to view more.
- GCC Physical & Perimeter Security Market Click here to view more.
6WResearch In News
- Doha a strategic location for EV manufacturing hub: IPA Qatar
- Demand for luxury TVs surging in the GCC, says Samsung
- Empowering Growth: The Thriving Journey of Bangladesh’s Cable Industry
- Demand for luxury TVs surging in the GCC, says Samsung
- Video call with a traditional healer? Once unthinkable, it’s now common in South Africa
- Intelligent Buildings To Smooth GCC’s Path To Net Zero