Slovenia Indoor Air Purification Market (2026-2032) | Outlook, Size & Revenue, Segmentation, Trends, Share, Industry, Companies, Value, Forecast, Competitive Landscape, Growth, Analysis
Market Forecast By Product (Dust Collectors & Vacuums, Fume & Smoke Collectors, Mist Eliminators, Bad Odor & Harmful Gasses, Fire & Emergency Exhaust And Viruses & Fungus), By Category (Small Room, Medium Room, Large Room), By Technology (HEPA, Electrostatic Precipitators, Activated Carbon, Ionic Filters, Others), By Function (Manual, Sensor, Others), By Outer Material (Plastic, Metal), By Distribution Channel (Direct Selling, E-Commerce, Supermarkets/Hypermarkets, Specialty Stores, Others), By Application (Industrial, Commercial, Residential) And Competitive Landscape
| Product Code: ETC9319051 | Publication Date: Sep 2024 | Updated Date: Feb 2026 | Product Type: Market Research Report | |
| Publisher: 6Wresearch | Author: Vasudha | No. of Pages: 75 | No. of Figures: 35 | No. of Tables: 20 |
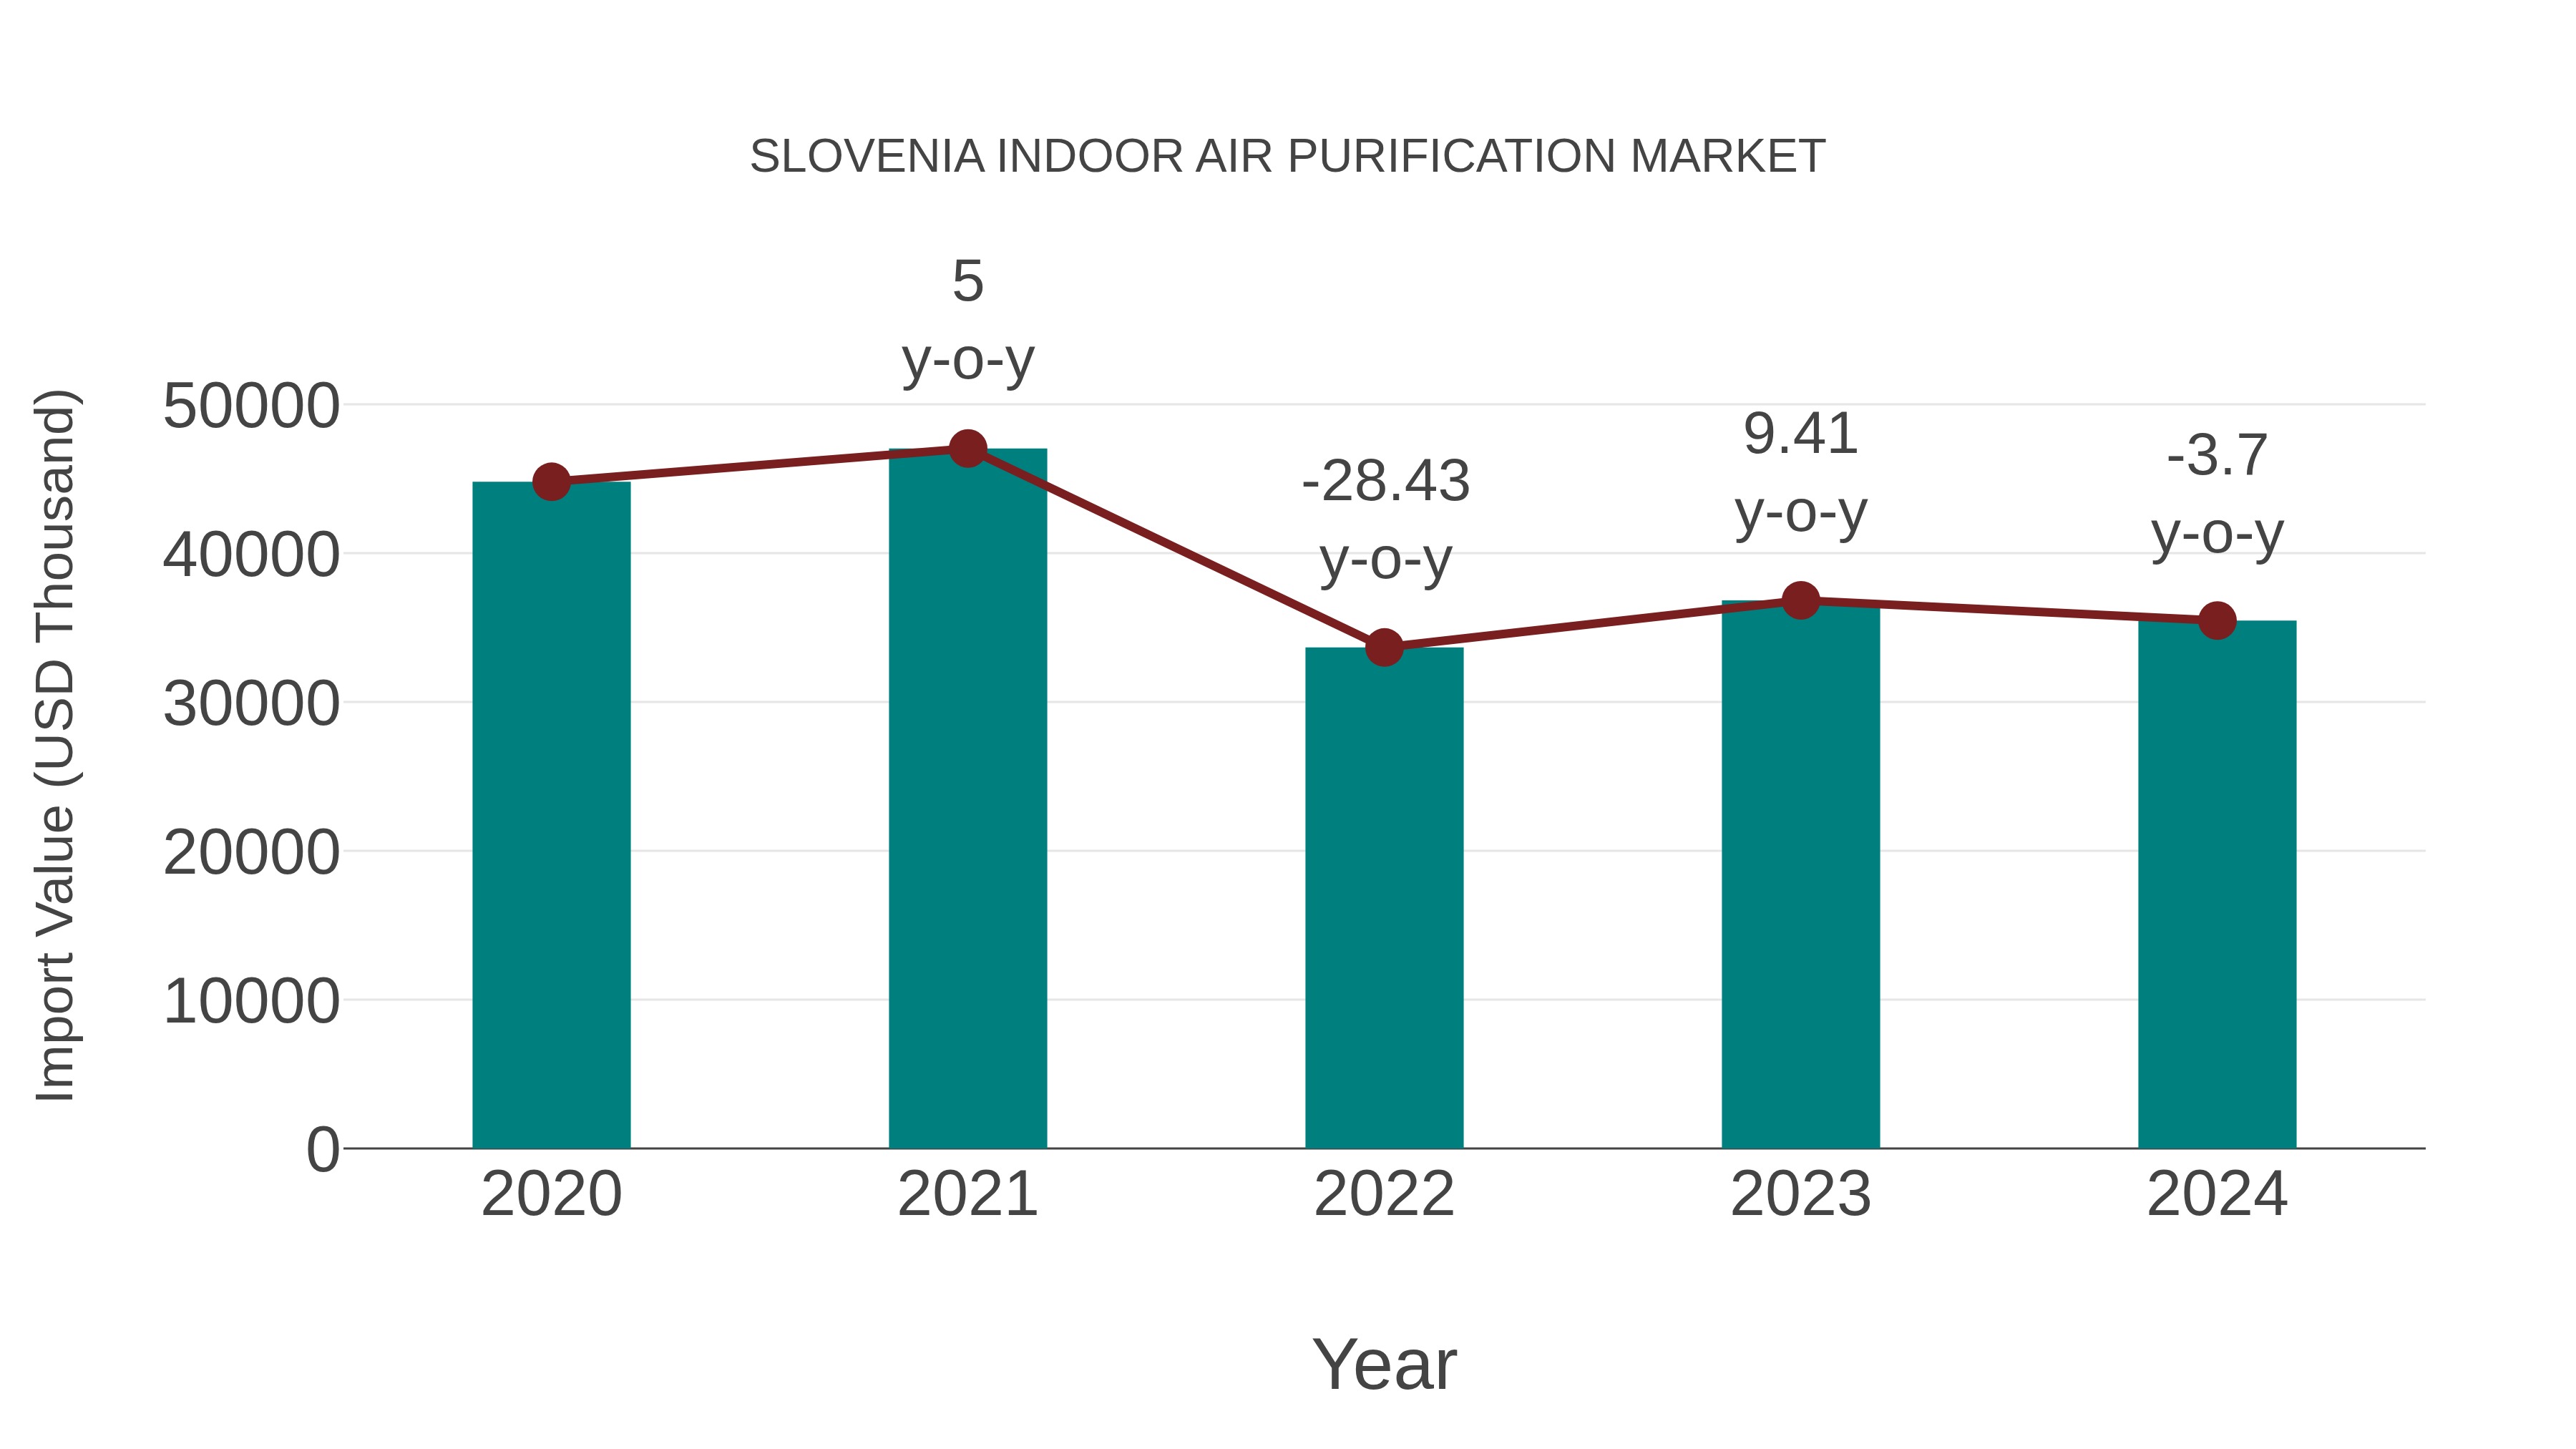
Slovenia Indoor Air Purification Market: Import Trend Analysis
Slovenia import trend for the indoor air purification market experienced a decline, with a growth rate of -3.7% from 2023 to 2024 and a CAGR of -5.67% for 2020-2024. This negative momentum could be attributed to shifting demand patterns or changes in trade policies impacting market stability.
Key Highlights of the Report:
- Slovenia Indoor Air Purification Market Outlook
- Market Size of Slovenia Indoor Air Purification Market, 2025
- Forecast of Slovenia Indoor Air Purification Market, 2032
- Historical Data and Forecast of Slovenia Indoor Air Purification Revenues & Volume for the Period 2022-2032F
- Slovenia Indoor Air Purification Market Trend Evolution
- Slovenia Indoor Air Purification Market Drivers and Challenges
- Slovenia Indoor Air Purification Price Trends
- Slovenia Indoor Air Purification Porter's Five Forces
- Slovenia Indoor Air Purification Industry Life Cycle
- Historical Data and Forecast of Slovenia Indoor Air Purification Market Revenues & Volume By Product for the Period 2022-2032F
- Historical Data and Forecast of Slovenia Indoor Air Purification Market Revenues & Volume By Dust Collectors & Vacuums for the Period 2022-2032F
- Historical Data and Forecast of Slovenia Indoor Air Purification Market Revenues & Volume By Fume & Smoke Collectors for the Period 2022-2032F
- Historical Data and Forecast of Slovenia Indoor Air Purification Market Revenues & Volume By Mist Eliminators for the Period 2022-2032F
- Historical Data and Forecast of Slovenia Indoor Air Purification Market Revenues & Volume By Bad Odor & Harmful Gasses for the Period 2022-2032F
- Historical Data and Forecast of Slovenia Indoor Air Purification Market Revenues & Volume By Fire & Emergency Exhaust And Viruses & Fungus for the Period 2022-2032F
- Historical Data and Forecast of Slovenia Indoor Air Purification Market Revenues & Volume By Category for the Period 2022-2032F
- Historical Data and Forecast of Slovenia Indoor Air Purification Market Revenues & Volume By Small Room for the Period 2022-2032F
- Historical Data and Forecast of Slovenia Indoor Air Purification Market Revenues & Volume By Medium Room for the Period 2022-2032F
- Historical Data and Forecast of Slovenia Indoor Air Purification Market Revenues & Volume By Large Room for the Period 2022-2032F
- Historical Data and Forecast of Slovenia Indoor Air Purification Market Revenues & Volume By Technology for the Period 2022-2032F
- Historical Data and Forecast of Slovenia Indoor Air Purification Market Revenues & Volume By HEPA for the Period 2022-2032F
- Historical Data and Forecast of Slovenia Indoor Air Purification Market Revenues & Volume By Electrostatic Precipitators for the Period 2022-2032F
- Historical Data and Forecast of Slovenia Indoor Air Purification Market Revenues & Volume By Activated Carbon for the Period 2022-2032F
- Historical Data and Forecast of Slovenia Indoor Air Purification Market Revenues & Volume By Ionic Filters for the Period 2022-2032F
- Historical Data and Forecast of Slovenia Indoor Air Purification Market Revenues & Volume By Others for the Period 2022-2032F
- Historical Data and Forecast of Slovenia Indoor Air Purification Market Revenues & Volume By Function for the Period 2022-2032F
- Historical Data and Forecast of Slovenia Indoor Air Purification Market Revenues & Volume By Manual for the Period 2022-2032F
- Historical Data and Forecast of Slovenia Indoor Air Purification Market Revenues & Volume By Sensor for the Period 2022-2032F
- Historical Data and Forecast of Slovenia Indoor Air Purification Market Revenues & Volume By Others for the Period 2022-2032F
- Historical Data and Forecast of Slovenia Indoor Air Purification Market Revenues & Volume By Outer Material for the Period 2022-2032F
- Historical Data and Forecast of Slovenia Indoor Air Purification Market Revenues & Volume By Plastic for the Period 2022-2032F
- Historical Data and Forecast of Slovenia Indoor Air Purification Market Revenues & Volume By Metal for the Period 2022-2032F
- Historical Data and Forecast of Slovenia Indoor Air Purification Market Revenues & Volume By Distribution Channel for the Period 2022-2032F
- Historical Data and Forecast of Slovenia Indoor Air Purification Market Revenues & Volume By Direct Selling for the Period 2022-2032F
- Historical Data and Forecast of Slovenia Indoor Air Purification Market Revenues & Volume By E-Commerce for the Period 2022-2032F
- Historical Data and Forecast of Slovenia Indoor Air Purification Market Revenues & Volume By Supermarkets/Hypermarkets for the Period 2022-2032F
- Historical Data and Forecast of Slovenia Indoor Air Purification Market Revenues & Volume By Specialty Stores for the Period 2022-2032F
- Historical Data and Forecast of Slovenia Indoor Air Purification Market Revenues & Volume By Others for the Period 2022-2032F
- Historical Data and Forecast of Slovenia Indoor Air Purification Market Revenues & Volume By Application for the Period 2022-2032F
- Historical Data and Forecast of Slovenia Indoor Air Purification Market Revenues & Volume By Industrial for the Period 2022-2032F
- Historical Data and Forecast of Slovenia Indoor Air Purification Market Revenues & Volume By Commercial for the Period 2022-2032F
- Historical Data and Forecast of Slovenia Indoor Air Purification Market Revenues & Volume By Residential for the Period 2022-2032F
- Slovenia Indoor Air Purification Import Export Trade Statistics
- Market Opportunity Assessment By Product
- Market Opportunity Assessment By Category
- Market Opportunity Assessment By Technology
- Market Opportunity Assessment By Function
- Market Opportunity Assessment By Outer Material
- Market Opportunity Assessment By Distribution Channel
- Market Opportunity Assessment By Application
- Slovenia Indoor Air Purification Top Companies Market Share
- Slovenia Indoor Air Purification Competitive Benchmarking By Technical and Operational Parameters
- Slovenia Indoor Air Purification Company Profiles
- Slovenia Indoor Air Purification Key Strategic Recommendations
Frequently Asked Questions About the Market Study (FAQs):
6Wresearch actively monitors the Slovenia Indoor Air Purification Market and publishes its comprehensive annual report, highlighting emerging trends, growth drivers, revenue analysis, and forecast outlook. Our insights help businesses to make data-backed strategic decisions with ongoing market dynamics. Our analysts track relevent industries related to the Slovenia Indoor Air Purification Market, allowing our clients with actionable intelligence and reliable forecasts tailored to emerging regional needs.
Yes, we provide customisation as per your requirements. To learn more, feel free to contact us on sales@6wresearch.com
1 Executive Summary |
2 Introduction |
2.1 Key Highlights of the Report |
2.2 Report Description |
2.3 Market Scope & Segmentation |
2.4 Research Methodology |
2.5 Assumptions |
3 Slovenia Indoor Air Purification Market Overview |
3.1 Slovenia Country Macro Economic Indicators |
3.2 Slovenia Indoor Air Purification Market Revenues & Volume, 2022 & 2032F |
3.3 Slovenia Indoor Air Purification Market - Industry Life Cycle |
3.4 Slovenia Indoor Air Purification Market - Porter's Five Forces |
3.5 Slovenia Indoor Air Purification Market Revenues & Volume Share, By Product, 2022 & 2032F |
3.6 Slovenia Indoor Air Purification Market Revenues & Volume Share, By Category, 2022 & 2032F |
3.7 Slovenia Indoor Air Purification Market Revenues & Volume Share, By Technology, 2022 & 2032F |
3.8 Slovenia Indoor Air Purification Market Revenues & Volume Share, By Function, 2022 & 2032F |
3.9 Slovenia Indoor Air Purification Market Revenues & Volume Share, By Outer Material, 2022 & 2032F |
3.10 Slovenia Indoor Air Purification Market Revenues & Volume Share, By Distribution Channel, 2022 & 2032F |
3.11 Slovenia Indoor Air Purification Market Revenues & Volume Share, By Application, 2022 & 2032F |
4 Slovenia Indoor Air Purification Market Dynamics |
4.1 Impact Analysis |
4.2 Market Drivers |
4.2.1 Increasing awareness about the importance of indoor air quality and health concerns related to poor air quality. |
4.2.2 Growing urbanization leading to higher pollution levels and a greater need for indoor air purification solutions. |
4.2.3 Stringent government regulations and guidelines focusing on indoor air quality standards. |
4.3 Market Restraints |
4.3.1 High initial costs associated with indoor air purification systems may deter adoption among cost-sensitive consumers. |
4.3.2 Limited consumer awareness and education about the benefits and effectiveness of indoor air purification solutions. |
4.3.3 Presence of alternative solutions such as natural ventilation or air purifying plants that compete with indoor air purification systems. |
5 Slovenia Indoor Air Purification Market Trends |
6 Slovenia Indoor Air Purification Market, By Types |
6.1 Slovenia Indoor Air Purification Market, By Product |
6.1.1 Overview and Analysis |
6.1.2 Slovenia Indoor Air Purification Market Revenues & Volume, By Product, 2022-2032F |
6.1.3 Slovenia Indoor Air Purification Market Revenues & Volume, By Dust Collectors & Vacuums, 2022-2032F |
6.1.4 Slovenia Indoor Air Purification Market Revenues & Volume, By Fume & Smoke Collectors, 2022-2032F |
6.1.5 Slovenia Indoor Air Purification Market Revenues & Volume, By Mist Eliminators, 2022-2032F |
6.1.6 Slovenia Indoor Air Purification Market Revenues & Volume, By Bad Odor & Harmful Gasses, 2022-2032F |
6.1.7 Slovenia Indoor Air Purification Market Revenues & Volume, By Fire & Emergency Exhaust And Viruses & Fungus, 2022-2032F |
6.2 Slovenia Indoor Air Purification Market, By Category |
6.2.1 Overview and Analysis |
6.2.2 Slovenia Indoor Air Purification Market Revenues & Volume, By Small Room, 2022-2032F |
6.2.3 Slovenia Indoor Air Purification Market Revenues & Volume, By Medium Room, 2022-2032F |
6.2.4 Slovenia Indoor Air Purification Market Revenues & Volume, By Large Room, 2022-2032F |
6.3 Slovenia Indoor Air Purification Market, By Technology |
6.3.1 Overview and Analysis |
6.3.2 Slovenia Indoor Air Purification Market Revenues & Volume, By HEPA, 2022-2032F |
6.3.3 Slovenia Indoor Air Purification Market Revenues & Volume, By Electrostatic Precipitators, 2022-2032F |
6.3.4 Slovenia Indoor Air Purification Market Revenues & Volume, By Activated Carbon, 2022-2032F |
6.3.5 Slovenia Indoor Air Purification Market Revenues & Volume, By Ionic Filters, 2022-2032F |
6.3.6 Slovenia Indoor Air Purification Market Revenues & Volume, By Others, 2022-2032F |
6.4 Slovenia Indoor Air Purification Market, By Function |
6.4.1 Overview and Analysis |
6.4.2 Slovenia Indoor Air Purification Market Revenues & Volume, By Manual, 2022-2032F |
6.4.3 Slovenia Indoor Air Purification Market Revenues & Volume, By Sensor, 2022-2032F |
6.4.4 Slovenia Indoor Air Purification Market Revenues & Volume, By Others, 2022-2032F |
6.5 Slovenia Indoor Air Purification Market, By Outer Material |
6.5.1 Overview and Analysis |
6.5.2 Slovenia Indoor Air Purification Market Revenues & Volume, By Plastic, 2022-2032F |
6.5.3 Slovenia Indoor Air Purification Market Revenues & Volume, By Metal, 2022-2032F |
6.6 Slovenia Indoor Air Purification Market, By Distribution Channel |
6.6.1 Overview and Analysis |
6.6.2 Slovenia Indoor Air Purification Market Revenues & Volume, By Direct Selling, 2022-2032F |
6.6.3 Slovenia Indoor Air Purification Market Revenues & Volume, By E-Commerce, 2022-2032F |
6.6.4 Slovenia Indoor Air Purification Market Revenues & Volume, By Supermarkets/Hypermarkets, 2022-2032F |
6.6.5 Slovenia Indoor Air Purification Market Revenues & Volume, By Specialty Stores, 2022-2032F |
6.6.6 Slovenia Indoor Air Purification Market Revenues & Volume, By Others, 2022-2032F |
6.7 Slovenia Indoor Air Purification Market, By Application |
6.7.1 Overview and Analysis |
6.7.2 Slovenia Indoor Air Purification Market Revenues & Volume, By Industrial, 2022-2032F |
6.7.3 Slovenia Indoor Air Purification Market Revenues & Volume, By Commercial, 2022-2032F |
6.7.4 Slovenia Indoor Air Purification Market Revenues & Volume, By , 2022-2032F |
7 Slovenia Indoor Air Purification Market Import-Export Trade Statistics |
7.1 Slovenia Indoor Air Purification Market Export to Major Countries |
7.2 Slovenia Indoor Air Purification Market Imports from Major Countries |
8 Slovenia Indoor Air Purification Market Key Performance Indicators |
8.1 Average indoor air quality index improvement percentage after the installation of air purification systems. |
8.2 Number of new residential and commercial buildings incorporating indoor air purification systems in their construction or renovation plans. |
8.3 Percentage increase in the adoption of smart and IoT-enabled indoor air purification devices. |
8.4 Rate of return on investment for consumers who have installed indoor air purification systems. |
8.5 Customer satisfaction scores and feedback related to the performance and effectiveness of indoor air purification systems. |
9 Slovenia Indoor Air Purification Market - Opportunity Assessment |
9.1 Slovenia Indoor Air Purification Market Opportunity Assessment, By Product, 2022 & 2032F |
9.2 Slovenia Indoor Air Purification Market Opportunity Assessment, By Category, 2022 & 2032F |
9.3 Slovenia Indoor Air Purification Market Opportunity Assessment, By Technology, 2022 & 2032F |
9.4 Slovenia Indoor Air Purification Market Opportunity Assessment, By Function, 2022 & 2032F |
9.5 Slovenia Indoor Air Purification Market Opportunity Assessment, By Outer Material, 2022 & 2032F |
9.6 Slovenia Indoor Air Purification Market Opportunity Assessment, By Distribution Channel, 2022 & 2032F |
9.7 Slovenia Indoor Air Purification Market Opportunity Assessment, By Application, 2022 & 2032F |
10 Slovenia Indoor Air Purification Market - Competitive Landscape |
10.1 Slovenia Indoor Air Purification Market Revenue Share, By Companies, 2025 |
10.2 Slovenia Indoor Air Purification Market Competitive Benchmarking, By Operating and Technical Parameters |
11 Company Profiles |
12 Recommendations |
13 Disclaimer |
Export potential assessment - trade Analytics for 2030
Export potential enables firms to identify high-growth global markets with greater confidence by combining advanced trade intelligence with a structured quantitative methodology. The framework analyzes emerging demand trends and country-level import patterns while integrating macroeconomic and trade datasets such as GDP and population forecasts, bilateral import–export flows, tariff structures, elasticity differentials between developed and developing economies, geographic distance, and import demand projections. Using weighted trade values from 2020–2024 as the base period to project country-to-country export potential for 2030, these inputs are operationalized through calculated drivers such as gravity model parameters, tariff impact factors, and projected GDP per-capita growth. Through an analysis of hidden potentials, demand hotspots, and market conditions that are most favorable to success, this method enables firms to focus on target countries, maximize returns, and global expansion with data, backed by accuracy.
By factoring in the projected importer demand gap that is currently unmet and could be potential opportunity, it identifies the potential for the Exporter (Country) among 190 countries, against the general trade analysis, which identifies the biggest importer or exporter.
To discover high-growth global markets and optimize your business strategy:
Click Here
Pricing
- Single User License$ 1,995
- Department License$ 2,400
- Site License$ 3,120
- Global License$ 3,795

Search
Thought Leadership and Analyst Meet


Our Clients
Latest Reports
- China Electric Appliance Rental Market (2026-2032) | Trends, Revenue, Growth, Challenges, Size, Value, Outlook, Pricing, Strategy, Insights, Restraints, segmentation, Companies, Investment Opportunities, Analysis, Demand, Drivers, Competition, Forecast, Share
- Chile Electric Appliance Rental Market (2026-2032) | Outlook, Competition, Drivers, Strategy, Revenue, Analysis, Value, Pricing, Restraints, Size, Demand, Share, Growth, Forecast, Challenges, Insights, Investment Opportunities, Companies, Trends, segmentation
- Cambodia Electric Appliance Rental Market (2026-2032) | Companies, Analysis, Restraints, Pricing, Insights, Challenges, Outlook, Strategy, Forecast, Trends, Competition, Value, Revenue, Investment Opportunities, segmentation, Drivers, Size, Demand, Growth, Share
- Brazil Electric Appliance Rental Market (2026-2032) | Revenue, Strategy, Forecast, Companies, segmentation, Competition, Size, Investment Opportunities, Pricing, Restraints, Outlook, Challenges, Analysis, Drivers, Value, Demand, Insights, Trends, Growth, Share
- Bangladesh Electric Appliance Rental Market (2026-2032) | Drivers, Forecast, Investment Opportunities, Strategy, Insights, Demand, Challenges, Outlook, Trends, Competition, Value, Revenue, Size, Pricing, Analysis, Companies, Restraints, segmentation, Share, Growth
- Bahrain Electric Appliance Rental Market (2026-2032) | Outlook, Size, Competition, Restraints, Drivers, Value, Trends, Investment Opportunities, Insights, Forecast, Revenue, Strategy, Growth, Share, Demand, Analysis, Challenges, Companies, segmentation, Pricing
- Azerbaijan Electric Appliance Rental Market (2026-2032) | Trends, Investment Opportunities, Restraints, Insights, Strategy, Competition, Value, Growth, Demand, Drivers, Analysis, Forecast, Size, Share, Outlook, segmentation, Pricing, Challenges, Revenue, Companies
- Australia Electric Appliance Rental Market (2026-2032) | Challenges, Restraints, Forecast, Demand, Size, Competition, Pricing, Investment Opportunities, Revenue, Trends, Drivers, Growth, Outlook, Analysis, Strategy, Value, segmentation, Insights, Companies, Share
- Argentina Electric Appliance Rental Market (2026-2032) | Growth, Trends, Insights, Outlook, Forecast, Size, Drivers, Analysis, Restraints, Challenges, Share, Revenue, Investment Opportunities, Strategy, Demand, Value, Companies, segmentation, Competition, Pricing
- Algeria Electric Appliance Rental Market (2026-2032) | Share, Size, Value, Strategy, Competition, Outlook, Challenges, Companies, Trends, Pricing, Insights, Forecast, Investment Opportunities, Revenue, Growth, Restraints, segmentation, Analysis, Demand, Drivers
Industry Events and Analyst Meet

HIMTEX 2026

India Refining Summit 2026

India EV Show 2026

EV tech India Expo 2026

Auto Tech Asia 2026
Whitepaper
- Middle East & Africa Commercial Security Market Click here to view more.
- Middle East & Africa Fire Safety Systems & Equipment Market Click here to view more.
- GCC Drone Market Click here to view more.
- Middle East Lighting Fixture Market Click here to view more.
- GCC Physical & Perimeter Security Market Click here to view more.
6WResearch In News
- Doha a strategic location for EV manufacturing hub: IPA Qatar
- Demand for luxury TVs surging in the GCC, says Samsung
- Empowering Growth: The Thriving Journey of Bangladesh’s Cable Industry
- Demand for luxury TVs surging in the GCC, says Samsung
- Video call with a traditional healer? Once unthinkable, it’s now common in South Africa
- Intelligent Buildings To Smooth GCC’s Path To Net Zero