Slovenia Isophorone Market (2026-2032) | Growth, Segmentation, Industry, Outlook, Companies, Trends, Competitive Landscape, Value, Size & Revenue, Analysis, Forecast, Share
Market Forecast By End-user (Paints and Coatings, Printing Inks, Artificial Leather, Adhesives, Agrochemicals, Composites, Other) And Competitive Landscape
| Product Code: ETC9319738 | Publication Date: Sep 2024 | Updated Date: Apr 2026 | Product Type: Market Research Report | |
| Publisher: 6Wresearch | Author: Dhaval Chaurasia | No. of Pages: 75 | No. of Figures: 35 | No. of Tables: 20 |
Slovenia Isophorone Market Size (2020-2030)
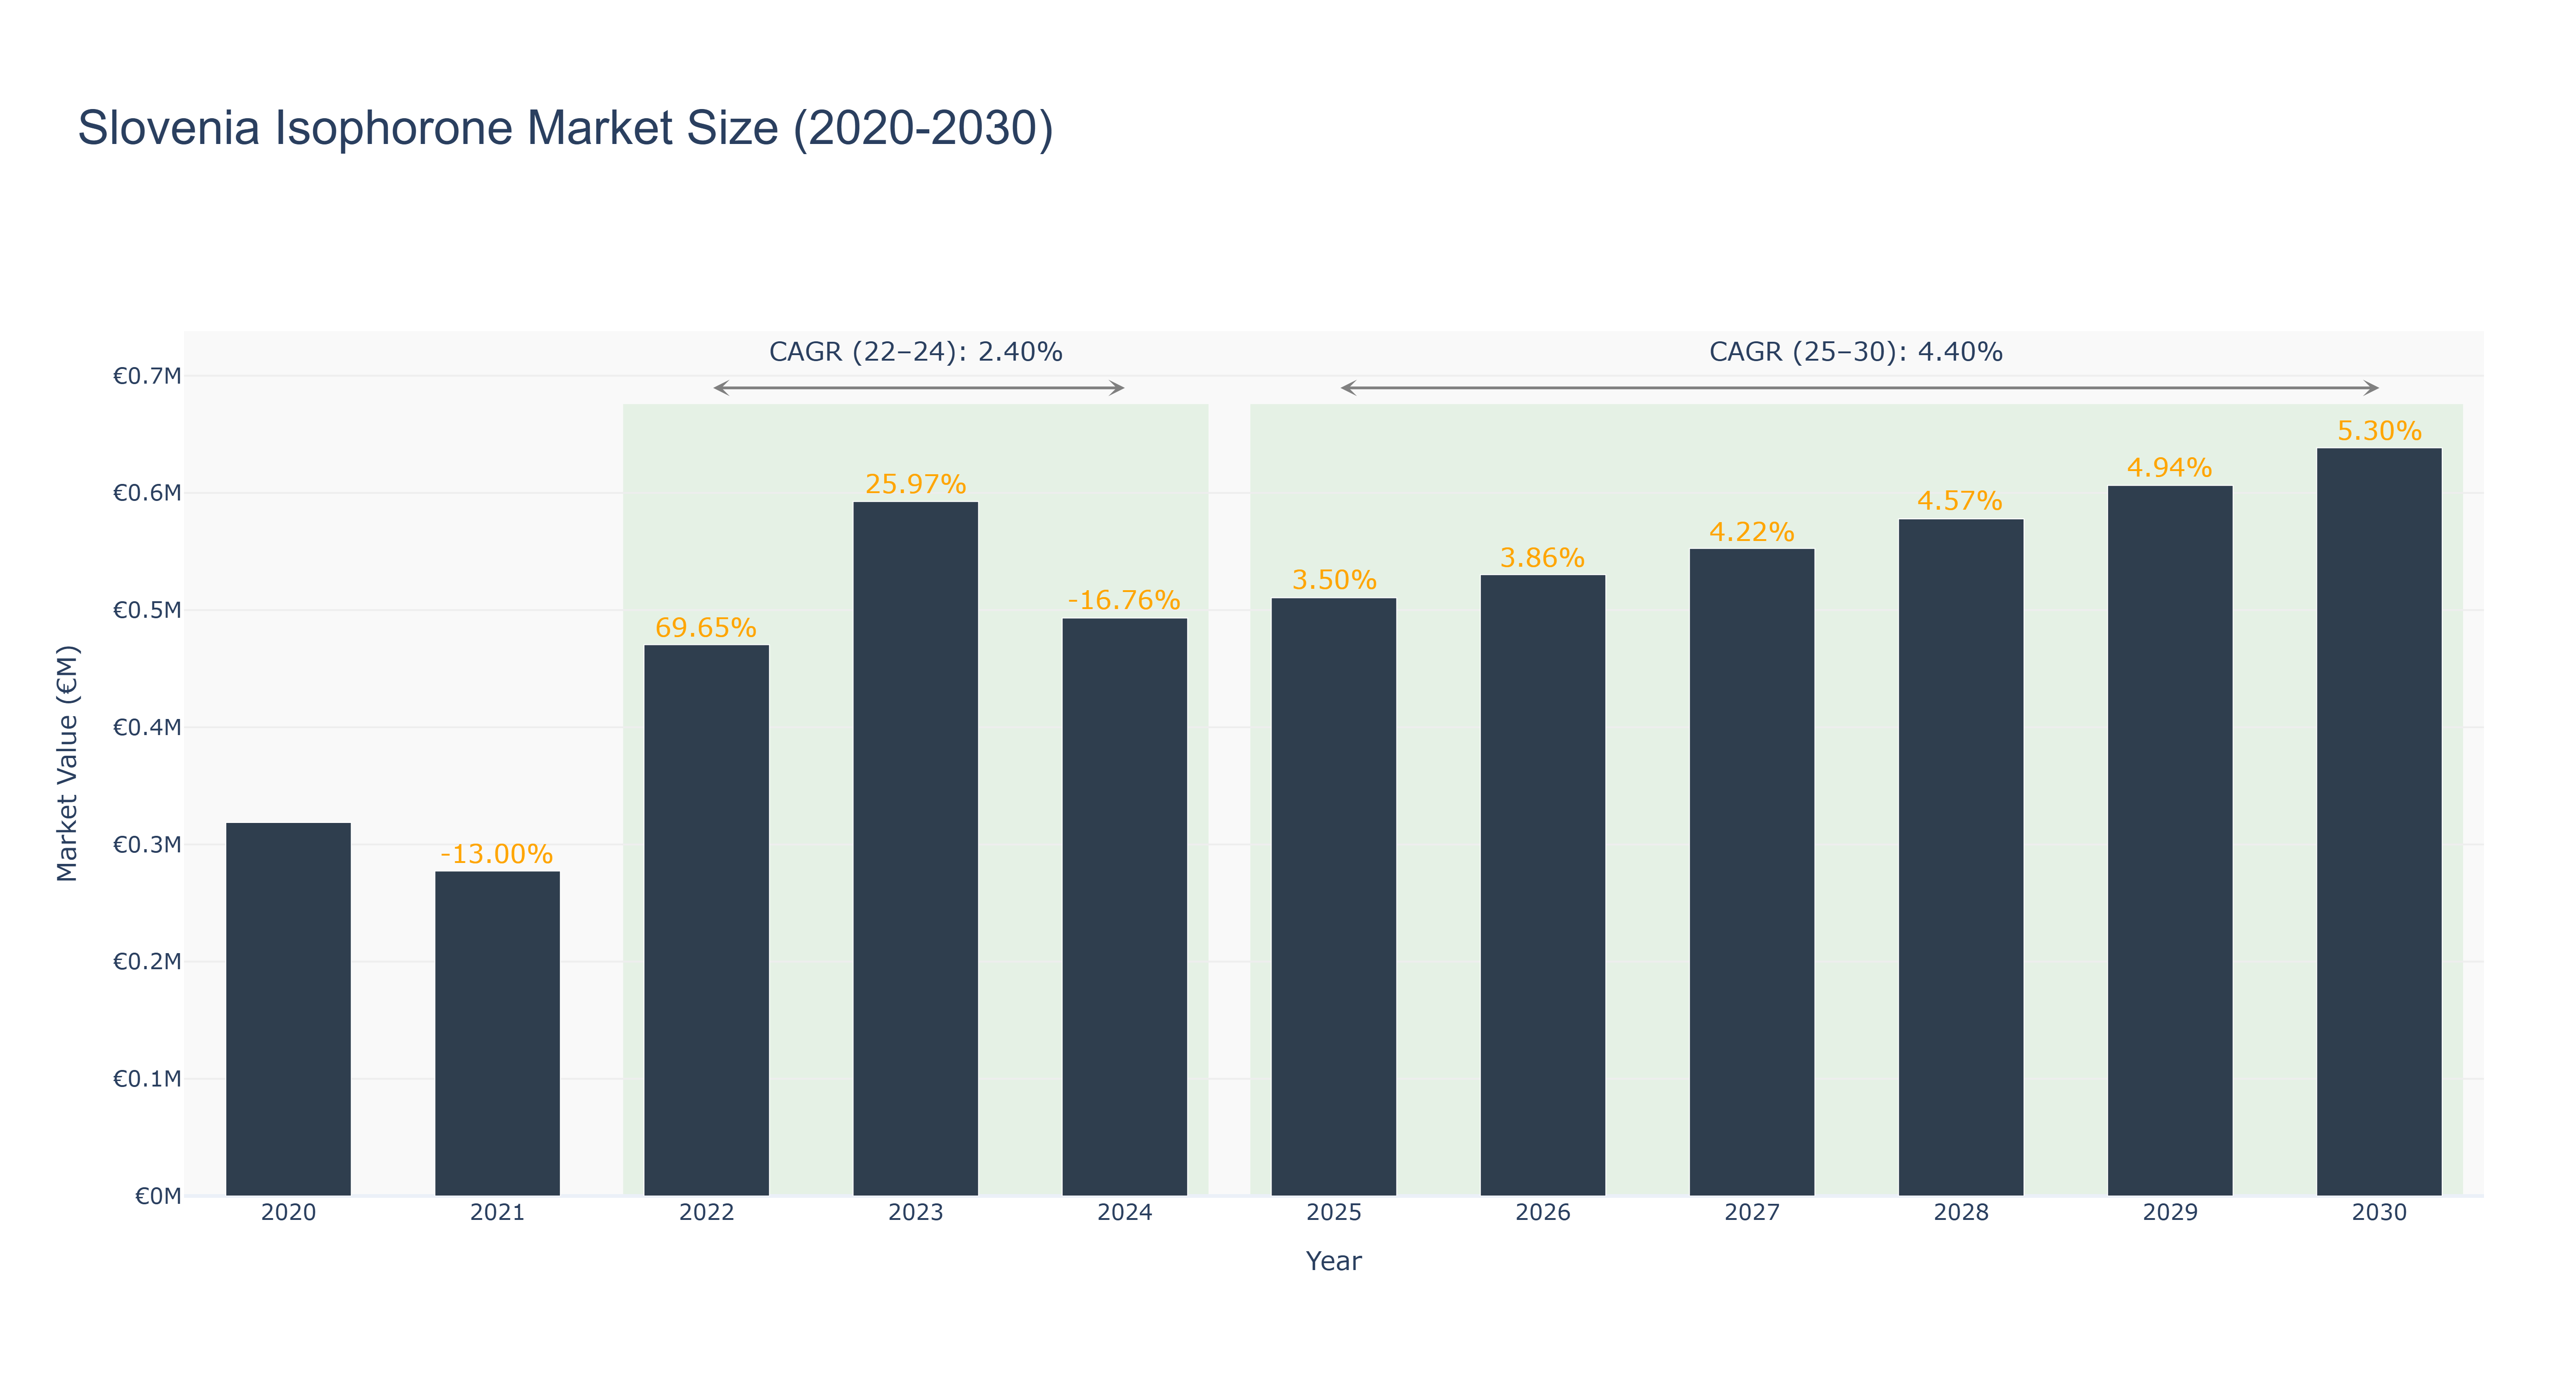
The Slovenia Isophorone Market experienced a peak market size of €0.64 million in 2030, showing a consistent growth trajectory. Actual market size decreased from €0.47 million in 2022 to €0.49 million in 2024, attributed to a slight decline in demand. However, the market rebounded with a forecasted growth to reach €0.73 million by 2030. The CAGR values reflect this trend, with a rate of 2.40% from 2022 to 2024 and a higher rate of 4.40% from 2025 to 2030. Industry drivers such as increasing industrial applications and demand for specialty chemicals are fueling this growth. Recent developments in sustainable production methods and upcoming projects focusing on expanding export markets are set to further boost the Slovenia Isophorone Market in the near future.
Slovenia Isophorone Market: Production & Trade Performance (2019-2025)
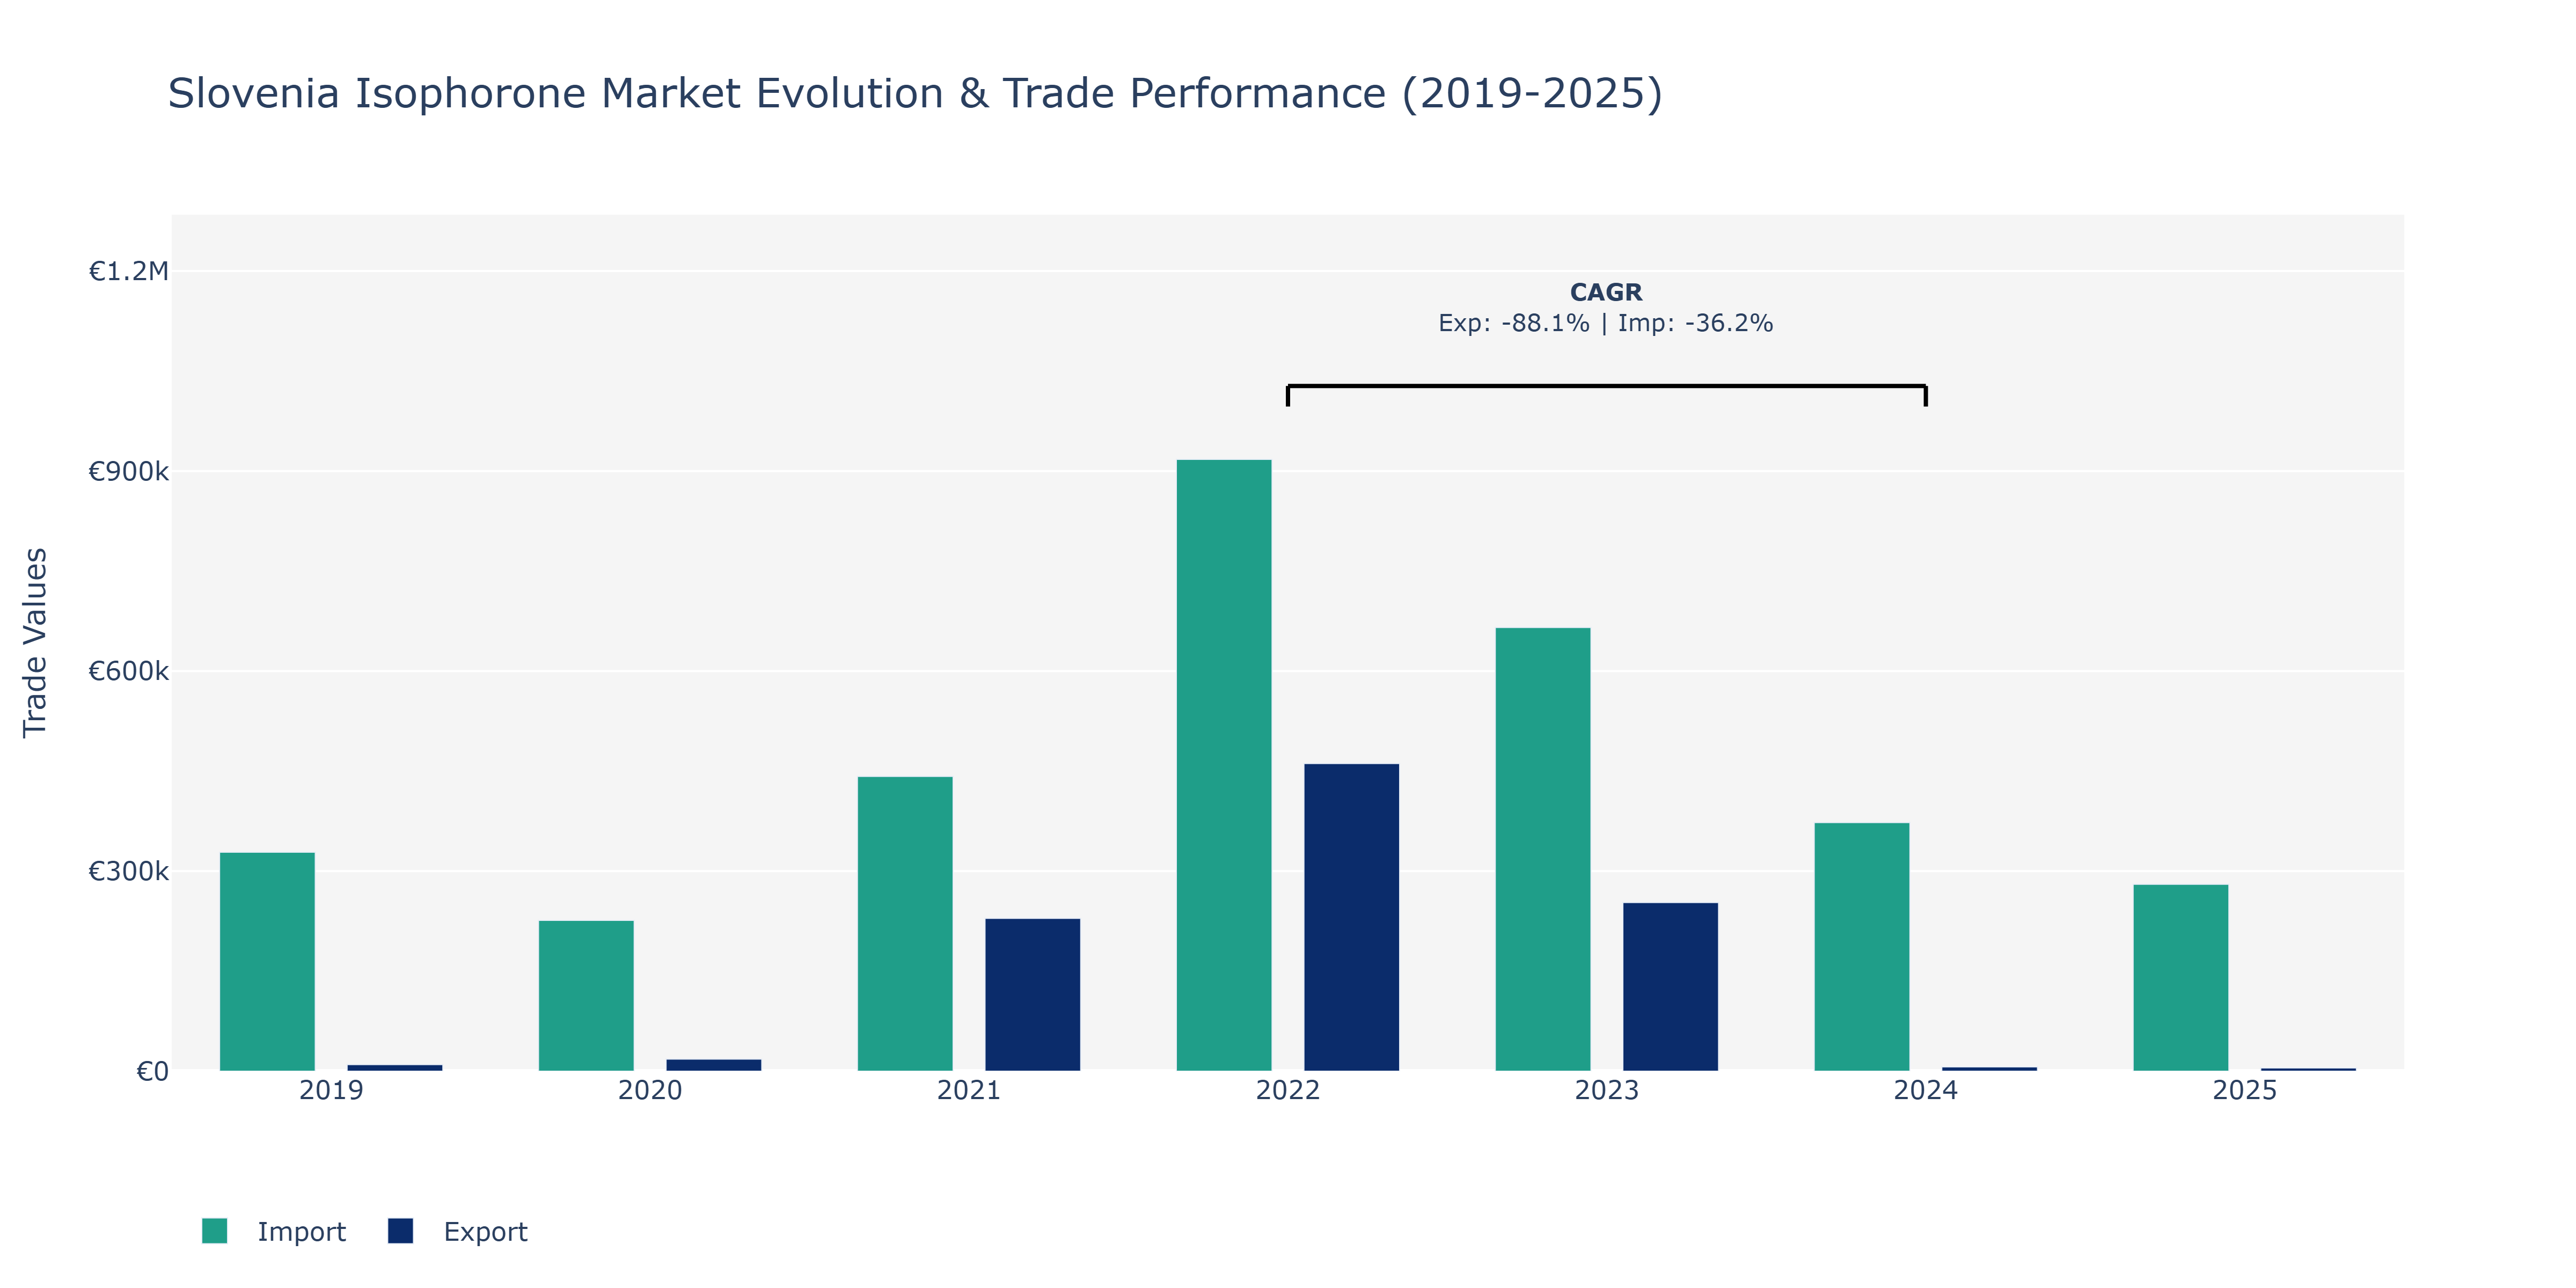
In the Slovenia Isophorone Market, from 2019 to 2025, both exports and imports experienced notable fluctuations. Exports began at €9.8 thousand in 2019, rose sharply to €229.11 thousand in 2021, and peaked at €461.34 thousand in 2022 before declining to €6.51 thousand in 2024 and €4.9 thousand in 2025. This fluctuation may be attributed to shifts in market demand, global economic conditions, and competitive pressures within the industry. In contrast, imports started at €328.31 thousand in 2019, decreased to €226.18 thousand in 2020, then surged to €917.5 thousand in 2022, showing a gradual decline to €372.89 thousand in 2024 and €280.32 thousand in 2025. The rise and fall of imports could be influenced by supply chain disruptions, government policies, and changing raw material costs. These trends highlight the market's sensitivity to various external factors, necessitating strategic planning to navigate uncertainties effectively.
Key Highlights of the Report:
- Slovenia Isophorone Market Outlook
- Market Size of Slovenia Isophorone Market, 2025
- Forecast of Slovenia Isophorone Market, 2032
- Historical Data and Forecast of Slovenia Isophorone Revenues & Volume for the Period 2022-2032F
- Slovenia Isophorone Market Trend Evolution
- Slovenia Isophorone Market Drivers and Challenges
- Slovenia Isophorone Price Trends
- Slovenia Isophorone Porter's Five Forces
- Slovenia Isophorone Industry Life Cycle
- Historical Data and Forecast of Slovenia Isophorone Market Revenues & Volume By End-user for the Period 2022-2032F
- Historical Data and Forecast of Slovenia Isophorone Market Revenues & Volume By Paints and Coatings for the Period 2022-2032F
- Historical Data and Forecast of Slovenia Isophorone Market Revenues & Volume By Printing Inks for the Period 2022-2032F
- Historical Data and Forecast of Slovenia Isophorone Market Revenues & Volume By Artificial Leather for the Period 2022-2032F
- Historical Data and Forecast of Slovenia Isophorone Market Revenues & Volume By Adhesives for the Period 2022-2032F
- Historical Data and Forecast of Slovenia Isophorone Market Revenues & Volume By Agrochemicals for the Period 2022-2032F
- Historical Data and Forecast of Slovenia Isophorone Market Revenues & Volume By Composites for the Period 2022-2032F
- Historical Data and Forecast of Slovenia Isophorone Market Revenues & Volume By Other for the Period 2022-2032F
- Slovenia Isophorone Import Export Trade Statistics
- Market Opportunity Assessment By End-user
- Slovenia Isophorone Top Companies Market Share
- Slovenia Isophorone Competitive Benchmarking By Technical and Operational Parameters
- Slovenia Isophorone Company Profiles
- Slovenia Isophorone Key Strategic Recommendations
Frequently Asked Questions About the Market Study (FAQs):
6Wresearch actively monitors the Slovenia Isophorone Market and publishes its comprehensive annual report, highlighting emerging trends, growth drivers, revenue analysis, and forecast outlook. Our insights help businesses to make data-backed strategic decisions with ongoing market dynamics. Our analysts track relevent industries related to the Slovenia Isophorone Market, allowing our clients with actionable intelligence and reliable forecasts tailored to emerging regional needs.
Yes, we provide customisation as per your requirements. To learn more, feel free to contact us on sales@6wresearch.com
1 Executive Summary |
2 Introduction |
2.1 Key Highlights of the Report |
2.2 Report Description |
2.3 Market Scope & Segmentation |
2.4 Research Methodology |
2.5 Assumptions |
3 Slovenia Isophorone Market Overview |
3.1 Slovenia Country Macro Economic Indicators |
3.2 Slovenia Isophorone Market Revenues & Volume, 2022 & 2032F |
3.3 Slovenia Isophorone Market - Industry Life Cycle |
3.4 Slovenia Isophorone Market - Porter's Five Forces |
3.5 Slovenia Isophorone Market Revenues & Volume Share, By End-user, 2022 & 2032F |
4 Slovenia Isophorone Market Dynamics |
4.1 Impact Analysis |
4.2 Market Drivers |
4.2.1 Increasing demand for isophorone in the production of coatings, adhesives, and sealants |
4.2.2 Growth in the construction industry leading to higher consumption of isophorone-based products |
4.2.3 Technological advancements enhancing the efficiency of isophorone production processes |
4.3 Market Restraints |
4.3.1 Fluctuating prices of raw materials used in isophorone production |
4.3.2 Stringent environmental regulations impacting the manufacturing processes of isophorone |
4.3.3 Competition from alternative chemicals affecting the demand for isophorone |
5 Slovenia Isophorone Market Trends |
6 Slovenia Isophorone Market, By Types |
6.1 Slovenia Isophorone Market, By End-user |
6.1.1 Overview and Analysis |
6.1.2 Slovenia Isophorone Market Revenues & Volume, By End-user, 2022-2032F |
6.1.3 Slovenia Isophorone Market Revenues & Volume, By Paints and Coatings, 2022-2032F |
6.1.4 Slovenia Isophorone Market Revenues & Volume, By Printing Inks, 2022-2032F |
6.1.5 Slovenia Isophorone Market Revenues & Volume, By Artificial Leather, 2022-2032F |
6.1.6 Slovenia Isophorone Market Revenues & Volume, By Adhesives, 2022-2032F |
6.1.7 Slovenia Isophorone Market Revenues & Volume, By Agrochemicals, 2022-2032F |
6.1.8 Slovenia Isophorone Market Revenues & Volume, By Composites, 2022-2032F |
7 Slovenia Isophorone Market Import-Export Trade Statistics |
7.1 Slovenia Isophorone Market Export to Major Countries |
7.2 Slovenia Isophorone Market Imports from Major Countries |
8 Slovenia Isophorone Market Key Performance Indicators |
8.1 Research and development investment in isophorone-based product innovation |
8.2 Adoption rate of isophorone in emerging applications such as pharmaceuticals or electronics |
8.3 Number of patents filed for new isophorone-related technologies or products |
9 Slovenia Isophorone Market - Opportunity Assessment |
9.1 Slovenia Isophorone Market Opportunity Assessment, By End-user, 2022 & 2032F |
10 Slovenia Isophorone Market - Competitive Landscape |
10.1 Slovenia Isophorone Market Revenue Share, By Companies, 2025 |
10.2 Slovenia Isophorone Market Competitive Benchmarking, By Operating and Technical Parameters |
11 Company Profiles |
12 Recommendations |
13 Disclaimer |
Global Go To Market Strategy - 2030
Export potential enables firms to identify high-growth global markets with greater confidence by combining advanced trade intelligence with a structured quantitative methodology. The framework analyzes emerging demand trends and country-level import patterns while integrating macroeconomic and trade datasets such as GDP and population forecasts, bilateral import–export flows, tariff structures, elasticity differentials between developed and developing economies, geographic distance, and import demand projections. Using weighted trade values from 2020–2024 as the base period to project country-to-country export potential for 2030, these inputs are operationalized through calculated drivers such as gravity model parameters, tariff impact factors, and projected GDP per-capita growth. Through an analysis of hidden potentials, demand hotspots, and market conditions that are most favorable to success, this method enables firms to focus on target countries, maximize returns, and global expansion with data, backed by accuracy.
By factoring in the projected importer demand gap that is currently unmet and could be potential opportunity, it identifies the potential for the Exporter (Country) among 190 countries, against the general trade analysis, which identifies the biggest importer or exporter.
To discover high-growth global markets and optimize your business strategy:
Click Here
Pricing
- Single User License$ 1,995
- Department License$ 2,400
- Site License$ 3,120
- Global License$ 3,795

Leadership Perspectives from Industry Events
Search
Thought Leadership and Analyst Meet


Our Clients
6WResearch In News
- Doha a strategic location for EV manufacturing hub: IPA Qatar
- Demand for luxury TVs surging in the GCC, says Samsung
- Empowering Growth: The Thriving Journey of Bangladesh’s Cable Industry
- Demand for luxury TVs surging in the GCC, says Samsung
- Video call with a traditional healer? Once unthinkable, it’s now common in South Africa
- Intelligent Buildings To Smooth GCC’s Path To Net Zero
Latest Reports
- Taiwan Airport Wireless Infrastructure Market (2026-2032)
- Vietnam Airport Wireless Infrastructure Market (2026-2032)
- Thailand Airport Wireless Infrastructure Market (2026-2032)
- South Korea Airport Wireless Infrastructure Market (2026-2032)
- Romania Airport Wireless Infrastructure Market (2026-2032)
- Qatar Airport Wireless Infrastructure Market (2026-2032)
- Philippines Airport Wireless Infrastructure Market (2026-2032)
- Japan Airport Wireless Infrastructure Market (2026-2032)
- Taiwan Airport Winter Services Market (2026-2032)
- Vietnam Airport Winter Services Market (2026-2032)
Industry Events and Analyst Meet

HIMTEX 2026

India Refining Summit 2026

India EV Show 2026

EV tech India Expo 2026

Auto Tech Asia 2026
Whitepaper
- Middle East & Africa Commercial Security Market Click here to view more.
- Middle East & Africa Fire Safety Systems & Equipment Market Click here to view more.
- GCC Drone Market Click here to view more.
- Middle East Lighting Fixture Market Click here to view more.
- GCC Physical & Perimeter Security Market Click here to view more.